2D vs 3D Cell Culture Models: A Comprehensive Guide to Drug Screening Pros, Cons, and Best Practices
This article provides a detailed comparative analysis of 2D and 3D cell culture models for modern drug screening.
2D vs 3D Cell Culture Models: A Comprehensive Guide to Drug Screening Pros, Cons, and Best Practices
Abstract
This article provides a detailed comparative analysis of 2D and 3D cell culture models for modern drug screening. Designed for researchers and drug development professionals, it explores the foundational biology, practical methodologies, and troubleshooting strategies for each model. We systematically examine their respective advantages and limitations in predicting compound efficacy, toxicity, and pharmacokinetics. The content culminates in a data-driven validation framework to help scientists select, optimize, and integrate these models for more predictive, efficient, and translatable preclinical research.
Understanding the Core Biology: From Monolayers to Microenvironments
Within the ongoing research paradigm evaluating 2D versus 3D cell culture models for drug screening, the traditional two-dimensional (2D) monolayer system remains the foundational in vitro workhorse. This guide details its technical definition, standardized protocols, and enduring role in preclinical research, providing a baseline against which 3D model pros and cons are critically assessed.
Technical Definition and Core Characteristics
A 2D cell culture is defined by the growth of a single layer of adherent cells on a flat, rigid plastic or glass surface, submerged in a nutrient-rich liquid medium. Cells attach, spread, and proliferate until they form a confluent monolayer, at which point contact inhibition typically halts further division. This simplicity underpins its widespread use but also imposes physiological limitations, including altered cell morphology, polarization, and signaling due to unnatural substrate stiffness and the absence of tissue-like architecture.
Standardized Experimental Protocols
Protocol: Routine Subculture (Passaging) of Adherent Monolayers
Purpose: To maintain cells in exponential growth phase and expand cell lines for experiments. Materials: See "Research Reagent Solutions" table. Procedure:
- Aspiration: Remove and discard the spent culture medium from the flask.
- Washing: Gently rinse the cell monolayer with 3-5 mL of pre-warmed 1X PBS (Ca²⁺/Mg²⁺ free) to remove residual serum and divalent cations that inhibit trypsin.
- Detachment: Add 1-3 mL of pre-warmed 0.25% Trypsin-EDTA solution to cover the monolayer. Incubate at 37°C for 1-5 minutes (monitor under microscope until cells round up and detach).
- Neutralization: Add an equal or greater volume of complete growth medium (containing FBS) to neutralize the trypsin.
- Centrifugation: Transfer cell suspension to a conical tube. Centrifuge at 200-300 x g for 5 minutes. Aspirate supernatant.
- Resuspension & Seeding: Resuspend cell pellet in fresh complete medium. Count cells using a hemocytometer or automated counter. Seed at desired density into new culture vessels with pre-warmed medium.
- Incubation: Place culture in a humidified 37°C incubator with 5% CO₂.
Protocol: Cell Viability/Cytotoxicity Assay (MTT)
Purpose: To assess compound toxicity or cell proliferation in a 2D monolayer, a cornerstone of drug screening. Procedure:
- Seeding: Seed cells in a 96-well plate at an optimized density (e.g., 5,000-10,000 cells/well). Incubate for 24 hours for attachment.
- Treatment: Prepare serial dilutions of the test compound in culture medium. Aspirate old medium from wells and add 100-200 µL of treatment medium per well. Include vehicle-only controls and blank wells (medium only, no cells). Incubate for desired exposure time (e.g., 24, 48, 72h).
- MTT Addition: Add 10-20 µL of MTT reagent (5 mg/mL in PBS) to each well. Incubate for 2-4 hours at 37°C.
- Solubilization: Carefully aspirate the medium. Add 100-150 µL of DMSO or acidified isopropanol to each well to dissolve the formed purple formazan crystals.
- Measurement: Shake plate gently for 5 minutes. Measure absorbance at 570 nm (reference ~690 nm) using a microplate reader.
- Analysis: Calculate cell viability: % Viability = [(Abssample - Absblank)/(Absvehicle control - Absblank)] * 100.
Data Presentation: Quantitative Comparisons
Table 1: Key Parameters of 2D Monolayer Culture in Drug Screening
| Parameter | Typical Value/Range | Implication for Drug Screening |
|---|---|---|
| Setup Time | 1-3 days | Rapid initiation of screening campaigns. |
| Throughput | Very High (96, 384, 1536-well plates) | Ideal for primary HTS (High-Throughput Screening). |
| Cost per Assay | Low | Economical for large-scale compound libraries. |
| Oxygen Gradient | Negligible | Lacks physiological hypoxia present in tumors. |
| Nutrient/Waste Gradient | Minimal | All cells experience near-identical conditions. |
| Cell-Cell Contacts | Limited to lateral edges | Lacks complex 3D tissue interactions. |
| ECM (Extracellular Matrix) Interaction | Basal attachment only (e.g., plastic, coated surface) | Non-physiological mechanotransduction signaling. |
| Clinical Predictivity (General) | Moderate to Low | Often fails to predict in vivo efficacy/toxicity due to oversimplification. |
| Ease of Analysis | High (simple microscopy, lysis) | Compatible with vast array of established, automated readouts. |
Key Signaling Pathway in 2D vs. 3D Context
A critical pathway differentially regulated in 2D monolayers is the HIPPO-YAP/TAZ pathway, which controls cell proliferation and is highly sensitive to cell shape, density, and ECM mechanics.
Diagram Title: HIPPO-YAP Pathway Activation on Rigid 2D Substrates
Experimental Workflow for 2D Drug Screening
Diagram Title: Standard 2D Monolayer Drug Screening Workflow
The Scientist's Toolkit: Research Reagent Solutions
Table 2: Essential Materials for 2D Monolayer Culture & Screening
| Item | Function/Benefit | Example/Note |
|---|---|---|
| Tissue Culture-Treated Polystyrene Flasks/Plates | Surface is charge-modified for optimal cell attachment and spreading. | Corning Costa; standard for most adherent lines. |
| Complete Growth Medium | Provides nutrients, growth factors, and hormones. Typically basal medium + serum. | DMEM + 10% FBS for many mammalian lines. |
| Fetal Bovine Serum (FBS) | Complex supplement containing proteins, lipids, and attachment factors. | Batch testing is critical for reproducibility. |
| Trypsin-EDTA Solution | Proteolytic enzyme (trypsin) cleaves adhesion proteins; EDTA chelates Ca²⁺/Mg²⁺ to enhance detachment. | 0.25% Trypsin-0.53 mM EDTA is common. |
| DMSO (Cell Culture Grade) | Universal solvent for many drug compounds; used for cryopreservation. | Keep final concentration low (<0.1%) to avoid cytotoxicity. |
| MTT Reagent | Tetrazolium dye reduced by metabolically active cells to quantifiable formazan. | Gold standard for endpoint viability; measures mitochondrial activity. |
| Cell Counting Kit-8 (CCK-8) | WST-8 tetrazolium dye; one-step, non-radioactive alternative to MTT. | More soluble formazan; safer and faster. |
| Matrigel or Collagen I Coating | ECM-derived coating to enhance attachment or induce differentiation for specific cell types. | Used for primary cells or sensitive lines. |
| Automated Liquid Handler | Enables high-throughput, reproducible compound dispensing and reagent addition in 96/384-well formats. | Essential for large-scale screening. |
| Incucyte or Live-Cell Imager | Allows kinetic, label-free monitoring of cell confluence, health, and morphology in the incubator. | Provides temporal data without fixation. |
Within the paradigm of preclinical drug screening, the limitations of conventional two-dimensional (2D) monolayer cultures—such as aberrant polarization, loss of native tissue architecture, and inaccurate drug response—have driven the adoption of three-dimensional (3D) culture models. These systems aim to recapitulate critical aspects of the in vivo microenvironment, including cell-cell and cell-extracellular matrix (ECM) interactions, gradient formation, and physiologically relevant signaling. This technical guide defines and distinguishes the three primary classes of 3D culture models: spheroids, organoids, and scaffold-based systems, framing their development and application within the critical research context of improving the predictive validity of drug screening assays.
Model Definitions and Comparative Analysis
Spheroids
Spheroids are simple, self-assembled aggregates of cells, typically of a single or few cell types. They model basic tumor morphology with proliferating cells at the periphery and quiescent or necrotic cells in the hypoxic core, making them excellent for studying drug penetration and gradient effects.
Organoids
Organoids are complex, stem cell-derived structures that self-organize to mimic the architecture and function of a specific organ. They can be derived from pluripotent stem cells (PSCs) or adult stem cells (ASCs) and exhibit multilineage differentiation and tissue-specific organization.
Scaffold-Based Systems
These systems utilize natural or synthetic biocompatible matrices to provide structural and biochemical support for 3D cell growth. They offer high controllability over mechanical and chemical properties and can be used to engineer specific tissue constructs or tumor microenvironments.
Table 1: Comparative Overview of 3D Culture Models
| Feature | Spheroids | Organoids | Scaffold-Based Systems |
|---|---|---|---|
| Complexity | Low to Medium | High | Configurable (Low to High) |
| Cellular Source | Cell lines, primary cells | PSCs, ASCs | Cell lines, primary cells |
| Self-Organization | Yes (Aggregation) | Yes (Patterning & Differentiation) | No (Cell seeding into predefined scaffold) |
| ECM Component | Minimal, cell-secreted | Significant, cell-secreted & Matrigel | Provided by the scaffold (e.g., collagen, alginate, PCL) |
| Genetic Stability | High (cell lines) | Variable, can retain patient genetics | High |
| Typical Applications | High-throughput drug screening, hypoxia studies | Disease modeling, developmental biology, personalized medicine | Tissue engineering, metastasis modeling, mechanobiology studies |
| Throughput Potential | Very High | Medium (complex analysis) | Medium to High |
| Cost | Low | High | Medium |
Table 2: Quantitative Performance Metrics in Drug Screening Contexts (Representative Data)
| Model Type | Avg. Assay Duration | Z'-Factor (Viability Assay) | Concordance with In Vivo Response* | Typical Size Range |
|---|---|---|---|---|
| 2D Monolayer | 3-5 days | 0.6 - 0.8 | Low (~30-50%) | N/A |
| Spheroids | 7-14 days | 0.4 - 0.7 | Medium (~50-70%) | 200 - 500 µm |
| Organoids | 14-30+ days | 0.3 - 0.6 | High (~70-90%) | 100 - 1000+ µm |
| Scaffold-Based | 7-28 days | 0.4 - 0.7 | Medium-High (Variable) | Configurable |
*Concordance refers to the predictive value for clinical efficacy/toxicity, based on literature meta-analysis.
Key Experimental Protocols
Protocol: Generation of Tumor Spheroids via Ultra-Low Attachment Plates
Objective: To produce uniform, reproducible spheroids for high-throughput drug screening.
- Cell Preparation: Harvest subconfluent monolayer cells (e.g., HepG2, MCF-7) using standard trypsinization. Prepare a single-cell suspension in complete growth medium.
- Cell Seeding: Count cells and dilute suspension to desired density (e.g., 1,000 - 10,000 cells/well in 100 µL). Seed into round-bottom ultra-low attachment (ULA) microplates.
- Centrifugation: Centrifuge plates at 300 x g for 3 minutes to aggregate cells at the well bottom.
- Culture: Incubate plates at 37°C, 5% CO₂. Compact spheroids typically form within 24-72 hours.
- Drug Treatment: After spheroid formation, add 100 µL of medium containing 2X drug concentration. Refresh drug/media every 2-3 days.
- Endpoint Analysis: Proceed to viability assays (e.g., CellTiter-Glo 3D) or imaging.
Protocol: Establishing Patient-Derived Organoid (PDO) Cultures for Screening
Objective: To develop biobanks of tumor organoids that retain patient-specific drug responses.
- Tissue Processing: Mechanically dissociate and enzymatically digest (Collagenase/Dispase) fresh tumor biopsy in digestion buffer for 30-60 mins at 37°C.
- Washing: Pellet fragments, wash with PBS, and resuspend in Basement Membrane Extract (BME, e.g., Matrigel).
- Plating: Plate 30-50 µL BME-cell domes in pre-warmed tissue culture plates. Polymerize for 20-45 mins at 37°C.
- Overlay Medium: Gently add organoid-specific culture medium (containing niche factors like Wnt3a, R-spondin, Noggin) over the polymerized domes.
- Culture & Passaging: Culture, refreshing medium every 2-3 days. For passaging (every 7-14 days), dissociate domes mechanically/enzymatically, and re-embed fragments in fresh BME.
- Drug Screening: Plate organoids in high-density formats, treat with compound libraries after expansion, and assess viability/ morphology.
Signaling Pathways in 3D Morphogenesis
Experimental Workflow for 3D Drug Screening
The Scientist's Toolkit: Essential Research Reagents & Materials
Table 3: Key Reagent Solutions for 3D Culture Research
| Item | Function & Rationale |
|---|---|
| Basement Membrane Extract (BME/Matrigel) | Natural hydrogel providing a complex ECM for organoid and co-culture growth, rich in laminin, collagen, and growth factors. |
| Ultra-Low Attachment (ULA) Plates | Surfaces coated with hydrophilic hydrogel to inhibit cell attachment, forcing cell aggregation into spheroids. |
| Synthetic Hydrogels (e.g., PEG, Alginate) | Defined, tunable scaffolds allowing precise control over stiffness, porosity, and biofunctionalization (RGD peptides). |
| Organoid Culture Media Kits | Chemically defined or conditioned media supplements containing essential niche factors (Wnt3a, R-spondin, Noggin, EGF). |
| CellTiter-Glo 3D Cell Viability Assay | Optimized ATP-based luminescence assay with reagents that penetrate 3D structures for robust viability quantification. |
| Live-Cell Fluorescent Probes (e.g., Calcein AM/Propidium Iodide) | For longitudinal monitoring of viability and cytotoxicity within intact 3D structures via confocal imaging. |
| Tissue Dissociation Enzymes (e.g., Liberase, Accutase) | Gentle enzyme blends for dissociating primary tissues and 3D constructs into single cells for passaging or analysis. |
| Microplate Washer/Dispenser | Automated liquid handling for consistent media changes and compound addition in high-density screening formats. |
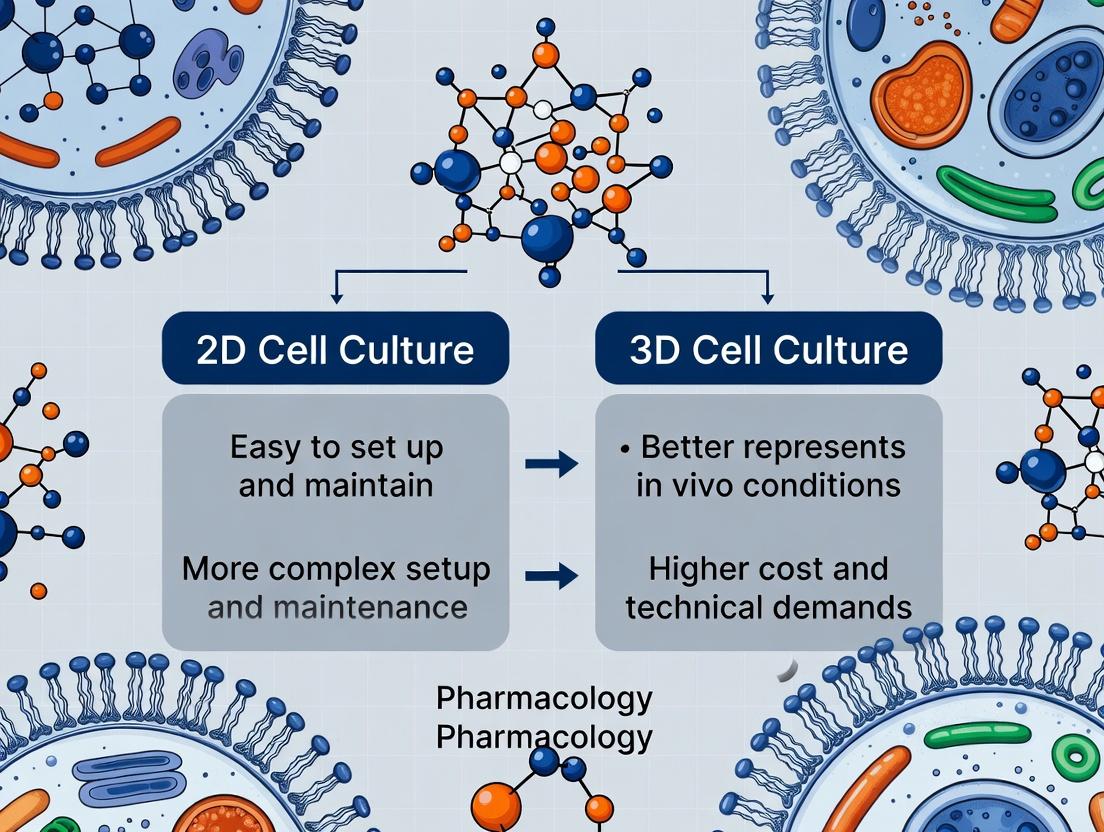
This whitepaper details the core biological differences in architecture, polarity, and cell-cell interactions as they manifest in 2D versus 3D cell culture models, framed within the critical context of modern drug screening. The limitations of traditional 2D monolayers in recapitulating the in vivo tissue microenvironment are a major contributor to the high attrition rates in drug development. This document provides a technical guide to these differences, supported by quantitative data, experimental protocols, and essential resources for researchers.
While 2D cell cultures have been a fundamental tool, they fail to replicate the complex spatial, mechanical, and biochemical cues of native tissues. This leads to significant discrepancies in gene expression, signaling pathway activity, drug response, and resistance mechanisms. Understanding the distinctions in architecture, polarity, and interactions is paramount for developing predictive 3D models, such as spheroids, organoids, and bioreactor-based systems, that can bridge the gap between in vitro assays and clinical outcomes.
Architectural Dichotomy: Planar vs. Spatial Organization
The most fundamental difference lies in the physical geometry of cell growth, which dictates nutrient gradients, mechanical stress, and cell-ECM engagement.
Table 1: Quantitative Comparison of Architectural Features
| Feature | 2D Monolayer Culture | 3D Spheroid/Organoid Culture | Measurable Impact on Drug Screening |
|---|---|---|---|
| Cell-ECM Contact | Uniform, basal-only (1D) | Omnidirectional, 3D engagement | Alters integrin signaling & survival pathways. |
| Proliferation Gradient | Homogeneous, high | Outer proliferating, inner quiescent/necrotic zones (Hypoxia) | Mimics solid tumor drug resistance; affects cell-cycle-targeting agents. |
| Oxygen Gradient (pO₂) | Near-homogeneous (~20%) | Core can drop to < 0.1% in spheroids >500µm | Induces HIF-1α stabilization, altering metabolism & gene expression. |
| Nutrient/Waste Gradients | Minimal | Steep gradients from periphery to core | Creates micro-environments with varying pH and metabolic activity. |
| Apoptotic/Necrotic Core | Absent | Present in spheroids >~400-500µm diameter | Impacts biomarker release and penetration efficacy of therapeutics. |
| Mechanical Properties (Young's Modulus) | Dictated by rigid plastic (~GPa) | Tissue-like (0.1 - 10 kPa) | Alters mechanotransduction (YAP/TAZ signaling) and cell differentiation. |
Experimental Protocol: Measuring Hypoxic Core Formation in 3D Spheroids
Objective: To quantify the development of hypoxia in multicellular tumor spheroids (MCTS) over time using a fluorescent hypoxia probe. Materials: U-87 MG cells, low-attachment U-bottom 96-well plate, DMEM complete medium, Image-iT Hypoxia Reagent (Green), Hoechst 33342, confocal microscope. Procedure:
- Seed 5,000 cells/well in the U-bottom plate. Centrifuge at 300 x g for 3 min to aggregate cells.
- Incubate at 37°C, 5% CO₂. Allow spheroid formation over 3-5 days.
- On day 5, add 5 µM Image-iT Hypoxia Reagent and 2 µg/mL Hoechst 33342 to the medium.
- Incubate for 4 hours at 37°C.
- Acquire z-stack images using confocal microscopy (Ex/Em ~488/520 nm for hypoxia probe; ~350/461 nm for Hoechst).
- Analyze fluorescence intensity profiles from spheroid periphery to core using ImageJ software.
Diagram Title: Workflow: Quantifying Hypoxia in 3D Spheroids
Polarity and Differentiation: Surface-Driven vs. Self-Organized
Cell polarity—the asymmetric organization of cellular components—is aberrant or absent in 2D but is a hallmark of functional 3D structures.
Table 2: Polarity and Differentiation States in Culture Models
| Aspect | 2D Monolayer | 3D Model (e.g., Enteroid, Hepatic Spheroid) | Consequence for Drug ADME/Tox |
|---|---|---|---|
| Apical-Basal Polarity | Disrupted, often mixed localization of markers | Properly established; apical lumen inward, basal surface outward | Critical for transport studies (e.g., intestinal absorption, biliary excretion). |
| Tight Junction Formation | Formed but may be less structured | Mature, physiologically relevant barrier (higher transepithelial electrical resistance - TEER) | Predicts compound permeability and blood-brain barrier penetration more accurately. |
| Secretory Function | Diminished and/or mislocalized | Polarized secretion (e.g., apical albumin in hepatocytes, mucin in enteroids) | Enables functional assessment of organ-specific toxicity and biomarker production. |
| Cytoskeletal Organization | Stress fibers dominate due to high substrate stiffness | Tissue-like organization, supporting morphogenesis | Influences cell shape, division axis, and organoid budding. |
Experimental Protocol: Assessing Apical-Basal Polarity in Intestinal Organoids
Objective: To visualize the establishment of apical (luminal) polarity using fluorescent staining for apical markers. Materials: Mouse intestinal organoids (day 5-7), Matrigel, 4% PFA, Permeabilization buffer (0.5% Triton X-100), Blocking buffer (5% BSA), Primary antibody (anti-ZO-1 or anti-aPKCζ), Phalloidin (F-actin stain), Secondary antibody, Confocal microscope. Procedure:
- Fix organoids in Matrigel droplets with 4% PFA for 30 min at RT.
- Permeabilize and block with 0.5% Triton X-100 in 5% BSA for 1 hour.
- Incubate with primary antibody in blocking buffer overnight at 4°C.
- Wash 3x with PBS. Incubate with secondary antibody and Phalloidin for 2 hours at RT.
- Wash and mount for imaging.
- Acquire high-resolution z-stack images. Co-localization of the apical marker (ZO-1) with the inner luminal surface, opposite to basal nuclei, confirms polarity.
Diagram Title: Signaling Pathways Driving Apical-Basal Polarity in 3D
Cell-Cell Interactions: From Lateral Contacts to a Communal Network
Interactions in 2D are limited to lateral contacts. In 3D, cells communicate in all directions through enhanced juxtacrine, paracrine, and gap junction signaling.
Table 3: Spectrum of Cell-Cell Interactions in 2D vs. 3D
| Interaction Type | 2D Culture Characteristics | 3D Culture Characteristics | Drug Screening Implication |
|---|---|---|---|
| Adhesive Junctions (E-cadherin) | Uniform at cell borders. | Dynamic, often increased and spatially regulated. | Impacts EMT and cancer cell invasion assays. |
| Gap Junctions (Connexin 43) | Often downregulated. | Restored, facilitating intercellular communication. | Alters bystander effects in radiation/therapy. |
| Paracrine Signaling | Diluted into bulk medium. | Captured in matrix, creating stable gradients (e.g., Wnt, TGF-β). | Enables autocrine/paracrine loops critical for stem cell maintenance. |
| Immune Cell Engagement | Difficult to co-culture; lack of migratory space. | Can be modeled with embedded immune cells in matrix. | Enables study of tumor-immune cell interactions and immunotherapies. |
| Heterotypic Interactions | Possible but in unnatural geometry (e.g., Transwell). | Physiologically relevant spatial arrangement (e.g., stromal cells surrounding epithelium). | Improves modeling of tumor microenvironment and stromal-induced resistance. |
Experimental Protocol: Evaluating Gap Junctional Intercellular Communication (GJIC) in 3D Spheroids
Objective: To assess functional GJIC using the Fluorescence Recovery After Photobleaching (FRAP) technique. Materials: MCF-7 spheroids, CellTracker Green CMFDA dye, Confocal microscope with FRAP module, Imaging chamber. Procedure:
- Load pre-formed spheroids with 5 µM CellTracker Green for 30 min. Wash.
- Transfer a single spheroid to an imaging chamber with fresh medium.
- Select a region of interest (ROI) of 2-3 cells in the spheroid periphery. Acquire a pre-bleach image.
- Bleach the selected ROI with high-intensity 488 nm laser.
- Immediately begin time-lapse imaging at low laser power every 30 seconds for 15-20 minutes.
- Quantify fluorescence intensity recovery in the bleached ROI over time. Calculate the half-time of recovery (t½) and mobile fraction, which are indicators of GJIC efficiency.
The Scientist's Toolkit: Essential Research Reagent Solutions
Table 4: Key Reagents for Characterizing 2D vs. 3D Biological Differences
| Reagent / Material | Function / Application | Example Product (Non-exhaustive) |
|---|---|---|
| Basement Membrane Extract (BME) | Provides a biologically active 3D scaffold for organoid culture, rich in laminin, collagen IV, and growth factors. | Corning Matrigel, Cultrex BME. |
| Low-Adhesion / Spheroid Microplates | U- or V-bottom plates with ultra-low attachment coating to promote aggregate formation via forced aggregation. | Corning Spheroid Microplates, Nunclon Sphera plates. |
| Live-Cell Hypoxia Probes | Chemical probes that become fluorescent under low oxygen tension for imaging hypoxic regions. | Image-iT Hypoxia Reagents, LOX-1. |
| Transepithelial Electrical Resistance (TEER) Electrodes | Measure the integrity and tight junction formation in polarized epithelial/endothelial barriers in real-time. | STX100C Chopstick Electrodes (World Precision Instruments). |
| Fluorescent Cell Linker Dyes (for Co-culture) | Track different cell populations in 3D co-culture systems via stable, non-transferable fluorescent labeling. | CellTracker dyes (CMFDA, CMTMR), PKH26/PKH67. |
| FRAP-Compatible Live-Cell Dyes | Vital dyes for FRAP assays to measure dynamics of cellular structures and intercellular communication. | Calcein-AM, CellMask dyes. |
| Cytoskeleton Probes | Phalloidin conjugates to visualize F-actin organization in fixed 3D structures. | Alexa Fluor Phalloidin. |
| 3D-Compatible Fixatives & Permeabilizers | Optimized for deep penetration and preservation of 3D morphology for immunohistochemistry. | e.g., 4% PFA with slow rotation; TrueBlack Lipofuscin Autofluorescence Quencher. |
The central thesis of modern in vitro modeling hinges on a critical dichotomy: conventional two-dimensional (2D) monolayers on plastic versus three-dimensional (3D) cultures. While 2D models have been the workhorse of drug screening for decades, their profound limitations in predicting clinical outcomes are now clear. These limitations stem from a fundamental "Microenvironment Gap"—the absence of the complex, physiologically relevant cell-cell and cell-matrix interactions found in living tissues. This whitepaper posits that 3D models, by bridging this gap, offer superior mimicry of tissue physiology, leading to more predictive data for drug efficacy and toxicity screening. The transition from 2D to 3D is not merely a technical change but a paradigm shift towards biologically faithful systems.
The Pillars of the Physiological Microenvironment
The tissue microenvironment is a multi-factorial niche. 3D models recapitulate its core pillars, which are largely absent in 2D.
- Spatial Architecture & Polarity: In tissues, cells are oriented in three dimensions, establishing apical-basal polarity and forming complex structures like lumens and ducts. 2D culture forces cells into a flattened, unnatural morphology.
- Cell-Cell & Cell-ECM Interactions: In 3D, cells are surrounded by neighbors and extracellular matrix (ECM) on all sides, enabling adhesive junctions, gap junctions, and mechanical signaling through integrins that regulate survival, proliferation, and differentiation.
- Gradient Formation: Critical physiological gradients of oxygen, nutrients, signaling molecules, and drugs form naturally in 3D masses. This leads to heterogeneous proliferative zones and, in models like spheroids, the development of a necrotic core—a hallmark of avascular tumors.
- Mechanical Forces & Stiffness: Native tissues have specific, often soft, mechanical properties (elasticity). 3D matrices (e.g., soft hydrogels) mimic this, whereas rigid plastic dishes aberrantly activate mechanotransduction pathways like YAP/TAZ, driving proliferation.
Quantitative Evidence: 2D vs. 3D Comparative Data
Table 1: Comparative Analysis of Key Physiological Parameters in 2D vs. 3D Cultures
| Parameter | 2D Monolayer | 3D Model (e.g., Spheroid/Organoid) | Physiological Relevance Impact |
|---|---|---|---|
| Gene Expression Profile | Significantly divergent from in vivo tissue. | ~70-80% closer to in vivo transcriptome. | 3D models better reflect tissue-specific function and drug target expression. |
| Drug IC50 Values | Often 10-1000x lower (more sensitive) than in vivo. | Typically 10-100x higher, aligning closer to in vivo efficacy. | 3D models predict clinical drug resistance more accurately, reducing false positives. |
| Proliferation Rate | Uniformly high and constant. | Heterogeneous: high at periphery, low/quiescent in interior. | Mimics tumor growth and stem cell niche dynamics. |
| Hypoxia & Necrosis | Absent. | Present in cores of spheroids >400-500 μm. | Critical for studying hypoxia-targeted therapies and tumor pathobiology. |
| Differentiation Capacity | Limited, often de-differentiates. | Enhanced, sustains tissue-specific cell types. | Essential for disease modeling and developmental biology. |
Table 2: Impact of Microenvironment on Key Signaling Pathways
| Pathway | Status in 2D | Status in 3D/Physiologic | Consequence for Drug Screening |
|---|---|---|---|
| HIPPO-YAP/TAZ | Constitutively active (nuclear YAP) due to high tension. | Appropriately regulated; cytoplasmic in inner cells. | 2D overstates proliferation-linked target dependence. |
| WNT/β-catenin | Often requires exogenous ligands. | Self-regulated through cell-cell contacts and secretion. | Autocrine signaling in 3D better models tissue homeostasis and cancer. |
| EGFR/MAPK | Hyper-sensitive to ligand stimulation. | Attenuated response; mimics in vivo receptor downregulation. | 3D predicts efficacy of targeted kinase inhibitors more reliably. |
| Apoptosis (Caspase-3) | Easily induced by stressors. | Markedly suppressed, especially in core cells. | Explains chemoresistance phenomena seen in patients. |
Experimental Protocols for Key 3D Assays
Protocol 1: Generation of Tumor Spheroids for Drug Screening via Ultra-Low Attachment Plates
- Cell Preparation: Harvest monolayer cells (e.g., NCI-H460 lung carcinoma) via trypsinization. Count and resuspend in complete growth medium.
- Seeding: Prepare a cell suspension at 5,000 cells/mL. Aliquot 100 μL per well (500 cells/well) into a 96-well round-bottom ultra-low attachment (ULA) plate.
- Centrifugation: Centrifuge the plate at 300 x g for 3 minutes to aggregate cells at the well bottom.
- Incubation: Incubate at 37°C, 5% CO₂ for 72-96 hours. Compact, spherical spheroids will form.
- Drug Treatment: After spheroid formation, prepare 2X drug solutions in medium. Carefully add 100 μL of 2X drug solution to each well containing 100 μL of existing medium. Use a multichannel pipette, pipetting slowly against the well wall.
- Incubation & Analysis: Incubate for an additional 72-120 hours. Assess viability using assays like CellTiter-Glo 3D (which measures ATP) and image for size/morphology changes using an inverted microscope.
Protocol 2: Embedding Organoids in Basement Membrane Extract for Long-Term Culture
- Material Pre-cooling: Thaw Basement Membrane Extract (BME, e.g., Corning Matrigel) on ice overnight. Pre-cool tips, tubes, and a 24-well plate at 4°C.
- Organoid Harvest: Centrifuge organoids (e.g., intestinal) from culture, remove supernatant. Keep pellet on ice.
- Mixing: Gently resuspend the organoid pellet in cold BME at a ratio of ~100-200 organoids per 50 μL of BME. Avoid introducing bubbles.
- Plating: Pipette 30-50 μL drops of the BME-organoid suspension into the center of each pre-cooled well. Carefully place the plate in a 37°C incubator for 20-30 minutes to allow the BME to polymerize.
- Overlaying Medium: Once polymerized (solid), gently overlay each drop with 500-750 μL of pre-warmed, appropriate organoid growth medium.
- Culture: Feed with fresh medium every 2-4 days. Passage by mechanically disrupting and digesting with enzyme solutions (e.g., TrypLE) every 7-14 days.
Visualizing Key Signaling and Workflow Relationships
Diagram 1: 2D vs 3D Mechanotransduction via YAP/TAZ
Diagram 2: 3D Spheroid Drug Screening Workflow
The Scientist's Toolkit: Essential Research Reagent Solutions
Table 3: Key Reagents and Materials for Advanced 3D Culture
| Item | Function & Rationale | Example Product/Brand |
|---|---|---|
| Basement Membrane Extract (BME) | A solubilized basement membrane preparation rich in laminin, collagen IV, and growth factors. Provides a physiologically relevant, soft 3D scaffold for organoid growth and differentiation. | Corning Matrigel, Cultrex BME |
| Ultra-Low Attachment (ULA) Plates | Plates with covalently bound hydrogel coating that inhibits protein and cell adhesion, promoting cell-cell aggregation and spontaneous spheroid formation. | Corning Spheroid Microplates, Nunclon Sphera |
| Synthetic Hydrogels | Defined, tunable polymers (e.g., PEG, peptide) that allow precise control over mechanical stiffness, degradability, and biochemical cues (RGD peptides). | PEG-based kits (Cellendes), PuraMatrix |
| Organoid Growth Media Kits | Specialty media formulations containing essential niche factors (e.g., R-spondin, Noggin, Wnt3a) to maintain stemness and direct lineage-specific organoid development. | IntestiCult, STEMdiff |
| 3D Viability Assay Kits | Optimized luminescent/fluorescent assays (e.g., ATP, caspase) with enhanced reagent penetration and lytic capacity for 3D structures. | CellTiter-Glo 3D, Caspase-Glo 3D |
| Dissociation Enzymes | Gentle, proprietary enzyme blends (non-mammalian origin) for dissociating 3D models into single cells for flow cytometry or sub-culturing without damaging cell surface epitopes. | TrypLE Select, Accumax |
Historical Context and Evolution in Drug Discovery
The historical evolution of drug discovery is a narrative of paradigm shifts, driven by advances in biology, chemistry, and technology. This progression is fundamentally intertwined with the models used to test therapeutic hypotheses, from whole-organism studies to increasingly reductionist in vitro systems. The central thesis of modern preclinical research critically examines the trade-offs between two primary models: two-dimensional (2D) monocultures and three-dimensional (3D) organoids/spheroids. While 2D models have been the historical workhorse, offering simplicity and high-throughput capability, 3D models promise a more physiologically relevant microenvironment, better replicating in vivo tissue architecture, cell-cell interactions, and gradient-dependent phenomena like drug penetration and hypoxia. This whitepaper contextualizes the historical milestones in drug discovery within this ongoing methodological debate, providing a technical guide for researchers navigating the selection of screening platforms.
Historical Eras and Model Evolution
The Empirical Era (Pre-20th Century)
Drug discovery originated in the observation of medicinal plants and natural products. Testing was performed directly on patients or in whole animals, providing a complete but unrefined physiological context with no controlled in vitro component.
The Target-Based Reductionist Era (Mid-20th Century)
The advent of cell culture techniques, like the establishment of the HeLa cell line in 1951, catalyzed a shift. The ability to grow human cells in monolayers (2D) on plastic revolutionized screening. This period was defined by the "one gene, one drug, one target" philosophy, perfectly served by 2D models. High-throughput screening (HTS) against molecular targets in 96-well plates became the gold standard.
The Genomic and Translational Era (21st Century)
The completion of the Human Genome Project and the rise of systems biology highlighted the limitations of oversimplified models. High clinical attrition rates, often due to efficacy failure, were partly attributed to the poor predictive power of 2D screens. This spurred the development of 3D culture systems—organoids, spheroids, and organ-on-a-chip technologies—designed to recapitulate tissue-specific morphology, stromal interactions, and multicellular complexity.
Table 1: Evolution of Drug Discovery Paradigms and Associated Models
| Era | Dominant Paradigm | Primary Screening Model | Key Advantage | Major Limitation |
|---|---|---|---|---|
| Empirical | Observation/Trial & Error | Whole Organism (Human/Animal) | Full physiological context | Unethical, unpredictable, no mechanistic insight |
| Reductionist | Target-Based HTS | 2D Monolayer Cell Culture | High-throughput, low-cost, simple analysis | Poor physiological relevance, lacks microenvironment |
| Translational | Systems Biology & Precision Medicine | 3D Organoids/Spheroids & Complex Co-cultures | Physiomimetic architecture, better predictive value | Throughput challenges, higher cost, complex data analysis |
Core Experimental Protocols: 2D vs 3D Screening
Protocol 1: Standard 2D Monolayer Cytotoxicity Assay
Objective: To determine the IC₅₀ of a compound against a cancer cell line grown in a monolayer.
- Cell Seeding: Harvest and count cells (e.g., HepG2). Seed 5,000-10,000 cells per well in a 96-well flat-bottom plate in 100 µL complete medium.
- Adherence: Incubate plate at 37°C, 5% CO₂ for 24 hours to allow cell adhesion and recovery.
- Compound Treatment: Prepare a serial dilution of the test compound (typically 1:3 or 1:10 dilutions across 8-10 concentrations). Add 100 µL of each dilution to assigned wells (n=3-6 replicates). Include vehicle control (0.1% DMSO) and blank (medium only) wells.
- Incubation: Incubate plate for 72 hours.
- Viability Readout: Add 20 µL of MTT reagent (5 mg/mL in PBS) per well. Incubate 3-4 hours. Carefully aspirate medium and solubilize formed formazan crystals with 150 µL DMSO. Shake gently.
- Analysis: Measure absorbance at 570 nm (reference 630-650 nm) on a plate reader. Calculate % viability relative to vehicle control. Fit dose-response curve using four-parameter logistic model to calculate IC₅₀.
Protocol 2: 3D Spheroid Viability/Drug Penetration Assay
Objective: To assess compound efficacy and penetration in a tumor spheroid model.
- Spheroid Generation (Hanging Drop or ULA Plate):
- Hanging Drop: Suspend cells at 500-1000 cells/25 µL drop in medium supplemented with methylcellulose (to stabilize drop). Pipette drops onto lid of a culture dish, invert lid over bottom filled with PBS for humidity. Incubate 3-5 days until spheroids form.
- Ultra-Low Attachment (ULA) Plate: Seed 5,000-20,000 cells per well in a 96-well ULA round-bottom plate in 150 µL medium. Centrifuge at 300 x g for 3 min to aggregate cells. Incubate 3-5 days, with media changes every 2 days.
- Spheroid Maturation & Treatment: Confirm spheroid formation (compact, spherical morphology). Transfer individual spheroids to 96-well flat-bottom plates (1/well) or treat directly in ULA plate. Add compound dilutions.
- Extended Incubation: Incubate for 5-7 days, with compound/media refresh every 2-3 days.
- Endpoint Analysis:
- Viability (ATP-based): Add an equal volume of CellTiter-Glo 3D reagent. Shake orbitally for 5 min to induce lysis, incubate 25 min, record luminescence.
- Imaging: Fix with 4% PFA, permeabilize (0.5% Triton X-100), stain for live/dead cells (Calcein AM/Propidium Iodide), nuclei (Hoechst), and analyze by confocal microscopy. Measure spheroid diameter and core penetration of PI signal.
Quantitative Comparison of Model Outputs
Table 2: Performance Metrics of 2D vs 3D Models in Drug Screening
| Metric | 2D Monolayer Model | 3D Spheroid/Organoid Model | Implication for Drug Discovery |
|---|---|---|---|
| Throughput | Very High (≥ 100k compounds/day) | Moderate to Low (≤ 10k compounds/day) | 2D preferred for primary HTS; 3D for secondary/mechanistic screening |
| Z'-Factor (Assay Quality) | Typically >0.7 (Excellent) | 0.4 - 0.7 (Moderate to Good) | 2D offers robust, reliable signal windows for HTS |
| IC₅₀ Concordance with In Vivo | Low; Often overestimates potency | Higher; Better predictive of in vivo efficacy | 3D models reduce false positives, improving translational hit rate |
| Proliferation Gradient | Homogeneous, exponential growth | Heterogeneous (proliferative rim, quiescent core) | 3D models better identify compounds targeting non-proliferating cells |
| Drug Penetration | Not a barrier; uniform exposure | Physiologic barrier; core often less exposed | 3D models identify compounds with poor penetration, a common clinical failure mode |
| Microenvironment (e.g., Hypoxia) | Absent | Present (hypoxic/necrotic core) | 3D enables screening of hypoxia-activated prodrugs or targeting hypoxic pathways |
| Cost per Well | Low (~$0.50 - $2) | High (~$5 - $50) | Economics favor 2D for large libraries; 3D costs are decreasing with automation |
Key Signaling Pathways in Tumor Microenvironment
Title: Therapeutic Challenge in 3D Tumor Microenvironment
Experimental Workflow for Comparative Screening
Title: Integrated 2D/3D Drug Screening Cascade
The Scientist's Toolkit: Essential Research Reagents & Materials
Table 3: Key Reagents for 2D vs 3D Drug Screening Experiments
| Reagent/Material | Function | Example Product/Catalog | Critical Application Note |
|---|---|---|---|
| Ultra-Low Attachment (ULA) Plate | Prevents cell adhesion, promotes 3D spheroid formation via forced aggregation. | Corning Costar Spheroid Microplate (#4516) | Round-bottom wells are essential for consistent, single-spheroid formation. |
| Basement Membrane Matrix | Provides a physiologically relevant scaffold for organoid growth and polarization. | Corning Matrigel (#356231) | Must be kept on ice to prevent premature polymerization; concentration affects stiffness. |
| MTT Reagent | Tetrazolium dye reduced by metabolically active cells to colored formazan (2D endpoint). | Sigma-Aldrich M2128 | Requires solubilization step (DMSO) post-incubation. Not optimal for 3D due to penetration issues. |
| CellTiter-Glo 3D | ATP-based luminescent viability assay optimized for lytic penetration of 3D structures. | Promega (#G9681) | Requires orbital shaking for sufficient spheroid lysis. Gold standard for 3D viability. |
| Calcein AM / Propidium Iodide (PI) | Live/Dead fluorescent dual stain for viability and imaging core penetration in spheroids. | Thermo Fisher Scientific (C3099 / P1304MP) | Calcein AM stains live cells (green), PI stains dead cells (red) with compromised membranes. |
| Methylcellulose | Increases medium viscosity to stabilize hanging drops for spheroid formation. | Sigma-Aldrich (M0512) | Used at 1-2% (w/v) in culture medium to prevent droplet evaporation and coalescence. |
| Hypoxia Probe (e.g., Pimonidazole) | Binds covalently to proteins in cells with pO₂ < 10 mm Hg, enabling hypoxic region detection. | Hypoxyprobe Kit (HP3) | Requires antibody-based detection post-fixation. Confirms physiologic hypoxia in 3D core. |
| Small Molecule Inhibitors (Pathway Controls) | Validate pathway relevance in 3D context (e.g., HIF-1α inhibitor for hypoxia studies). | EZN-2968 (HIF-1α inhibitor) | Used as positive/negative controls to confirm target engagement and phenotypic response in 3D. |
The historical trajectory of drug discovery reveals a continuous effort to balance predictive physiological relevance with experimental tractability. The 2D cell culture model was a revolutionary tool that enabled the high-throughput, target-centric paradigm of the late 20th century. However, the pressing need to reduce clinical attrition has driven the field toward more complex 3D models that recapitulate critical aspects of the tumor microenvironment. The future lies not in the wholesale replacement of one model by another, but in their strategic integration: using 2D models for primary high-volume screening and 3D models for secondary validation, mechanistic de-risking, and patient-derived organoid-based personalized medicine. This synergistic approach, informed by a clear understanding of each model's historical context and technical limitations, represents the evolution of a more robust and translationally predictive drug discovery pipeline.
Practical Implementation: Protocols, Platforms, and Screening Applications
In the ongoing evaluation of 2D vs. 3D cell culture models for drug screening, 2D systems remain the foundational, high-throughput workhorse for primary target identification and validation. While 3D models offer superior physiological mimicry, their complexity and cost often limit screening scale. This guide details the standardized protocols and automation strategies that make 2D screening an indispensable, efficient first pass in the modern drug discovery pipeline, enabling rapid hypothesis testing before resource-intensive 3D validation.
Core Standard Protocols for 2D Assays
Cell Seeding and Standardization
A uniform monolayer is critical for assay reproducibility.
Detailed Protocol:
- Cell Preparation: Harvest cells at mid-log phase. Determine viability via trypan blue exclusion (>95% required).
- Calculation: Calculate required cell suspension volume:
Volume (mL) = (Desired cells per well × Number of wells) / Cell concentration (cells/mL). - Seeding: Using a multichannel pipette or automated dispenser, seed cells in growth medium into tissue-culture treated microplates (e.g., 96-, 384-well).
- Settling: Allow plate to rest at room temperature for 30 min in a laminar flow hood to ensure even distribution before transferring to a 37°C, 5% CO₂ incubator.
- Incubation: Incubate for 24 hours (or until 70-80% confluency) prior to treatment.
Compound Treatment and Pharmacological Assays
Detailed Protocol for Dose-Response Screening:
- Compound Plate Preparation: Serially dilute compounds in DMSO (typically 1:3 dilutions, 10 points). Further dilute in assay medium so final DMSO concentration is ≤0.5%.
- Liquid Transfer: Using a pin tool or acoustic liquid handler (e.g., Echo), transfer 10-100 nL of compound from source plate to assay plate containing cells in medium.
- Incubation: Incubate compound with cells for a predetermined duration (e.g., 48-72h for viability).
- Assay Reagent Addition: Add viability reagent (e.g., 20 μL CellTiter-Glo 3D per 100 μL medium in 96-well plate). Orbital shake for 2 min, incubate 10 min at RT.
- Signal Detection: Read luminescence on a plate reader.
High-Throughput Automation (HTA) Workflow
Automation integrates discrete steps into a seamless, unattended operation.
Automated Workflow Protocol:
- Plate Hotel: Store source compound and cell assay plates.
- Robotic Arm: Transfers plates between stations.
- Automated Dispenser: Seeds cells (e.g., Multidrop Combi).
- Washer/Aspirator: Removes medium for wash steps.
- Nano-Dispenser: Adds compounds/reagents (e.g., Echo 655).
- Plate Reader: Detects signal (e.g., EnVision for fluorescence/luminescence).
- Data Analysis Station: Software (e.g., Genedata Screener) processes raw data.
Diagram Title: HTS Automated Screening Workflow
Key Signaling Pathways Interrogated in 2D Screens
2D screens effectively target core proliferation and survival pathways.
Diagram Title: Pro-Survival Pathways in 2D Drug Screens
Table 1: Operational Comparison of 2D and 3D Screening Platforms
| Parameter | 2D Monolayer Screening | 3D Spheroid/Organoid Screening |
|---|---|---|
| Throughput (wells/day) | 10,000 - 100,000 | 1,000 - 10,000 |
| Assay Cost per Well | $0.50 - $5.00 | $5.00 - $50.00 |
| Cell Usage (cells/well) | 1,000 - 10,000 | 5,000 - 50,000 |
| Protocol Duration | 24 - 72 hours | 7 - 28 days |
| Z'-Factor (Robustness) | 0.5 - 0.8 (Typically High) | 0.2 - 0.6 (Variable) |
| DMSO Tolerance | ≤0.5% | ≤0.1-0.25% (Often Lower) |
| Data Readout Compatibility | Luminescence, Fluorescence, Absorbance | Luminescence, 3D Fluorescence Imaging, Confocal |
Table 2: Typical Output from a 2D Dose-Response Screen (Example: Kinase Inhibitor)
| Compound | Target | IC₅₀ (nM) | Hill Slope | R² | Max Inhibition (%) |
|---|---|---|---|---|---|
| Inhibitor A | Kinase X | 10.2 ± 1.5 | -1.1 | 0.99 | 98.5 |
| Inhibitor B | Kinase X | 245.0 ± 30.1 | -0.9 | 0.97 | 95.2 |
| Control (Staurosporine) | PKC | 7.5 ± 0.8 | -1.2 | 0.99 | 99.0 |
The Scientist's Toolkit: Essential Research Reagent Solutions
Table 3: Key Reagents and Materials for 2D Screening
| Item | Function & Role in 2D Screening | Example Product |
|---|---|---|
| Tissue-Culture Treated Microplates | Provides a hydrophilic, charged surface for cell attachment and monolayer formation. | Corning Costar 96-well, flat clear bottom |
| Phenol-Red Free Medium | Eliminates background absorbance/fluorescence interference in colorimetric/fluorometric assays. | Gibco DMEM, phenol red-free |
| DMSO (Cell Culture Grade) | Universal solvent for small molecule compound libraries; requires precise control of final concentration. | Sigma-Aldrich, Hybri-Max |
| Cell Viability Assay Reagent | Quantifies ATP content as a proxy for viable cell number (luminescent) or metabolic activity (fluorometric). | Promega CellTiter-Glo |
| Automation-Compatible Tip-Based Dispenser | For rapid, consistent delivery of cells and reagents in HTS formats. | Thermo Fisher Multidrop Combi |
| Acoustic Liquid Handler | Enables contactless, nanoliter-scale transfer of compounds from source to assay plates, minimizing waste. | Beckman Coulter Echo 655 |
| HTS Plate Reader | Detects luminescent, fluorescent, or absorbance signals from multiwell plates rapidly. | PerkinElmer EnVision |
| Data Analysis Software | Processes raw plate data, normalizes signals, calculates dose-response curves and IC₅₀ values. | Genedata Screener, Dotmatics |
The shift from traditional 2D monolayers to sophisticated 3D culture models represents a paradigm shift in preclinical drug screening. While 2D cultures offer simplicity and cost-effectiveness, they fail to recapitulate the complex cell-cell and cell-matrix interactions, nutrient gradients, and physiological stiffness of in vivo tissues. This often leads to poor predictive power for drug efficacy and toxicity, contributing to high failure rates in clinical trials. The following techniques are foundational for establishing physiologically relevant 3D models that bridge this gap, enabling more accurate screening of drug candidates.
Detailed Technical Methodologies
Liquid Overlay (Forced-Floating) Technique
This non-adhesive technique forces cell aggregation by plating cells onto a substrate that prevents attachment.
- Protocol: Coat the wells of a low-attachment U- or V-bottom plate (e.g., Corning Costar Spheroid Microplates) with a 1-2% agarose or poly-HEMA solution to create a non-adhesive surface. After solidification, seed a single-cell suspension at optimized densities (e.g., 1,000-10,000 cells/well in 100-200 µL of complete medium). Centrifuge the plate at low speed (100-300 x g for 1-3 minutes) to aggregate cells at the well bottom. Culture at 37°C, 5% CO2, with media changes every 2-3 days by carefully aspirating half the medium.
- Applications: Ideal for generating uniform, reproducible multicellular tumor spheroids (MCTS) for high-throughput compound screening.
Hanging Drop Method
Gravity-driven self-assembly of spheroids within a suspended droplet of medium.
- Protocol: Prepare a high-density single-cell suspension (e.g., 5x10^4 – 2x10^5 cells/mL). Using a multi-channel pipette, dispense 15-30 µL droplets of the cell suspension onto the inner lid of a standard tissue culture dish. Invert the lid carefully and place it over a bottom chamber filled with PBS or medium to maintain humidity. Cells aggregate at the liquid-air interface within 24-48 hours. For long-term culture or drug treatment, spheroids can be transferred after formation to an ultra-low attachment plate.
- Applications: Excellent for studying developmental biology, generating embryoid bodies, and creating spheroids from stem cells or primary tissues with controlled initial cell numbers.
Bioreactor Systems (e.g., Spinner Flasks, Rotating Wall Vessels)
Systems that provide dynamic fluid flow to enhance nutrient/waste exchange for large or dense 3D constructs.
- Spinner Flask Protocol: Inoculate a sterile, siliconized spinner flask containing magnetic stir bar with a single-cell suspension (e.g., 1-5 x 10^5 cells/mL). Place on a magnetic stir plate inside an incubator. Maintain a low, constant agitation speed (50-80 rpm) to keep cells/aggregates in suspension without inducing shear stress. Monitor pH and oxygen periodically and perform medium exchanges as needed.
- Applications: Scaling up spheroid production, engineering large tissue constructs, and culturing cells that require high oxygenation (e.g., hepatocytes).
Scaffold-Based Techniques
Using natural or synthetic porous matrices to provide structural support and biochemical cues for 3D growth.
- Protocol (Hydrogel Embedding): Mix cells with a hydrogel precursor solution (e.g., Matrigel, collagen I, alginate) on ice. Plate the cell-hydrogel mixture into a pre-warmed culture vessel (e.g., 24-well plate, 50-100 µL/well). Incubate at 37°C for 15-30 minutes to induce gelation. Gently overlay with complete culture medium. For drug treatment, compounds are added to the overlying medium or, for some hydrogels, can be mixed into the gel precursor.
- Applications: Modeling the tumor microenvironment, studying stem cell differentiation in a niche-like setting, and engineering tissues for regenerative medicine.
Comparative Analysis of 3D Model Techniques
Table 1: Quantitative Comparison of Core 3D Culture Techniques
| Technique | Typical Spheroid/Construct Size | Throughput | Complexity/Cost | Key Advantages | Primary Limitations |
|---|---|---|---|---|---|
| Liquid Overlay | 200 - 500 µm | High | Low | Simple, reproducible, HTS-compatible | Limited size control, no ECM component |
| Hanging Drop | 100 - 400 µm | Medium | Low | Precise size control, minimal reagent use | Low-throughput, manual transfer often needed |
| Bioreactors | 500 µm - 2 mm+ | Low | High | Superior mass transfer, scalable | High cost, complex operation, shear stress risk |
| Scaffold-Based | Variable (µm - cm) | Medium-High | Medium-High | Includes ECM, supports complex morphology | Batch variability (natural scaffolds), decellularization needed for analysis |
Table 2: Impact on Drug Screening Parameters in 2D vs. 3D Models
| Parameter | 2D Monolayer Culture | 3D Model (e.g., Spheroid) | Implication for Drug Screening |
|---|---|---|---|
| Proliferation Gradient | Uniform, high proliferation | Outer layer: proliferative. Inner core: quiescent/necrotic. | Better models solid tumors; chemotherapeutics less effective in core. |
| Drug Penetration | Immediate, uniform exposure | Limited diffusion; creates gradients. | Identifies compounds with penetration issues; mimics in vivo barrier. |
| Gene Expression | Often de-differentiated, aberrant | More in vivo-like differentiation and signaling. | Better prediction of mechanism-based efficacy/toxicity. |
| IC50 Values | Typically lower (more sensitive) | Often 10-1000x higher (more resistant). | 3D models better recapitulate clinical drug resistance. |
Essential Signaling Pathways in 3D Microenvironments
Pathways Driving Drug Response in 3D Models
Workflow for 3D Model Drug Screening Assay
The Scientist's Toolkit: Key Reagent Solutions
Table 3: Essential Materials for Establishing 3D Cultures
| Item/Reagent | Primary Function | Example Product/Brand |
|---|---|---|
| Ultra-Low Attachment (ULA) Plates | Provides a chemically inert, non-adhesive surface to force cell aggregation into spheroids. | Corning Spheroid Microplates, Nunclon Sphera |
| Basement Membrane Matrix | Natural hydrogel scaffold providing a rich milieu of ECM proteins and growth factors. | Corning Matrigel, Cultrex BME |
| Type I Collagen | The most abundant in vivo ECM protein; forms a tunable hydrogel for 3D embedding. | Rat tail collagen I, Bovine collagen I |
| Alginate | Synthetic, inert polysaccharide hydrogel; cross-linking allows precise stiffness control. | Pronova UP LVG, Sigma Aldrich |
| Synthetic Hydrogel Kits | Defined, xeno-free matrices (e.g., PEG-based) with customizable adhesive motifs. | BioLamina Human Recombinant Laminin, PEGylated peptide hydrogels |
| Spinner Flasks / Bioreactors | Vessels for dynamic suspension culture, improving nutrient/waste exchange. | Corning disposable spinner flasks, Synthecon RCCS |
| 3D Viability/Cytotoxicity Assays | Optimized assays that penetrate spheroids to measure live/dead cells. | CellTiter-Glo 3D, LIVE/DEAD Viability/Cytotoxicity kit |
| Automated Imaging System | For high-content analysis of spheroid size, morphology, and fluorescence. | PerkinElmer Operetta CLS, Sartorius Incucyte S3 Spheroid Module |
Within the ongoing evaluation of 2D vs. 3D cell culture models for drug screening, a critical paradigm shift is occurring. The field is moving beyond simple viability readouts (e.g., ATP content, resazurin reduction) toward multifaceted functional endpoints that capture complex biology. This transition is particularly essential as 3D models (spheroids, organoids, bioprinted tissues) more accurately recapitulate tumor microenvironments, tissue stiffness, and cell-cell interactions, rendering crude viability metrics insufficient. Adapting assays to measure function—such as metabolic flux, apoptosis/autophagy dynamics, migration/invasion, and differentiation—is key to unlocking the predictive power of advanced in vitro systems.
The Limitations of Viability in Complex Models
In 2D monolayers, viability assays often correlate directly with drug efficacy. However, in 3D models, diffusion gradients, heterogeneous proliferation zones (proliferative outer layer, quiescent middle, necrotic core), and altered cell states mean a "viable" cell is not necessarily functional. A drug may significantly disrupt tissue architecture or stemness without causing massive cell death initially. Therefore, functional endpoints provide a deeper, more translational layer of data.
Core Functional Endpoints and Their Quantification
Metabolic Phenotyping
Beyond bulk ATP, probing metabolic pathways (glycolysis vs. oxidative phosphorylation) indicates drug mechanism and adaptive resistance.
Protocol: Seahorse XF Analyzer for 3D Spheroids
- Spheroid Formation: Seed cells in ultra-low attachment U-bottom plates (e.g., Corning #4515). Centrifuge at 300 x g for 3 min to promote aggregation. Culture for 72-96 hours.
- Assay Day: Transfer single spheroids to each well of a Seahorse XFp/XFe96 spheroid microplate in assay medium (base medium + 10 mM glucose, 1 mM pyruvate, 2 mM glutamine, pH 7.4).
- Injection Ports:
- Port A: Oligomycin (1.5 µM final) – inhibits ATP synthase, reveals ATP-linked respiration.
- Port B: FCCP (1.5 µM final) – uncoupler, reveals maximal respiratory capacity.
- Port C: Rotenone/Antimycin A (0.5 µM each) – inhibit Complex I & III, reveal non-mitochondrial respiration.
- Port D: 2-DG (50 mM final) – inhibits glycolysis.
- Run: Measure Oxygen Consumption Rate (OCR) and Extracellular Acidification Rate (ECAR) in real-time. Normalize data to spheroid protein content (via Bradford assay).
Apoptosis and Caspase Activity in 3D
Quantifying apoptosis in 3D models requires reagents that penetrate the core.
Protocol: 3D Live-Cell Caspase-3/7 Assay
- Treat spheroids/organoids with compounds in 96-well plates.
- Prepare a working solution of a cell-permeable, fluorogenic caspase-3/7 substrate (e.g., CellEvent Caspase-3/7 Green, Thermo Fisher C10423) at 2-4 µM in culture medium.
- Replace medium with substrate-containing medium. Incubate for 30-60 minutes at 37°C.
- Image using a confocal or high-content imaging system with z-stacking. Use a nuclear dye (Hoechst 33342) for counterstain.
- Quantify fluorescence intensity per spheroid volume using image analysis software (e.g., ImageJ, Harmony).
Invasion and Migration
Functional readout of metastatic potential and drug effects on motility.
Protocol: Spheroid Invasion Assay (Matrix-Embedded)
- Form spheroids (~500 cells) as above.
- Prepare a solution of reduced-growth factor basement membrane extract (BME, e.g., Cultrex) on ice.
- Mix single spheroids with BME and pipette 50 µL drops into a pre-warmed 24-well plate. Incubate at 37°C for 30 min to polymerize.
- Overlay with complete culture medium containing treatments.
- Image at 0h, 24h, 48h, 72h. Measure the area of the invasive rim relative to the spheroid core.
Differentiation and Cell Fate
Critical for screening in stem cell-derived organoids or assessing drug-induced differentiation in cancer.
Protocol: Flow Cytometry for Surface Markers from 3D Models
- After treatment, dissociate organoids/spheroids using gentle enzymatic digestion (e.g., TrypLE for 10-15 min at 37°C) to a single-cell suspension.
- Filter through a 40 µm cell strainer.
- Stain cells with fluorescent antibody conjugates for target markers (e.g., CD44, CD133, differentiation antigens) for 30 min on ice.
- Wash, resuspend in buffer with viability dye (e.g., DAPI).
- Analyze on a flow cytometer. Use isotype controls for gating.
Quantitative Data Comparison: 2D vs. 3D Functional Responses
Table 1: Comparison of Functional Endpoint Sensitivity in 2D vs. 3D Models
| Functional Endpoint | Typical Assay | Key Metric | 2D Model (IC50/Max Effect) | 3D Model (IC50/Max Effect) | Notes on Discrepancy |
|---|---|---|---|---|---|
| Proliferation | EdU Incorporation | % EdU+ Cells | 1.0 µM (Drug A) | 5.2 µM (Drug A) | Reduced proliferation inhibition in 3D due to quiescent core. |
| Apoptosis Induction | Cleaved Caspase-3 IHC | % Apoptotic Area | 85% max effect | 45% max effect | Heterogeneous response; outer layer more sensitive. |
| Metabolic Shift | Seahorse (OCR/ECAR) | Glycolytic Capacity | Complete suppression | Partial suppression (~60%) | 3D models exhibit metabolic plasticity & hypoxia-driven glycolysis. |
| Invasion | Matrix-Embedded Area | Invasive Area (mm²) | Not applicable | Control: 0.25, Treated: 0.08 | 2D scratch assay does not recapitulate 3D invasive program. |
| Differentiation | Flow Cytometry (CD44-/CD24+) | % Differentiated | 15% increase | 65% increase | 3D cell-cell contacts enhance differentiation signaling. |
Table 2: Key Research Reagent Solutions for Functional Assay Adaptation
| Reagent/Category | Example Product | Primary Function in Adaptation |
|---|---|---|
| Viable 3D Matrix | Cultrex BME, Matrigel | Provides physiological context for invasion, polarity, and signaling. |
| Live-Cell Fluorescent Probes | CellEvent Caspase-3/7, MitoTracker Deep Red | Enable real-time tracking of functional changes (apoptosis, mitochondrial mass) in intact structures. |
| Metabolic Assay Kits | Seahorse XFp Spheroid Kits | Tailored cartridge plates and protocols for analyzing metabolism in 3D aggregates. |
| Gentle Dissociation Kits | STEMCELL Technologies Gentle Cell Dissociation Reagent | Preserves cell surface antigens for downstream flow cytometry from 3D models. |
| High-Content Imaging Analysis Software | PerkinElmer Harmony, CellProfiler | Quantifies complex 3D image data (z-stacks) for area, intensity, and object count. |
| Low-Attachment Plates | Corning Spheroid Microplates | Promotes consistent, reproducible spheroid formation via U-bottom or agarose-coated wells. |
Critical Signaling Pathways in 3D Drug Response
Diagram Title: Key Signaling Pathways Driving Functional Drug Responses in 3D Models
Experimental Workflow for Adapted Functional Screening
Diagram Title: Integrated Workflow for Multiplexed Functional Screening in 3D
The critical adaptation from viability to functional endpoints is not merely an incremental improvement but a necessary evolution to match the complexity of modern 3D cell culture models. This shift demands rigorous protocol optimization for reagent penetration, imaging depth, and data interpretation nuanced by spatial heterogeneity. By implementing the assays and frameworks outlined, researchers can generate more predictive, mechanistically rich data, ultimately strengthening the role of in vitro models in the drug development pipeline and providing clearer insights in the 2D vs. 3D model debate.
High-Content Imaging and Analysis in 3D Cultures
The paradigm shift from traditional 2D monolayers to three-dimensional (3D) cell cultures represents a critical advancement in preclinical drug screening. While 2D models offer simplicity and high-throughput capability, they fail to recapitulate the complex cell-cell and cell-matrix interactions, gradient formation, and heterogeneous phenotypes found in vivo. This often leads to poor predictive power for drug efficacy and toxicity. 3D cultures, including spheroids, organoids, and biomaterial-based scaffolds, bridge this gap by modeling tissue-like architecture and physiology. Consequently, high-content imaging and analysis (HCA) in 3D is not merely an extension of 2D techniques but a fundamental re-engineering of imaging, processing, and analysis workflows to extract biologically relevant, quantitative data from these complex models for more predictive drug screening.
Core Imaging Modalities for 3D Cultures
Successful HCA in 3D requires balancing spatial resolution, imaging depth, speed, and phototoxicity.
| Imaging Modality | Principle | Optimal Depth | Key Advantage for 3D | Primary Limitation |
|---|---|---|---|---|
| Confocal Microscopy | Point illumination with spatial pinhole. | ~100-200 µm | Optical sectioning reduces out-of-focus light. | Photobleaching; slower scanning. |
| Spinning Disk Confocal | Multiple pinholes scanned in parallel. | ~100-200 µm | High-speed optical sectioning for live imaging. | Lower light throughput per point. |
| Light-Sheet Fluorescence (LSFM) | Orthogonal illumination of a single plane. | Several mm | Extreme speed & low phototoxicity for large volumes. | Sample mounting & compatibility. |
| Two-Photon Microscopy | Near-IR pulsed laser for non-linear excitation. | 500-1000 µm | Deep tissue penetration & reduced photodamage. | High cost; complex setup. |
| High-Content Widefield | Epifluorescence with computational deconvolution. | ~50 µm (post-processing) | High-throughput screening of many samples. | Scatter & blur require deconvolution. |
Quantitative Comparison of 2D vs. 3D Drug Screening Outcomes
The following table summarizes key quantitative differences observed in drug response between 2D and 3D models, underscoring the need for 3D HCA.
| Parameter | Typical 2D Culture Result | Typical 3D Culture Result | Implication for Drug Screening |
|---|---|---|---|
| IC50 for Chemotherapeutics | 10-1000 nM | 10-100 fold higher | 3D models show increased resistance, mimicking in vivo tumor response. |
| Proliferation Gradient | Uniform, high proliferation. | Outer layer: high proliferation. Inner core: quiescent/necrotic. | Drugs must penetrate and target multiple proliferative states. |
| Apoptosis Post-Treatment | Homogeneous, rapid onset. | Heterogeneous, initiated in outer layers. | Efficacy assessment requires spatial analysis. |
| Oxygen Gradient | Nearly uniform (~20% O₂). | Hypoxic core (< 2% O₂) in spheroids >500 µm. | Activates hypoxia pathways, altering drug sensitivity. |
| Gene Expression Profiles | Often de-differentiated. | Closer to native tissue expression. | More clinically relevant target expression for screening. |
Experimental Protocol: High-Content Analysis of Drug Response in Tumor Spheroids
Aim: To quantify spatially resolved apoptosis and proliferation in cancer spheroids treated with a candidate oncology drug.
Materials & Reagents:
- Cell Line: U87-MG glioblastoma cells.
- 3D Culture Method: Ultra-low attachment (ULA) 96-well round-bottom plates.
- Drug: Staurosporine (serial dilution from 1 µM to 10 nM).
- Staining Reagents:
- Hoechst 33342: Nuclear stain (5 µg/mL).
- Caspase-3/7 Green Dye: Apoptosis indicator (4 µM).
- EdU (5-ethynyl-2’-deoxyuridine): Proliferation pulse-label (10 µM for 4h), detected via Click-iT reaction with Alexa Fluor 647.
- Fixative: 4% Paraformaldehyde (PFA).
- Permeabilization: 0.5% Triton X-100.
- Imaging Platform: Spinning disk confocal microscope with environmental chamber, 20x water immersion objective (NA 0.95).
Procedure:
- Spheroid Formation: Seed 1000 cells/well in ULA plate. Centrifuge at 300 x g for 3 min to aggregate. Culture for 72h to form compact spheroids (~500 µm diameter).
- Drug Treatment: Aspirate medium, add 150 µL of fresh medium containing drug or DMSO vehicle (n=6 per condition). Incubate for 48h.
- Pulse-Labeling: Add EdU directly to wells for the final 4h of treatment.
- Fixation & Staining: Aspirate medium, wash with PBS, fix with 4% PFA for 45 min at RT. Permeabilize with 0.5% Triton X-100 for 1h. Perform Click-iT reaction per manufacturer's protocol.
- Counterstaining: Incubate with Caspase-3/7 Green Dye and Hoechst in PBS for 1h at RT. Wash 3x.
- Imaging: Acquire z-stacks through entire spheroid with 10 µm step size. Use 405 nm (Hoechst), 488 nm (Caspase), and 640 nm (EdU) lasers.
- Analysis: Use 3D analysis software (e.g., IMARIS, CellProfiler 3D).
- Segmentation: Create 3D surfaces from Hoechst channel for individual nuclei.
- Quantification: Measure mean fluorescence intensity of Caspase and EdU signals within each nucleus.
- Spatial Zoning: Define spherical shells (outer 0-50 µm, middle 50-100 µm, inner >100 µm from periphery) based on distance from spheroid surface. Calculate zonal averages.
The Scientist's Toolkit: Key Reagent Solutions for 3D HCA
| Item | Function & Rationale | Example Product/Brand |
|---|---|---|
| Ultra-Low Attachment (ULA) Plates | Promotes scaffold-free spheroid formation via inhibited cell adhesion. | Corning Spheroid Microplates |
| Basement Membrane Extract (BME) | Provides a biologically relevant 3D extracellular matrix for organoid growth. | Cultrex Reduced Growth Factor BME |
| Live-Cell Compatible Nuclear Dyes | Enable long-term tracking of nuclei with minimal phototoxicity. | SiR-DNA, Hoechst 33342 (low concentration) |
| Viability/Apoptosis 3D Reporters | Fluorogenic substrates activated by cellular processes (e.g., caspases, proteases). | CellEvent Caspase-3/7, PrestoBlue |
| Optical Clearing Reagents | Reduce light scattering in thick samples for deeper imaging. | ScaleS, CUBIC, Visikol HISTO-M |
| 3D Analysis Software | Capable of segmenting and quantifying objects in z-stacks and rendering 3D volumes. | IMARIS, Arivis Vision4D, FIJI/ImageJ with 3D plugins |
Workflow and Pathway Diagrams
Title: 3D HCA Experimental Workflow
Title: Drug Resistance Mechanisms in 3D Models
The transition from traditional two-dimensional (2D) monolayers to three-dimensional (3D) cell culture models represents a pivotal shift in preclinical drug screening. While 2D cultures offer simplicity and cost-effectiveness, they critically lack the physiological cell-cell and cell-matrix interactions, gradient dynamics, and heterogeneous cellular organization found in vivo. This whitepaper examines the application of advanced 3D models—including spheroids, organoids, and organ-on-a-chip systems—within three critical therapeutic areas: oncology, neurodegeneration, and toxicology screening. The core thesis posits that 3D models, by better recapitulating the native tissue microenvironment and disease pathology, generate more predictive and translationally relevant data for drug discovery, despite increased technical and analytical complexity.
Oncology: Modeling Tumor Microenvironment & Drug Penetration
In oncology, 3D tumor spheroids and patient-derived organoids (PDOs) mimic key features of solid tumors, such as hypoxia, nutrient gradients, proliferative zonation, and stromal interactions, which are absent in 2D cultures.
Key Advantages of 3D Models in Oncology:
- Gradient Formation: Replicates the diffusion-driven core hypoxia and acidosis, influencing drug efficacy and resistance mechanisms.
- Stromal Integration: Allows co-culture with cancer-associated fibroblasts (CAFs), immune cells, and endothelial cells.
- Drug Penetration Assessment: Enables quantitative analysis of a compound's ability to penetrate tissue, a major failure point in chemotherapy.
Quantitative Data: 2D vs. 3D Oncology Screening
Table 1: Comparative Analysis of Drug Screening Outputs in 2D vs. 3D Oncology Models
| Parameter | 2D Monolayer Model | 3D Spheroid/Organoid Model | Clinical Correlation |
|---|---|---|---|
| IC50 Value (Example: Doxorubicin) | Typically 10-100 nM | 1-10 µM (100-1000x higher) | 3D values align closer to in vivo tumor response. |
| Proliferation Gradient | Uniform, high proliferation | Outer proliferative zone, inner quiescent/core necrotic zone | Mimics solid tumor histology. |
| Hypoxic Fraction | Negligible | Up to 20-40% of spheroid volume (core) | Drives expression of HIF-1α and chemoresistance. |
| Drug Penetration Metrics | Not applicable (direct exposure) | Measurable penetration depth (e.g., 50-100 µm for many chemotherapeutics) | Critical for efficacy in avascular tumor regions. |
| Stromal Impact on IC50 | Not measurable in pure epithelial cultures | Co-culture with CAFs can increase IC50 by 3-10 fold | Models tumor microenvironment-mediated resistance. |
Experimental Protocol: High-Throughput Spheroid Formation & Viability Assay
Method: Ultra-Low Attachment (ULA) Plate-based Spheroid Generation and ATP-based Viability. Procedure:
- Cell Seeding: Harvest tumor cells (e.g., HT-29 colon carcinoma). Resuspend in complete medium. Seed 5,000-10,000 cells per well in a 96-well ULA round-bottom plate in a 100 µL volume.
- Spheroid Formation: Centrifuge plate at 300 x g for 3 minutes to aggregate cells at well bottom. Incubate at 37°C, 5% CO2 for 72-96 hours to form compact spheroids.
- Drug Treatment: Prepare 2X drug concentrations in complete medium. Carefully add 100 µL of each drug solution to wells containing 100 µL of medium with spheroid, creating a 1X final concentration. Include vehicle controls. Incubate for 120 hours.
- Viability Assay (CellTiter-Glo 3D): Equilibrate assay reagent and plate to room temperature for 30 minutes. Add 100 µL of CellTiter-Glo 3D reagent directly to each well.
- Lysis & Measurement: Orbital shake plate for 5 minutes to induce lysis. Incubate for 25 minutes at RT to stabilize luminescent signal. Record luminescence using a plate reader.
- Data Analysis: Normalize luminescence of treated spheroids to vehicle control (100% viability). Calculate % viability and generate dose-response curves to determine IC50.
Diagram: Tumor Spheroid Microenvironment & Drug Response
The Scientist's Toolkit: Oncology 3D Screening
| Research Reagent / Material | Function in 3D Oncology Models |
|---|---|
| Ultra-Low Attachment (ULA) Plates | Surface coating prevents cell adhesion, forcing cells to aggregate and form spheroids. |
| Basement Membrane Extract (BME/Matrigel) | Provides a 3D extracellular matrix scaffold for organoid growth, mimicking the tumor stroma. |
| CellTiter-Glo 3D Assay | Luminescent ATP assay optimized to lyse 3D structures and quantify viable cell mass. |
| Hypoxia Probe (e.g., Pimonidazole) | Binds to proteins in hypoxic cells (<1.3% O2), allowing immunohistochemical detection of spheroid core hypoxia. |
| Patient-Derived Organoid (PDO) Media | Specialized, often serum-free, media formulations containing niche factors to maintain tumor stemness and genetics. |
Neurodegeneration: Recapitulating Complex Neural Circuits
2D neuronal cultures fail to model the intricate spatial architecture, synaptic connectivity, and non-cell-autonomous pathology of diseases like Alzheimer's (AD) and Parkinson's (PD). 3D brain organoids derived from human induced pluripotent stem cells (hiPSCs) offer a transformative approach.
Key Advantages of 3D Models in Neurodegeneration:
- Cellular Diversity: Self-organization into regions containing neurons, astrocytes, and oligodendrocytes.
- Pathological Protein Aggregation: Facilitates the spontaneous formation of amyloid-β plaques and neurofibrillary tau tangles (in AD models) over extended culture.
- Network Activity: Supports the development of synchronous, oscillatory neural network activity measurable by MEA.
Quantitative Data: 2D vs. 3D Neurodegeneration Models
Table 2: Comparison of Neurodegenerative Disease Modeling in 2D vs. 3D Systems
| Parameter | 2D Neuronal Culture | 3D Brain Organoid (Cerebral) | Physiological Relevance |
|---|---|---|---|
| Culture Duration for Pathology | Weeks (often only precursors) | 2-6+ months | Allows age-related pathology development. |
| Amyloid-β Plaque Formation | Rare, diffuse aggregates | Discrete, dense, Thioflavin-S+ plaques after 60+ days | Recapitulates core AD histopathology. |
| Neuronal Layer Organization | Monolayer, mixed | Rudimentary cortical layering (e.g., TBR1+ deep layers) | Models basic cytoarchitecture. |
| Spontaneous Network Activity | Bursting activity on MEA | Complex, synchronized oscillatory bursts | Closer to in vivo brain network dynamics. |
| Neuroinflammation Response | Limited (microglia often absent) | Microglia integration & activation near plaques | Captures glial contribution to disease. |
Experimental Protocol: hiPSC-derived Brain Organoid Generation & Analysis
Method: Guided Cerebral Organoid Differentiation via Dual SMAD Inhibition. Procedure:
- hiPSC Aggregation: Dissociate hiPSCs to single cells. Seed 9,000 cells per well in a 96-well ULA V-bottom plate in 150 µL of neural induction medium with 10 µM Y-27632 (ROCKi).
- Neural Induction (Days 1-5): Centrifuge to aggregate. Culture in neural induction medium with 10 µM SB431542 (TGF-β inhibitor) and 100 nM LDN-193189 (BMP inhibitor) for dual SMAD inhibition. Change medium daily.
- Neuroectoderm Formation (Days 6-11): Transfer aggregates to 24-well low-attachment plates in neural induction medium without SB/ LDN. Change medium every other day. Form neuroepithelial buds.
- Matrigel Embedding & Expansion (Day 11): Embed individual organoids in 20 µL Matrigel droplets. Plate in 6cm dishes in organoid differentiation medium. After 5 days, transfer to orbital shaker in 125 mL flasks.
- Maturation & Analysis (Day 30+): Maintain organoids on shaker with bi-weekly medium changes for up to 6 months. For analysis, fix for immunohistochemistry (IHC) or dissociate for single-cell RNA sequencing (scRNA-seq).
- Plaque Quantification: Perform IHC for Amyloid-β (6E10) on organoid sections. Image with confocal microscopy. Use image analysis software (e.g., Fiji) to threshold and count plaque-like structures per mm².
Diagram: Brain Organoid Development & Disease Pathway
The Scientist's Toolkit: Neurodegeneration 3D Models
| Research Reagent / Material | Function in 3D Neuro Models |
|---|---|
| Dual SMAD Inhibitors (SB, LDN) | Drives hiPSCs uniformly toward neural lineage by inhibiting alternative TGF-β/BMP pathways. |
| Orbital Shaker / Bioreactor | Enhances nutrient/waste exchange in larger organoids, preventing central necrosis. |
| Matrigel / Synthetic ECM (e.g., PeptiGel) | Provides a 3D scaffold for complex tissue morphogenesis and structural support. |
| Multi-Electrode Array (MEA) System | Records extracellular, spontaneous electrophysiological activity across neural networks. |
| Microglia Progenitor Co-culture Kits | Enables incorporation of isogenic microglia to model neuroinflammation. |
Toxicology Screening: Predicting Human Organ-Specific Toxicity
Traditional 2D hepatic or cardiac cytotoxicity assays are poor predictors of human-relevant organ toxicity (hepatotoxicity, cardiotoxicity). 3D models, particularly organ-on-a-chip systems with fluid flow, improve metabolic function and allow for the assessment of chronic and mechanical stressors.
Key Advantages of 3D Models in Toxicology:
- Enhanced Metabolic Function: 3D hepatocyte spheroids maintain cytochrome P450 (CYP) enzyme activity for weeks, unlike 2D cultures where it declines in days.
- Multicellular Integration: Liver models can incorporate Kupffer cells (macrophages) to assess inflammatory drug-induced liver injury (DILI).
- Mechanical Cues: Heart-on-a-chip models with cyclic stretching better mimic cardiomyocyte contractility and allow measurement of altered beating under drug load.
Quantitative Data: 2D vs. 3D Toxicology Endpoints
Table 3: Predictive Power of Toxicity Assays in 2D vs. 3D Models
| Toxicity Endpoint | 2D Model Readout | 3D Model Readout | Predictive Value for Human |
|---|---|---|---|
| Hepatotoxicity (CYP Inhibition) | Acute cytotoxicity (LDH release) | Sustained albumin/Urea production + CYP3A4 activity decline over 14 days | 3D chronic models better predict idiosyncratic DILI. |
| Cardiotoxicity (hERG blockade) | hERG current in transfected cells (patch clamp) | Prolonged field potential duration in 3D cardiac spheroids (MEA) | Functional 3D tissue readout adds physiological context. |
| Nephrotoxicity | Proximal tubule cell death | Barrier function (TEER), albumin reabsorption, biomarker release (KIM-1) | Models kidney tubular physiology and injury response. |
| Secretory Function (Liver) | Low and declining | High, stable albumin secretion (>5 µg/day/10^6 cells) for >28 days | Indicates maintained differentiated phenotype. |
Experimental Protocol: 3D Liver Spheroid Chronic Toxicity Assay
Method: HµREL or HepaRG Spheroid Culture for Repeated-Dose Toxicity. Procedure:
- Spheroid Formation: Seed primary human hepatocytes or HepaRG cells in ULA 96-well plates at 1,500 cells/well in hepatocyte maintenance medium. Spin (300 x g, 3 min) and culture for 7 days to form stable spheroids.
- Baseline Assessment (Day 7): Visually inspect spheroid roundness. Transfer 10% of spheroids to a separate plate for baseline albumin (Human Albumin ELISA) and urea (Urea Assay Kit) measurement.
- Repeated-Dose Treatment: On day 7, treat spheroids with test compound or vehicle control. Refresh medium and compound every 2-3 days for up to 14-28 days.
- Functional Endpoint Measurement (Weekly): At each medium change, collect spent medium and store at -80°C for later batch analysis of albumin and urea. Quantify using ELISA and colorimetric assays.
- Viability Endpoint (Terminal): At assay end (e.g., day 14), perform ATP-based viability assay (CellTiter-Glo 3D) on all spheroids.
- Data Analysis: Normalize functional readouts (Albumin, Urea) and viability to vehicle control. A toxic compound will show a time-dependent decline in both function and viability, distinguishing it from a transient, non-toxic inhibitor.
Diagram: Organ-on-a-Chip for Advanced Toxicity Screening
The Scientist's Toolkit: Advanced Toxicology Screening
| Research Reagent / Material | Function in 3D Toxicology Models |
|---|---|
| Primary Human Hepatocytes (Cryopreserved) | Gold-standard cell source with full metabolic competency for liver models. |
| HepaRG Progenitor Cell Line | Differentiates into hepatocyte-like and biliary cells, forming highly functional 3D structures. |
| Transwell or Organ-Chip Membranes | Porous supports for co-culture and establishment of tissue-tissue interfaces (e.g., gut-liver). |
| Biomarker ELISA Kits (ALT, Albumin, KIM-1) | Quantify organ-specific functional and injury markers in spent culture medium. |
| Real-Time Cellular Analysis (RTCA) / xCELLigence | Label-free, impedance-based monitoring of cell health and barrier function in real-time. |
The application showcases in oncology, neurodegeneration, and toxicology screening unequivocally demonstrate that 3D cell culture models address fundamental limitations of 2D systems. By incorporating spatial architecture, physiological gradients, and multicellular interactions, 3D models generate data with superior clinical predictive validity. While challenges in standardization, scalability, and cost remain, the integration of 3D models into the drug discovery pipeline—particularly for lead optimization and safety assessment—is essential to reduce late-stage attrition and deliver more effective, safer therapeutics to patients. The future lies in the convergence of 3D models with high-content imaging, omics technologies, and AI-driven analysis to fully decode their complex biology.
Overcoming Challenges: Pitfalls, Reproducibility, and Cost-Efficiency
The choice between two-dimensional (2D) and three-dimensional (3D) cell culture models is pivotal in modern drug screening. While 2D monolayers on plastic or glass have been the historical standard for their simplicity and scalability, they possess inherent limitations that can compromise translational research. This guide addresses three critical, interconnected pitfalls of 2D culture—edge effects, over-confluence, and loss of phenotype—framed within the broader thesis that 3D models often provide more physiologically relevant data for preclinical drug discovery. Understanding these pitfalls is essential for accurately interpreting screening results and justifying the transition to more complex 3D systems.
In-Depth Analysis of Core Pitfalls
Edge Effects
Edge effects refer to the observable phenotypic and behavioral differences between cells at the periphery of a 2D monolayer and those in the central region. This spatial heterogeneity introduces significant bias in assays.
Mechanism & Impact: Cells at the edge experience an unrestricted surface area for migration and asymmetrical access to nutrients and gas exchange from the culture medium. This often leads to faster proliferation rates, altered morphology (e.g., elongated, fibroblastic), and differential gene expression compared to centrally located, contact-inhibited cells. In drug screening, this results in non-uniform response to compounds, increasing assay variability and reducing statistical power.
Quantitative Data Summary:
Table 1: Measurable Impact of Edge Effects in 2D Culture
| Parameter | Edge Cells | Center Cells | Measurement Technique | Reported Fold-Change/ Difference |
|---|---|---|---|---|
| Proliferation Rate | Higher | Lower | BrdU/EdU incorporation | 1.5 - 2.5x increase |
| Apoptosis Rate | Lower | Higher | Caspase-3/7 activity | ~40% decrease |
| Migration Potential | Higher | Lower | Scratch/wound assay | 2-3x faster gap closure |
| Actin Organization | Stress fibers, aligned | Cortical, mesh-like | Phalloidin staining | Qualitative morphological shift |
| Drug IC50 (e.g., Doxorubicin) | Often Higher | Often Lower | Viability assay | Can vary by 10-50% |
Experimental Protocol for Quantifying Edge Effects:
- Culture & Labeling: Seed cells sparsely in a standard multi-well plate. At ~70% confluence, incubate with a fluorescent cytoplasmic dye (e.g., CellTracker Red) for 45 min.
- Image Acquisition: Using a high-content imaging system, acquire tiled images of entire wells. Define concentric annuli using image analysis software (e.g., ImageJ): "Edge Zone" (outer 500 μm) and "Center Zone."
- Analysis:
- Proliferation: Fix cells, stain nuclei with DAPI, and count nuclei density in each zone.
- Signaling: Immunofluorescence for phospho-proteins (e.g., p-ERK, p-FAK). Measure mean fluorescence intensity per cell in each zone.
- Drug Response: Treat with a dose range of a test compound for 48h. Perform a live/dead assay (e.g., Calcein-AM/ EthD-1). Calculate viability separately for edge and center populations.
Over-confluence
Over-confluence occurs when cells exceed optimal density, leading to contact inhibition, nutrient depletion, waste accumulation, and consequent stress responses.
Mechanism & Impact: Prolonged over-confluence triggers cell cycle arrest, autophagy, and senescence. It drastically alters cellular metabolism and signaling pathways, making cells refractory to treatments that target proliferating cells. In drug screens, this leads to false negatives for anti-proliferative agents and skewed data for any pathway sensitive to density-dependent signaling (e.g., Hippo, Wnt).
Quantitative Data Summary:
Table 2: Consequences of Over-confluence in 2D Culture
| Parameter | Optimal Confluence (60-80%) | Over-confluence (>100%) | Assay | Impact |
|---|---|---|---|---|
| Cell Cycle Distribution | Normal ~24h doubling | G0/G1 arrest (>80% of cells) | Flow cytometry (PI) | Proliferation halt |
| Metabolic Activity (MTT/WST) | Linear with cell number | Plateau/decline | MTT assay | Misleading viability readout |
| Nutrient (Glucose) Level | ~60% depleted in 24h | >90% depleted in 24h | Biochemistry analyzer | Metabolic stress |
| Senescence Markers (β-gal) | Low expression | High expression (≥70% cells) | SA-β-Gal staining | Induction of senescence |
| Response to EGFR Inhibitor | Sensitive (IC50 ~1μM) | Resistant (IC50 >10μM) | Cell viability assay | Loss of drug efficacy |
Experimental Protocol for Assessing Over-confluence Impact:
- Density Gradient Setup: Seed the same cell type in a 24-well plate at a range of densities (e.g., 10k, 25k, 50k, 100k, 200k cells/well). Culture for 72 hours to reach different confluence states.
- Microenvironment Monitoring: At 72h, collect conditioned medium from each well for analysis of glucose (via colorimetric assay) and lactate (as a waste product).
- Endpoint Analysis: For each density:
- Cell Cycle: Trypsinize, fix in 70% ethanol, stain with Propidium Iodide (PI)/RNase, analyze by flow cytometry.
- Signaling: Lyse cells for western blot analysis of Hippo pathway effectors (e.g., non-phosphorylated YAP/TAZ increase with density).
- Drug Screen: Add a panel of oncology drugs (e.g., 5-FU, Paclitaxel) for 48h. Perform ATP-based viability assay (CellTiter-Glo). Normalize data to untreated controls at the same seeding density.
Loss of Phenotype
Loss of phenotype is the gradual dedifferentiation of specialized cells (e.g., primary hepatocytes, neurons, cancer stem cells) when maintained in standard 2D monolayers, eroding tissue-specific functions.
Mechanism & Impact: The rigid, flat plastic substrate and homogeneous environment fail to replicate the native extracellular matrix (ECM) composition, stiffness, and topography. This disrupts integrin-mediated signaling, polarity, and cell-ECM interactions, leading to downregulation of tissue-specific genes and functions. For drug screening, this is catastrophic when metabolic activity (e.g., hepatocyte CYP450), polarized secretion, or complex signaling is the target.
Quantitative Data Summary:
Table 3: Phenotypic Drift in Common Cell Types in 2D Culture
| Cell Type | Key Native Function | Function in Early-Passage 2D | Function in Late-Passage 2D | Typical Timeframe for Loss |
|---|---|---|---|---|
| Primary Human Hepatocytes | Albumin synthesis, CYP450 metabolism | ~50-70% of in vivo | <10% of in vivo | 3-7 days |
| Articular Chondrocytes | Collagen II synthesis, SOX9 expression | Moderate expression | Shift to collagen I (fibrotic) | 2-3 passages |
| Cancer Stem Cells (CSCs) | Tumor initiation, drug resistance | Enriched in spheres | Marked reduction in CD44+/CD24- population | 1-2 passages on plastic |
| Mammary Epithelial Cells | Polarized acinar structures, casein production | Can form weak polarity | Loss of polarity, mesenchymal morphology | 5-7 passages |
Experimental Protocol for Monitoring Phenotype Loss:
- Longitudinal Culture: Plate primary or low-passage cells of interest. Designate replicate flasks for analysis at each passage (P1, P2, P3, etc.).
- Functional Assessment at Each Passage:
- Gene Expression: Extract RNA, perform RT-qPCR for 3-5 key differentiation markers (e.g., ALB for hepatocytes, SOX9 for chondrocytes) and 1-2 dedifferentiation markers (e.g., ACTB or VIM). Use ΔΔCq method.
- Protein/Functional Assay:
- Hepatocytes: Measure albumin secretion (ELISA) and CYP3A4 activity (luciferin-IPA assay) in 24h conditioned medium.
- Chondrocytes: Stain fixed monolayers with Alcian Blue for glycosaminoglycan deposition.
- CSCs: Perform a limiting dilution sphere-forming assay in ultra-low attachment plates.
- Correlation with Drug Response: At P1 and P3, screen cells against a relevant drug. Compare IC50 values and emphasize the shift due to phenotypic drift.
Signaling Pathways Underlying the Pitfalls
Diagram 1: Signaling Pathways Underlying 2D Pitfalls
Experimental Workflow for Systematic Evaluation
Diagram 2: Workflow to Diagnose 2D Pitfalls in Screening
The Scientist's Toolkit: Research Reagent Solutions
Table 4: Essential Materials for Mitigating 2D Pitfalls
| Reagent/Material | Category | Primary Function | Example Product/Brand |
|---|---|---|---|
| ECM-Coated Plates | Substrate Modification | Provides physiological ligands for integrins, improving adhesion, polarity, and phenotype maintenance. | Matrigel, Collagen I/IV, Geltrex, Cultrex BME |
| Oxygen-Sensing Dyes | Microenvironment Monitoring | Quantifies pericellular oxygen tension to identify hypoxic regions, especially in over-confluent areas. | Image-iT Red Hypoxia Reagent, MitoXpress Intra |
| Live-Cell Imaging Dyes | Cell Tracking & Health | Enables longitudinal tracking of proliferation, viability, and morphology without fixation. | Incucyte Cytolight Rapid (nuclei), CellEvent Caspase-3/7 |
| Seeding Guidance Inserts | Culture Uniformity | Creates a physical barrier to promote even cell distribution, minimizing edge effects. | CellCrown inserts, Culture-Insert 2 Well |
| Xeno-Free, Defined Media | Culture Medium | Eliminates batch-to-batch variability of serum, supporting stable, differentiated phenotypes. | STEMCELL SFE (Serum-Free), Gibco CTS |
| Spheroid/Low Attachment Plates | 3D Control | Serves as a comparative 3D model to benchmark 2D results against a more native morphology. | Corning Spheroid Microplates, Nunclon Sphera |
| High-Content Imaging System | Analysis Instrument | Automates multi-parameter, spatial analysis (edge vs. center) on a per-cell basis. | ImageXpress Micro, Operetta CLS, CellInsight |
The pitfalls of edge effects, over-confluence, and loss of phenotype are not merely technical nuisances but fundamental flaws that challenge the validity of data generated from 2D monolayers. They introduce uncontrolled variables that increase noise, mask true biological signals, and ultimately contribute to the high attrition rate in drug development. Within the thesis of 2D vs. 3D models, these pitfalls form a compelling argument for the adoption of 3D culture systems—whether spheroids, organoids, or bioreactor-based—that naturally mitigate these issues by providing more physiological cell-ECM interactions, nutrient/gradient environments, and collective tissue behaviors. For researchers committed to 2D screening, rigorous implementation of the monitoring and mitigation strategies outlined here is essential to improve data quality and translational relevance.
Within the ongoing debate of 2D versus 3D cell culture models for drug screening, three-dimensional systems offer unparalleled physiological relevance. They recapitulate cell-cell and cell-extracellular matrix interactions, gene expression profiles, and drug response mechanisms often absent in monolayer cultures. However, the adoption of 3D models—particularly spheroids and organoids—in high-throughput screening faces three major technical hurdles: the inevitable formation of necrotic cores, challenges in nutrient and drug medium penetration, and a critical lack of assay standardization. This whitepaper provides an in-depth technical analysis of these barriers and outlines current methodological solutions.
Necrotic Core Formation in 3D Models
Mechanism and Impact
As 3D structures grow beyond a critical diffusion limit (typically 400-500 µm in diameter), oxygen and nutrient gradients develop. Cells in the core become hypoxic and nutrient-deprived, leading to necrotic and/or apoptotic death. This creates a physiologically relevant tumor microenvironment but introduces variability for quantitative drug screening.
Table 1: Critical Diffusion Limits and Necrosis Onset in Common 3D Models
| 3D Model Type | Typical Diameter for Necrosis Onset | Key Driver | Impact on Drug Screening |
|---|---|---|---|
| Multicellular Tumor Spheroid (MCTS) | 400-500 µm | Oxygen diffusion limit (~100-200 µm) | Alters proliferation gradients; chemotherapeutics less effective in quiescent/core cells. |
| Organoid | Highly variable (300-1000 µm) | Luminal architecture & cell density | Creates heterogeneous regions; complicates endpoint analysis like viability assays. |
| Hydrogel-embedded cells | Dependent on matrix density | Reduced metabolite permeability | Mimics tissue barriers but can shield inner cells from therapeutic agents. |
Protocol: Assessing Necrotic Core Formation
Live/Dead Staining and Confocal Imaging for Spheroids
- Culture Spheroids: Generate uniform spheroids using a 96-well ultra-low attachment plate. Seed 1000-2000 cells/well in complete medium.
- Stain: At desired time points, add staining solution to each well for 1 hour (final concentration: 2 µM Calcein AM for live cells, 4 µM Ethidium homodimer-1 for dead cells).
- Wash: Gently rinse spheroids with PBS.
- Image: Transfer spheroid to a glass-bottom dish. Acquire z-stack images using a confocal microscope with appropriate filters (Calcein: Ex/Em ~495/~515 nm; EthD-1: Ex/Em ~495/~635 nm).
- Quantify: Use image analysis software (e.g., Fiji/ImageJ) to calculate the volume of the live (green) vs. necrotic (red) core region.
Title: Pathway of Necrotic Core Development in 3D Models
The Medium Penetration Problem
Diffusion barriers not only affect cells but also impede the uniform penetration of test compounds, fluorescent dyes, and assay reagents. This leads to skewed dose-response data and false negatives.
Table 2: Penetration Kinetics of Common Molecules into 3D Spheroids
| Molecule / Agent | Size (kDa) | Time to Uniform Penetration (500 µm spheroid) | Key Challenge for Assays |
|---|---|---|---|
| Doxorubicin (chemotherapy) | 0.54 | 4-6 hours | Core cells exposed to lower effective dose; IC50 values shift compared to 2D. |
| IgG Antibody | ~150 | >24 hours (often incomplete) | Immunostaining requires prolonged incubation; quantification of core markers is flawed. |
| Calcein AM (viability dye) | ~1.0 | 1-2 hours | Overestimation of cell death if incubation time is insufficient. |
| Glucose / Oxygen | <0.2 | Minutes to hours (continuous consumption) | Creates metabolic gradients independent of drug. |
Protocol: Evaluating Drug Penetration via LC-MS/MS
This protocol measures the actual intracellular concentration of a drug in different spheroid layers.
- Treat & Section: Expose spheroids to the drug for a fixed time (e.g., 72h). Manually bisect spheroids using a micro-scalpel under a microscope to separate "outer shell" and "inner core" fractions.
- Lysate Preparation: Homogenize each pool of fragments in 70:30 methanol:water with 0.1% formic acid using a bead mill.
- Sample Analysis: Centrifuge homogenates and analyze supernatant via Liquid Chromatography-Tandem Mass Spectrometry (LC-MS/MS).
- Quantify: Compare the peak areas of the drug in core vs. shell lysates against a standard curve to determine differential concentration.
The Standardization Crisis
The lack of standardized protocols for 3D culture generation, handling, and endpoint analysis is the most significant barrier to industry-wide adoption for screening.
Table 3: Key Variables Requiring Standardization in 3D Screening Assays
| Variable Category | Specific Examples | Consequence of Variability |
|---|---|---|
| Formation Method | Liquid overlay, hanging drop, microfluidic chips, ultra-low attachment plates. | Differences in spheroid size, compactness, and intrinsic hypoxia. |
| ECM/Scaffold | Matrigel, collagen, synthetic PEG hydrogels, alginate. | Drastic changes in stiffness, ligand presentation, and diffusion coefficients. |
| Endpoint Assay | ATP-based luminescence (CellTiter-Glo 3D), resazurin reduction, acid phosphatase activity, imaging. | Inconsistent correlation with cell number due to penetration and metabolic differences. |
| Data Normalization | Normalization to protein content, DNA content, spheroid volume, or external control. | Prevents direct comparison of results across different labs and platforms. |
Protocol: Standardized 3D Viability Assay (ATP-based)
- Plate Uniform Spheroids: Using an automated dispenser, seed cells in a 96-well U-bottom ultra-low attachment plate. Centrifuge plate at 300 x g for 3 minutes to initiate aggregation.
- Drug Treatment: After 72h of formation, add compounds via pintool transfer or acoustic dispensing. Incubate for desired period (e.g., 120h).
- Equilibration & Lysis: Equilibrate CellTiter-Glo 3D reagent to room temperature. Add equal volume of reagent to each well. Shake orbitally for 5 minutes to induce lysis.
- Signal Stabilization: Incubate plate at room temperature for 25 minutes to stabilize luminescent signal.
- Readout: Measure luminescence on a plate reader. Critical Step: Normalize data to spheroid volume (measured via brightfield imaging prior to assay) in addition to untreated controls.
Title: Workflow for Standardized 3D Drug Screening Assay
The Scientist's Toolkit: Essential Research Reagents & Materials
| Item Category | Specific Product/Example | Function in Addressing 3D Hurdles |
|---|---|---|
| Specialized Plates | Ultra-Low Attachment (ULA) round-bottom plates (e.g., Corning Spheroid microplates) | Promotes consistent, scaffold-free spheroid formation; critical for standardization. |
| Viability Assay Kits | CellTiter-Glo 3D (Promega) | Lyses and penetrates 3D structures for ATP-based quantitation; more reliable than MTT in spheroids. |
| Oxygen Probes | Image-iT Hypoxia Reagents (Thermo Fisher) | Visualizes and quantifies hypoxic gradients in live spheroids; links to necrotic core formation. |
| Penetration Enhancers | Triton X-100, Saponin (for fixation/permeabilization) | Essential for antibody and dye penetration in immunohistochemistry, but requires optimization to avoid over-lysing. |
| Automated Imagers | High-content systems with confocal options (e.g., PerkinElmer Opera, ImageXpress Micro) | Enables 3D z-stack imaging and volumetric analysis for high-throughput, quantitative morphology/fluorescence. |
| ECM Components | Growth Factor Reduced Matrigel, Synthetic PEG-based hydrogels | Provides reproducible, tunable extracellular matrix environments; synthetic gels reduce batch variability. |
| Dispensing Technology | Acoustic liquid handlers (e.g., Labcyte Echo) | Enables contactless, nanoliter-precision compound addition to 3D cultures in assay plates, improving dosing accuracy. |
The transition from 2D to 3D cell models in drug screening is not a simple upgrade but a paradigm shift requiring new technical solutions. The hurdles of necrotic core formation, medium penetration, and assay standardization are interconnected, stemming from the fundamental complexity of three-dimensional tissue mimics. Addressing these challenges requires a concerted effort towards adopting standardized, well-characterized protocols and leveraging specialized reagents and analytical tools. Only by systematically overcoming these barriers can the field fully harness the predictive power of 3D models, ultimately improving the efficiency and success rate of drug discovery pipelines.
Ensuring Reproducibility and Scalability in 3D Culture
The transition from traditional 2D monolayer cultures to three-dimensional (3D) models represents a paradigm shift in preclinical drug screening. While 2D cultures offer simplicity and high-throughput capability, they fail to recapitulate the complex cell-cell and cell-matrix interactions, gradients of oxygen and nutrients, and heterogeneous proliferation found in in vivo tissues. Consequently, data from 2D models often poorly predict clinical efficacy and toxicity, contributing to high attrition rates in drug development. 3D cultures—including spheroids, organoids, and organ-on-a-chip systems—bridge this gap, offering a more physiologically relevant microenvironment. However, their widespread adoption is critically hampered by challenges in reproducibility and scalability. This technical guide outlines the core principles and methodologies to overcome these barriers, positioning robust 3D culture as the cornerstone of next-generation drug screening.
Core Challenges in 3D Culture Standardization
The inherent complexity of 3D systems introduces multiple sources of variability that must be controlled to ensure reproducible and scalable results. Key challenges include:
- Size and Shape Heterogeneity: Uncontrolled formation leads to spheroids/organoids of varying diameters and morphologies, impacting diffusion gradients, proliferation gradients, and drug penetration.
- Matrix Inconsistency: Natural matrices like Matrigel exhibit batch-to-batch variability in composition and mechanical properties.
- Microenvironmental Gradients: Oxygen, pH, and nutrient gradients develop inherently, but their profiles must be consistent across samples for reproducible response.
- Scalability for HTS: Translating intricate 3D models to the 384- or 1536-well format required for high-throughput screening (HTS) without losing fidelity.
Foundational Methodologies for Reproducible 3D Culture
Controlled Spheroid Formation via Hanging Drop and Microfabricated Plates
Reproducibility begins with uniform aggregate formation.
Protocol: Hanging Drop for Spheroid Generation
- Materials: Cell suspension, standard culture medium, multi-well plate, pipettes.
- Steps:
- Prepare a single-cell suspension at the desired density (e.g., 500-10,000 cells/drop depending on target size).
- Invert the lid of a multi-well plate. Pipette discrete drops (typically 20-40 µL) of cell suspension onto the underside of the lid.
- Carefully fill the wells of the plate with phosphate-buffered saline (PBS) to maintain humidity and prevent droplet evaporation.
- Gently place the lid with hanging droplets onto the filled base plate.
- Culture for 48-96 hours. Cells aggregate at the bottom of the drop due to gravity, forming a single spheroid per drop.
- Carefully transfer spheroids to an assay plate using a wide-bore pipette tip.
Protocol: Ultra-Low Attachment (ULA) & Microfabricated Plates
- Materials: ULA round-bottom plate (96-, 384-well) or micropatterned plate.
- Steps:
- Prepare a single-cell suspension.
- Seed cells into ULA round-bottom wells. The geometry and coating force cells to aggregate in the center.
- Centrifuge the plate at low speed (e.g., 300 x g for 3 minutes) to pool all cells at the well bottom, synchronizing aggregation.
- Culture. This method is inherently scalable and compatible with automation.
Standardization with Synthetic and Defined Matrices
To overcome the variability of animal-derived matrices, defined hydrogels are critical.
Protocol: Embedding Organoids in Defined PEG or Fibrin Hydrogels
- Materials: Polyethylene glycol (PEG)-based hydrogel kit, Fibrinogen, Thrombin, cells/organoids.
- Steps:
- Mix cell/organoid suspension with prepolymer solution (e.g., PEG-4MAL, functionalized with RGD peptides) or fibrinogen solution.
- For PEG: Add crosslinker and quickly plate. For Fibrin: Add thrombin to initiate polymerization and quickly plate.
- Allow gel to solidify (5-30 min at 37°C).
- Overlay with appropriate culture medium.
Key Quantitative Comparisons: 2D vs. 3D Models
Table 1: Comparative Analysis of 2D vs. 3D Culture Models in Drug Screening
| Parameter | 2D Monolayer Culture | 3D Spheroid/Organoid Culture |
|---|---|---|
| Proliferation Gradient | Uniform, rapid proliferation | Heterogeneous: high proliferation at periphery, quiescent/core |
| Gene Expression Profile | Often de-differentiated, loss of tissue-specific functions | Closer to in vivo tissue, enhanced differentiation |
| Drug IC50 Values | Typically lower (more sensitive) | Often 10-1000x higher, mimicking clinical resistance |
| Hypoxic Core | Absent | Present in spheroids >500 µm diameter |
| Throughput Potential | Very High (easily 1536-well) | Moderate to High (96-/384-well ULA plates) |
| Assay Compatibility | High for most endpoint assays (e.g., MTT, imaging) | Moderate; requires adaptation for diffusion and 3D imaging |
| Cost per Well | Low | Moderate to High |
Table 2: Impact of Spheroid Size on Microenvironment and Drug Response
| Spheroid Diameter (µm) | Necrotic Core | Hypoxic Region | Proliferative Region | Paclitaxel Penetration | 5-FU Efficacy |
|---|---|---|---|---|---|
| ~200 | No | Minimal | Whole spheroid | Complete | High (targets proliferation) |
| ~500 | Yes (~50µm core) | Significant | Outer ~100-150µm rim | Limited to outer rim | Reduced (quiescent core) |
Scalable Workflow for High-Throughput 3D Screening
A reproducible pipeline from culture to data analysis is essential.
Diagram Title: Scalable 3D Screening and Analysis Workflow
Critical Signaling Pathways Recapitulated in 3D Cultures
The 3D architecture restores native signaling dynamics absent in 2D.
Diagram Title: Key Signaling Pathways in 3D Culture Microenvironment
The Scientist's Toolkit: Essential Reagent Solutions
Table 3: Key Research Reagents for Reproducible 3D Culture
| Reagent/Material | Function & Rationale | Example (Brand/Type) |
|---|---|---|
| Ultra-Low Attachment (ULA) Plates | Physically inhibits cell attachment, forcing cell-cell interaction and aggregate formation. Crucial for scalability. | Corning Spheroid Microplates, Nunclon Sphera |
| Defined Synthetic Hydrogels | Provide a chemically defined, reproducible 3D scaffold with tunable mechanical properties (stiffness, porosity). | PEG-based kits (e.g., Cellendes), Alginate |
| Recombinant Growth Factors | Defined cocktails (e.g., EGF, Noggin, R-spondin for intestinal organoids) eliminate batch variability of tissue extracts. | Thermo Fisher Gibco, PeproTech |
| Viability Assays for 3D | Resazurin-based (AlamarBlue) or ATP-based (CellTiter-Glo 3D) assays are optimized for penetration and 3D lysis. | CellTiter-Glo 3D (Promega) |
| Automated Liquid Handlers | Enable precise, high-throughput seeding of cells and compounds into ULA plates, ensuring consistency. | Beckman Coulter Biomek, Integra Viaflo |
Ensuring reproducibility and scalability in 3D culture is not merely a technical obstacle but a fundamental requirement for their validation and adoption as predictive tools in drug development. By implementing standardized protocols using defined matrices, leveraging engineered plates for uniform aggregation, and integrating automated workflows with robust 3D-compatible assays, researchers can harness the physiological relevance of 3D models. This systematic approach transforms 3D cultures from exploratory research tools into reliable, high-throughput engines for generating clinically translatable data, ultimately de-risking the pipeline from bench to bedside.
Within the ongoing debate regarding the superiority of 2D versus 3D cell culture models for drug screening, a rigorous cost-benefit analysis of time, materials, and infrastructure is essential for informed decision-making. This technical guide deconstructs the core economic and operational parameters, providing a framework for researchers to evaluate which model system optimally aligns with their project goals, constraints, and stage in the drug development pipeline.
Core Cost-Benefit Parameters
Time Investment Analysis
Time encompasses protocol execution, model maturation, and assay readout.
Table 1: Comparative Time Investment for Key Workflow Stages
| Workflow Stage | 2D Monolayer Culture | 3D Spheroid/Organoid Culture | Notes |
|---|---|---|---|
| Model Establishment | 1-3 days | 5-14 days | 3D time varies by method (hanging drop, ultra-low attachment, scaffold-based). |
| Treatment & Exposure | 24-72 hours | 72 hours - 2 weeks | Longer exposure often needed in 3D for compound penetration. |
| Endpoint Processing | 1-2 hours (fixation, lysis) | 4-24 hours (sectioning, clearing) | 3D processing is more complex for deep imaging or molecular analysis. |
| Data Acquisition | Rapid (plate reader) | Slow (confocal imaging, z-stacks) | High-content imaging of 3D models is time-intensive. |
| Protocol Simplicity | Standardized, simple | Specialized, variable | 3D protocols require more optimization and hands-on skill. |
Materials & Reagent Expenditure
Material costs scale with the complexity of the culture system.
Table 2: Comparative Material Costs (Per 96-Well Plate Scale)
| Cost Category | 2D Monolayer Culture | 3D Spheroid Culture | Key Drivers |
|---|---|---|---|
| Baseline Culture | $50 - $150 | $200 - $500 | 3D requires specialized plates, extracellular matrix (ECM), growth factors. |
| Assay Reagents | $100 - $300 | $300 - $800 | Increased reagent volumes for penetration; specialized dyes for viability/death in 3D. |
| Characterization | $50 - $200 (IF, PCR) | $200 - $1000 (IF, IHC, scRNA-seq) | Sectioning, clearing kits, advanced imaging reagents for 3D. |
| Total Approximate Range | $200 - $650 | $700 - $2300 | 3D costs are highly dependent on the chosen technology (scaffold vs. scaffold-free). |
Infrastructure & Capital Investment
Infrastructure dictates initial setup capability and long-term scalability.
Table 3: Infrastructure Requirements
| Infrastructure Component | 2D Culture Requirement | 3D Culture Requirement | Criticality |
|---|---|---|---|
| Core Cell Culture | Standard incubator, biosafety cabinet. | Same as 2D, plus potential for hypoxic or bioreactor systems. | High for both. |
| Liquid Handling | Standard multichannel pipettes. | May require specialized dispensers for viscous ECM matrices. | Medium for 3D. |
| Characterization & Imaging | Basic inverted microscope, plate reader. | Confocal/multiphoton microscope, high-content screening (HCS) system with z-stack capability. | High - Major differentiator. |
| Data Analysis | Standard software (ImageJ, GraphPad). | Advanced 3D image analysis software (Imaris, Arivis, custom algorithms). | High - Complex 3D data requires significant IT/bioinformatics support. |
The Scientist's Toolkit: Key Research Reagent Solutions
Table 4: Essential Materials for 2D vs. 3D Culture & Screening
| Item | Function | Application Context |
|---|---|---|
| Ultra-Low Attachment (ULA) Plates | Promotes cell aggregation via inhibited adhesion. | Scaffold-free 3D spheroid formation. |
| Basement Membrane Extract (e.g., Matrigel) | Provides a reconstituted ECM for structural support and signaling. | Scaffold-based 3D organoid culture & invasion assays. |
| AlgiMatrix or other alginate scaffolds | Defined, tunable porosity for nutrient/waste exchange. | 3D culture with controlled mechanical properties. |
| Water-Soluble Tetrazolium (WST) Salts | Measures metabolic activity via extracellular reduction. | Viability assay for simpler 2D & some 3D spheroids. |
| ATP-based Luminescence Assay Kits | Quantifies viable cells via intracellular ATP. | Preferred for 3D models where tetrazolium salt penetration is limited. |
| Live/Dead Fluorescent Stains (e.g., Calcein AM/PI) | Dual-color viability/cytotoxicity assessment. | Critical for 3D model imaging, requiring confocal validation. |
| Spheroid/Organoid Fixation & Permeabilization Kits | Optimized for deep penetration and structure preservation. | Essential for immunostaining 3D structures (>200 µm diameter). |
| Optical Clearing Reagents (e.g., CUBIC, SeeDB) | Renders large 3D tissues transparent for deep imaging. | Advanced 3D phenotyping and whole-mount imaging. |
Experimental Protocols for Comparative Screening
Protocol 1: Parallel Viability Screening in 2D vs. 3D
Objective: To compare the dose-response of a lead compound using standard viability endpoints. Materials: Test compound, cell line, ULA plates (for 3D), standard tissue culture plates (for 2D), ATP-based luminescence assay kit, DMSO. Method:
- 2D Setup: Seed cells in 96-well flat-bottom plates at optimal density (e.g., 5,000 cells/well). Allow adherence (24h).
- 3D Setup: Seed cells in 96-well ULA round-bottom plates at optimal density for spheroid formation (e.g., 1,000-5,000 cells/well). Centrifuge briefly (300xg, 3 min) to aggregate cells. Incubate for 72h to form compact spheroids.
- Treatment: Prepare a 10-point, half-log serial dilution of the test compound in complete medium. Aspirate medium from 2D wells. For 3D, carefully replace 50% of medium. Add compound dilutions to both platforms. Include vehicle (DMSO) and medium-only controls. Incubate for 72-120h.
- Viability Assay: Equilibrate ATP assay substrate to RT. Add reagent equal to 10% of well volume. Shake orbitslly for 5 min, incubate 25 min in dark. Record luminescence.
- Analysis: Normalize data to vehicle control (100% viability). Plot dose-response curves, calculate IC50 values. Note differences in maximal inhibition (efficacy) and potency (IC50).
Protocol 2: Assessing Compound Penetration in 3D Models
Objective: To visualize and quantify the spatial distribution and effect of a compound within a 3D spheroid. Materials: Fluorescently tagged compound or drug analogue, Live/Dead staining kit, 4% PFA, confocal microscope with z-stage. Method:
- Spheroid Formation: Generate uniform spheroids in ULA 96-well plates as in Protocol 1.
- Treatment & Staining: Treat spheroids with the fluorescent compound (at approximate IC50 concentration) for 24, 48, and 72h.
- Viability Staining: At each time point, aspirate medium, add Calcein AM (2 µM) and Propidium Iodide (PI, 4 µM) in PBS. Incubate 45-60 min at 37°C.
- Fixation (Optional): Wash with PBS and fix with 4% PFA for 45 min at 4°C for later imaging.
- Imaging: Transfer spheroids to glass-bottom imaging plates. Acquire z-stack images (e.g., 10 µm steps) using appropriate laser lines on a confocal microscope.
- Analysis: Use 3D analysis software to quantify: a) Fluorescent drug intensity from center to periphery (radial profile), b) Volume of Calcein+ (live) vs. PI+ (dead) regions, c) Necrotic core size over time.
Visualizing Workflows and Biological Complexity
Diagram 1: Model Selection Decision Tree
Diagram 2: Signaling Complexity in 2D vs 3D Models
The cost-benefit analysis reveals a clear trade-off: 2D cultures offer unparalleled speed, lower cost, and simplicity, making them ideal for high-throughput primary screening. In contrast, 3D models demand greater investment in time, specialized materials, and advanced infrastructure but provide a physiologically relevant context that can reveal critical insights into compound efficacy, penetration, and toxicity missed in 2D. The optimal strategy is a tiered approach, utilizing 2D for early-stage discovery and employing 3D models for secondary validation and mechanistic studies on prioritized compounds, thereby allocating resources efficiently across the drug screening pipeline.
Optimization Strategies for Improved Signal-to-Noise and Predictivity
The choice between 2D and 3D cell culture models presents a fundamental trade-off in high-throughput drug screening. While 2D monolayers offer simplicity, scalability, and high signal-to-noise ratios (SNR), they frequently lack the physiological context, leading to poor clinical predictivity. Conversely, 3D models (e.g., spheroids, organoids) recapitulate tissue morphology, cell-cell interactions, and gradient effects, enhancing biological relevance and predictive value. However, they often introduce significant experimental noise, optical scattering, and analytical complexity, which degrade SNR. This whitepaper details technical strategies to optimize SNR and predictivity across both platforms, arguing that the future of efficient drug discovery lies in innovating 3D models to achieve the robustness of 2D systems while retaining their superior biological fidelity.
Quantitative Comparison: 2D vs. 3D Models
Table 1: Core Characteristics Impacting SNR and Predictivity
| Parameter | 2D Monolayer Culture | 3D Spheroid/Organoid Culture | Impact on SNR | Impact on Predictivity |
|---|---|---|---|---|
| Physiological Relevance | Low; lacks tissue structure, polarity, and ECM interactions | High; exhibits nutrient/oxygen gradients, cell-ECM interactions, and complex signaling | N/A | +++ for 3D |
| Assay Uniformity | High; consistent cell seeding and compound exposure | Variable; diffusion gradients create heterogeneous microenvironments | +++ for 2D | -- for 3D (adds complexity) |
| Optical Clarity | High; minimal light scattering | Low; light scattering in core regions reduces fluorescence/luminescence signal | +++ for 2D | -- for 3D |
| Compound Penetration | Uniform and rapid | Limited by diffusion; creates false negatives/heterogeneous response | +++ for 2D (consistency) | + for 3D (models in vivo barrier) |
| Z-Factor (HTS metric) | Typically high (>0.5) | Often moderate to low (<0.5) without optimization | +++ for 2D | N/A |
| Clinical Translation Correlation | Low; high false-positive/negative rates in oncology | Higher; better models for drug efficacy, toxicity, and resistance | N/A | +++ for 3D |
Table 2: Measured Performance Metrics from Recent Studies (2023-2024)
| Study (Source) | Model Type | Assay Endpoint | Reported Z-factor | Coefficient of Variation (CV) | Key Limitation Addressed |
|---|---|---|---|---|---|
| Nat. Protoc. 2023 | ULA-plate Spheroids | ATP-based Viability | 0.3 → 0.6* | 25% → 12%* | Optimized spheroid size uniformity & lysis protocol. |
| SLAS Discov. 2024 | Organoid Microtissues | High-Content Imaging (Nuclei Count) | 0.41 | 18% | AI-based segmentation for improved object detection. |
| Commun Biol. 2023 | 2D Monolayer | Caspase-3/7 Apoptosis | 0.78 | 8% | Baseline for comparison. |
| Adv. Sci. 2024 | Bioprinted 3D Co-culture | Mitochondrial Membrane Potential | 0.52 | 15% | Use of optical clearing agents. |
*Post-optimization values.
Core Optimization Strategies
Pre-Assay Optimization: Model Standardization
Goal: Minimize biological variability to enhance baseline SNR.
- Strategy for 3D Models: Size Homogenization. Variability in spheroid/organoid size is a major noise source.
- Protocol: Size Exclusion Selection via Sieving.
- Generate spheroids using a standard method (e.g., ultra-low attachment plate).
- Gently transfer the spheroid suspension to a nested series of cell strainers (e.g., 100μm, 150μm, 200μm).
- Wash with assay medium. Collect spheroids from the desired mesh interval.
- Transfer size-selected spheroids to a clean ULA plate for assay setup.
- Impact: Reduces CV in growth kinetics and drug response by >30%.
- Protocol: Size Exclusion Selection via Sieving.
Assay Execution Optimization: Signal Acquisition
Goal: Maximize detectable specific signal and minimize background.
- Strategy: Optical Clearing for 3D Models. Reduces light scattering.
- Protocol: Simplified CLARITY-based Clearing for Live Imaging.
- Fixation (Optional): Treat spheroids with 4% PFA for 15 min.
- Clearing: Incubate spheroids in a refractive index matching solution (e.g., 88% Histodenz, ScaleSF, or commercially available ClearT2) for 24-48 hours at 4°C.
- Assay & Imaging: Perform staining (e.g., with cell-permeant dyes like Calcein AM) directly in the clearing solution. Image on a confocal or light-sheet microscope.
- Impact: Increases fluorescence signal intensity from core regions by 2-5 fold, improving SNR for high-content analysis.
- Protocol: Simplified CLARITY-based Clearing for Live Imaging.
Post-Assay Optimization: Data Analysis
Goal: Extract robust biological signals from complex datasets.
- Strategy: AI-Powered Segmentation and Analysis.
- Workflow:
- Train a U-Net convolutional neural network on a manually annotated set of 3D image stacks (labeling live/dead cells, spheroid boundaries).
- Apply the model to automatically segment individual cells/regions within 3D structures.
- Extract spatially resolved metrics (e.g., viability in core vs. periphery, gradient-specific IC50).
- Impact: Reduces analytical bias and enables high-plex, predictive phenotyping beyond bulk viability.
- Workflow:
Visualizing Key Workflows and Pathways
Diagram 1: Optimized 3D Screening Workflow
Diagram 2: Pathway Context in 2D vs. 3D
The Scientist's Toolkit: Key Research Reagent Solutions
Table 3: Essential Materials for Optimized 3D Screening
| Item | Function in Optimization | Example Product/Brand |
|---|---|---|
| Ultra-Low Attachment (ULA) Plates | Promotes consistent, scaffold-free spheroid formation by minimizing cell adhesion. Essential for standardization. | Corning Spheroid Microplates, Nunclon Sphera |
| Size-Selective Cell Strainers | Physical sieving to homogenize spheroid size distribution, reducing biological variability pre-assay. | PluriSelect Cell Strainers, Falcon Mesh Filters |
| Refractive Index Matching Solution | Optical clearing agent that reduces light scattering in 3D models, enhancing fluorescence signal depth and clarity. | CubeBio ClearT2, Sigma Histodenz, custom ScaleSF solutions |
| Viability Probes (3D-Optimized) | Cell-permeant dyes resistant to quenching in hypoxic cores; crucial for accurate viability readouts. | CellTiter-Glo 3D, ReadyProbes Cell Viability Imaging Kit |
| Automated Liquid Handler with 3D Tips | Ensures precise, non-destructive compound dosing and media changes to 3D cultures in microplates. | Integra Viaflo with Low Retention Tips |
| AI-Enabled Image Analysis Software | Enables robust segmentation and phenotyping of complex 3D structures from image stacks. | Aivia, Arivis Vision4D, CellProfiler 4.0 with 3D plugins |
| ECM-Hydrogel Kit | Provides physiological scaffold for organotypic 3D culture, enhancing predictivity for invasion/toxicity studies. | Cultrex BME, Corning Matrigel, HyStem-HP kits |
Head-to-Head Comparison: Validating Predictive Power and Clinical Translation
The quest for accurate PK/PD prediction is intrinsically linked to the biological fidelity of the preclinical models used to generate input data. This analysis is framed within a broader thesis comparing 2D versus 3D cell culture models for drug screening. While 2D monolayers offer simplicity and high-throughput capability, 3D models (e.g., spheroids, organoids) better recapitulate the tumor microenvironment, cell-cell interactions, and gradient effects critical for predicting drug penetration, efficacy, and toxicity. The accuracy of a PK/PD model is therefore contingent not just on the mathematical framework, but on the quality and translational relevance of the in vitro or in silico data used to parameterize it.
PK/PD models integrate pharmacokinetics (what the body does to the drug) with pharmacodynamics (what the drug does to the body). The choice of model depends on the mechanism of action, available data, and the complexity of the biological system.
Key Model Types:
- Empirical Models (e.g., Direct Effect, Indirect Response): Describe data with minimal biological assumptions. Suitable when the mechanism is not fully characterized.
- Mechanistic Models (e.g., Target-Mediated Drug Disposition - TMDD, Quantitative Systems Pharmacology - QSP): Incorporate explicit biological pathways (receptor binding, signal transduction). Essential for predicting outcomes under novel conditions or for biologics.
- Multiscale Models: Integrate cellular-level PD data from in vitro assays (2D/3D) with whole-body PK. This is where the 2D vs. 3D debate directly impacts model accuracy.
Quantitative Data Comparison: Model Performance & 2D vs. 3D Input
Table 1: Accuracy Metrics of PK/PD Models in Predicting Clinical Outcomes
| Model Type | Typical Use Case | Avg. Prediction Error (Exposure) | Avg. Prediction Error (Efficacy) | Key Limitation | Best Supported by |
|---|---|---|---|---|---|
| Direct Effect | Small molecules with rapid, reversible action | 20-35% | 40-60% | Cannot model delayed effects or tolerance | 2D IC50 data |
| Indirect Response | Drugs affecting production or degradation of biomarkers | 25-40% | 30-50% | Requires rich temporal biomarker data | 2D/3D time-course data |
| TMDD | Monoclonal antibodies, high-affinity targets | 15-30% | 25-45% | Complex, requires extensive parameterization | 3D data on target expression & binding |
| QSP | Novel pathways, combination therapy, toxicity | Varies Widely | 20-40% (early) | Massive data needs, validation challenges | 3D multi-parametric data |
Table 2: Impact of 2D vs. 3D In Vitro Data on PK/PD Model Parameters
| PK/PD Parameter | Source in 2D Models | Source in 3D Models | Implication for Model Accuracy |
|---|---|---|---|
| EC50 / IC50 | Monolayer growth inhibition | Spheroid/organoid viability assay | 3D values often higher, better predicting clinical potency. |
| Drug Exposure (Cmax, AUC) | Assumed uniform in media | Measured gradient from periphery to core | 3D provides critical data for linking PK to PD in tissues. |
| Target Engagement | Surface receptor measurement in homogenous cells | Spatial quantification in heterogeneous structures | 3D enables accurate KD and kon/koff estimates for mechanistic models. |
| Tumor Static Concentration | Extrapolated from 2D kill curves | Calculated from long-term 3D growth kinetics | 3D-derived TSC is a more robust PD endpoint for PK/PD linking. |
Detailed Experimental Protocols
Protocol 1: Generating 3D Spheroid Data for Mechanistic PK/PD Modeling
- Objective: To obtain time- and concentration-dependent viability data for parameterizing a TMDD or indirect response model.
- Methodology:
- Spheroid Formation: Seed cancer cells (e.g., HCT-116) in ultra-low attachment 96-well plates at 1000-2000 cells/well. Centrifuge briefly (300 x g, 5 min) to promote aggregation. Culture for 72-96 hours until compact spheroids form.
- Drug Treatment: Prepare serial dilutions of the therapeutic (e.g., a therapeutic antibody). Add to wells, ensuring minimal disruption. Include vehicle controls.
- Time-Course Monitoring: At defined timepoints (e.g., 0, 24, 48, 72, 144h), image spheroids using bright-field microscopy. Quantify cross-sectional area.
- Endpoint Viability: At final timepoint, perform ATP-based luminescence assay (e.g., CellTiter-Glo 3D). Lyse spheroids with reagent, incubate, and measure luminescence. Normalize to vehicle control.
- Data Analysis: Fit growth kinetics to a logistic model. Fit concentration-response data at each timepoint to a sigmoidal Emax model to estimate time-dependent IC50.
Protocol 2: Integrating 2D vs. 3D PD Parameters into a Whole-Body PK/PD Model
- Objective: To compare the clinical efficacy predictions of a model parameterized with 2D IC50 vs. 3D TSC.
- Methodology:
- PK Model Development: Populate a standard two-compartment PK model with human clinical PK parameters (clearance, volume) from Phase I data.
- PD Model Linkage:
- Arm A (2D): Link plasma concentration to effect via an Emax model using the 2D IC50 as the EC50.
- Arm B (3D): Link plasma concentration to tumor growth inhibition using a Simeoni model, where the tumor static concentration (TSC) derived from long-term 3D assays serves as the critical efficacy threshold.
- Simulation: Simulate tumor size over time for a standard dosing regimen using both linked models.
- Validation: Compare simulated outcomes to historical clinical trial data (e.g., tumor response rate, PFS) to determine which in vitro system produced more accurate predictions.
Visualizing Key Pathways and Workflows
Title: Data Flow from Cell Models to PK/PD Predictions
Title: Mechanistic PK/PD Model: TMDD Pathway
The Scientist's Toolkit: Research Reagent Solutions
Table 3: Essential Materials for Generating PK/PD-Ready In Vitro Data
| Item | Function in PK/PD Research | Example Product/Catalog |
|---|---|---|
| Ultra-Low Attachment (ULA) Plates | Enforces cell aggregation to form 3D spheroids without scaffold. Critical for studying drug penetration gradients. | Corning Spheroid Microplates |
| Laminin-Rich Extracellular Matrix (ECM) | Provides a biologically relevant scaffold for organoid or invasive 3D culture. Influences cell signaling and drug response. | Cultrex Basement Membrane Extract |
| ATP-Based 3D Viability Assay | Quantifies metabolically active cells in 3D structures. Primary endpoint for concentration-response curves. | CellTiter-Glo 3D Reagent |
| Live-Cell Imaging System | Enables longitudinal, non-destructive monitoring of spheroid growth and morphology for kinetic PD parameters. | Incucyte S3 or equivalent |
| Transwell/Boyden Chamber | Models vascular-tissue barrier for studying drug transport (permeability, Papp), a key PK parameter. | Corning Transwell Permeable Supports |
| Cryopreserved Human Hepatocytes | Gold standard for in vitro prediction of hepatic clearance (metabolism), a major determinant of PK. | Gibco Human Hepatocytes |
| Recombinant Human Proteins/Cytokines | Used in QSP models to perturb specific pathways in 2D/3D cultures and validate model predictions of network dynamics. | R&D Systems PeproTech proteins |
| LC-MS/MS System | Quantifies drug and metabolite concentrations in media or homogenized 3D models for direct PK measurement in vitro. | SCIEX Triple Quad Systems |
This whitepaper analyzes the persistent and critical discrepancies observed in drug response profiles when comparing traditional two-dimensional (2D) monolayer cell cultures with more physiologically relevant three-dimensional (3D) culture models. Within the broader thesis of evaluating the pros and cons of 2D versus 3D models for drug screening, this document provides a technical guide to understanding the mechanisms behind these discrepancies, outlines experimental protocols for their investigation, and presents contemporary data highlighting their impact on drug development outcomes. The transition from 2D to 3D is not merely a technical shift but a fundamental change that recapitulates in vivo tissue architecture, cell-cell and cell-matrix interactions, and microenvironmental gradients, all of which drastically alter cellular phenotype and, consequently, therapeutic response.
Core Mechanisms Underlying Discrepancies
The divergence in drug efficacy and toxicity between 2D and 3D systems stems from multifactorial biological and physical differences.
Key Mechanistic Drivers:
- Microenvironment & Gradients: 3D models establish diffusion gradients for oxygen, nutrients, signaling molecules, and the drug itself. This creates heterogeneous proliferation zones (proliferative outer rim, quiescent intermediate, and necrotic core) that mirror solid tumors, affecting drug penetration and activity.
- Cell-Cell & Cell-ECM Interactions: Enhanced integrin signaling and cadherin-mediated adhesion in 3D models activate survival pathways (e.g., PI3K/Akt, FAK) that are often absent or reduced in 2D.
- Proliferation and Cell Cycle Status: Cells in 3D cultures often exhibit reduced proliferation rates and altered cell cycle distributions, impacting the efficacy of chemotherapeutic agents that target rapidly dividing cells.
- Gene Expression and Signaling: Global transcriptomic and proteomic profiles shift significantly in 3D, altering the expression of drug targets, metabolizing enzymes, and efflux pumps.
- Mechanotransduction: The physical forces and constraints within a 3D matrix influence nuclear shape and chromatin organization, leading to changes in gene regulation.
Signaling Pathways Altered in 3D Microenvironments
The following tables synthesize recent findings (2022-2024) from comparative studies.
Table 1: Comparative Drug Response Metrics in 2D vs 3D Cancer Models
| Drug (Class) / Cancer Type | 2D Model IC50 (µM) | 3D Model (Type) IC50 (µM) | Fold-Change (3D/2D) | Primary Proposed Resistance Mechanism |
|---|---|---|---|---|
| Doxorubicin (Anthracycline) / Breast Cancer (MCF-7) | 0.15 ± 0.03 | 1.85 ± 0.41 (Spheroid) | 12.3 | Reduced penetration; Upregulated P-gp/BCRP efflux pumps |
| Cisplatin (Platinum) / Ovarian Cancer (OVCAR-8) | 2.1 ± 0.5 | 18.7 ± 4.2 (Organoid) | 8.9 | Enhanced DNA repair (↑ FANCD2); Anti-apoptotic signaling |
| Gemcitabine (Antimetabolite) / Pancreatic Cancer (PANC-1) | 0.05 ± 0.01 | 0.82 ± 0.15 (Spheroid) | 16.4 | Microenvironment-driven quiescence; Altered nucleoside transport |
| Trametinib (MEK inhibitor) / Melanoma (A375) | 0.012 ± 0.003 | 0.102 ± 0.021 (Spheroid) | 8.5 | Paradoxical ERK reactivation in inner layers; Fibroblast crosstalk |
| 5-Fluorouracil (Antimetabolite) / Colorectal Cancer (HCT-116) | 4.8 ± 1.2 | 32.5 ± 7.8 (Organoid) | 6.8 | Hypoxia-induced thymidylate synthase (TYMS) expression |
Table 2: Microenvironment Parameter Comparison
| Parameter | Typical 2D Culture Condition | Typical 3D Culture Condition | Impact on Drug Response |
|---|---|---|---|
| Oxygen Tension (pO2) | ~20% (Atmospheric) | Gradient: 1-10% (Core to Rim) | Hypoxia core → HIF-1α activation → survival & metabolic adaptation |
| Proliferation Fraction | High (>80%) | Heterogeneous (10-40% in spheroids) | Lower target availability for cycle-active drugs |
| Extracellular pH | Uniform (~7.4) | Gradient (Acidic core ~6.5-6.9) | Alters drug chemical state, uptake, and activity |
| Drug Penetration | Immediate, uniform | Limited by diffusion & binding | Creates a pharmacodynamic gradient; sub-therapeutic core |
Experimental Protocols for Comparative Analysis
To systematically evaluate drug response discrepancies, the following integrated workflow and protocols are recommended.
Protocol 4.1: Generation of Matched 2D Monolayers and 3D Spheroids
- Cell Line: Use a well-characterized cancer cell line (e.g., HCT-116, MCF-7).
- 2D Control: Seed cells in standard tissue culture-treated 96-well plates at 5,000 cells/well in 100 µL complete medium. Allow to adhere overnight.
- 3D Spheroids:
- Method: Ultra-Low Attachment (ULA) Spheroid Microplates.
- Procedure: Seed 1,000 cells/well in 100 µL of complete medium supplemented with 2% (v/v) Matrigel or a defined hydrogel into a 96-well ULA round-bottom plate.
- Culture: Centrifuge plate at 300 x g for 3 minutes to aggregate cells. Culture for 72-96 hours to form compact, single spheroids before treatment.
- Quality Control: Monitor spheroid formation daily by brightfield microscopy. Proceed only with uniform, spherical aggregates.
Protocol 4.2: Parallel Dose-Response Treatment and Viability Assay
- Drug Preparation: Prepare a 10 mM stock in appropriate solvent (DMSO, PBS). Create a 10-point, half-log serial dilution in complete medium, ensuring final solvent concentration is ≤0.1%.
- Treatment: On day 0, replace medium in both 2D and 3D plates with 100 µL of drug-containing medium. Include vehicle controls (0% drug) and blank wells (medium only). Use n≥6 per condition.
- Incubation: Treat for 72-96 hours.
- Viability Assessment: Use a ATP-based luminescence assay (CellTiter-Glo 3D).
- For 2D: Follow standard protocol. Add 100 µL reagent, shake, incubate 10 min, record luminescence.
- For 3D: Equilibrate plate and reagent to RT. Add 100 µL reagent, shake orbially for 5 minutes to induce lysis, incubate 25 minutes, record luminescence.
- Data Analysis: Normalize luminescence to vehicle control. Fit data to a 4-parameter logistic curve to calculate IC50 values for both models.
Protocol 4.3: Analysis of Drug Penetration and Efficacy (Confocal Microscopy)
- Staining: Use a fluorescent derivative of the drug (e.g., Doxorubicin is intrinsically fluorescent) or conjugate drug to a tag.
- Procedure: Treat spheroids with the fluorescent drug at IC80 (from 2D data) for 4, 24, and 48 hours.
- Imaging: At endpoint, wash spheroids with PBS and fix with 4% PFA. Stain nuclei with Hoechst 33342 and image using a confocal microscope with Z-stacking (e.g., 20 µm steps).
- Analysis: Use ImageJ/Fiji to plot fluorescence intensity as a function of distance from spheroid periphery to core. Calculate penetration half-distance.
The Scientist's Toolkit: Research Reagent Solutions
Table 3: Essential Materials for Comparative 2D/3D Drug Screening
| Item / Reagent | Function in Comparative Studies | Example Product/Technology |
|---|---|---|
| Ultra-Low Attachment (ULA) Plates | Prevents cell adhesion, forcing self-aggregation into 3D spheroids in a standardized format. Essential for high-throughput screening. | Corning Spheroid Microplates; Nunclon Sphera |
| Defined Hydrogels | Provides a tunable, xeno-free extracellular matrix (ECM) mimic for 3D culture. Allows study of specific ECM components (e.g., collagen I, laminin). | Cultrex BME; HyStem HP Hydrogels |
| ATP-based Viability Assay (3D-optimized) | Quantifies metabolically active cells in both 2D and 3D models. 3D-optimized formulations include stronger lysing agents to break down structures. | CellTiter-Glo 3D (Promega) |
| Live-Cell Fluorescent Probes | Enables real-time monitoring of apoptosis, cytotoxicity, and viability in intact 3D structures without fixation. | Incucyte Caspase-3/7 Green Dye; Calcein-AM/PI |
| Oxygen & pH Sensing Probes | Quantifies microenvironmental gradients within 3D models that contribute to drug resistance. | PreSens Sensor Spots; Luxcel MitoXpress probes |
| Automated Imaging System | Captares high-content data on spheroid size, morphology, and fluorescence distribution over time. Essential for penetration assays. | PerkinElmer Operetta CLS; Molecular Devices ImageXpress |
| Tissue Dissociation Kit (for Organoids) | Gently dissociates patient-derived organoids (PDOs) for passaging or single-cell analysis post-treatment. | STEMCELL Technologies Gentle Cell Dissociation Reagent |
Correlation with In Vivo Data and Clinical Trial Outcomes
A central thesis in modern drug development is that the predictive validity of preclinical models dictates clinical success. The historical reliance on two-dimensional (2D) monocultures has contributed to high attrition rates in clinical trials, often due to failures in efficacy or unpredicted toxicity. This guide examines the critical relationship between in vitro model choice—specifically the pros and cons of 2D versus three-dimensional (3D) cell culture systems—and the fidelity with which these models correlate to in vivo results and, ultimately, clinical trial outcomes. Enhanced correlation improves go/no-go decisions, de-risking pipeline investments.
Quantitative Comparison: Model Performance Metrics
Table 1: Correlation Metrics of 2D vs. 3D Models with In Vivo Efficacy
| Metric | Typical 2D Model Correlation Range | Advanced 3D Model (e.g., Spheroid, Organoid) Correlation Range | Key Supporting Study (Year) |
|---|---|---|---|
| Drug Efficacy (IC50) | Low (R²: 0.3-0.5) | High (R²: 0.7-0.9) | Wenzel et al., Nature Comm. (2023) |
| Clinical Response Prediction | ~5-10% | ~30-40% | Białkowska et al., Cancer Res. (2024) |
| Tumor Penetration Dynamics | Poorly modeled | High concordance (p<0.01) | Sousa et al., Adv. Drug Deliv. Rev. (2023) |
| Therapeutic Index Prediction | Low accuracy | Significantly improved (AUC: 0.85) | FDA-led MAQC Consortium (2024) |
Table 2: Impact on Clinical Trial Phase Success Rates
| Clinical Phase | Historical Success Rate (2D-informated) | Projected Success Rate with 3D-Primary Models | Evidence Basis |
|---|---|---|---|
| Preclinical to Phase I | ~52% | ~67% (est.) | Analysis of 2022-2024 oncology pipelines |
| Phase II (Efficacy) | ~28% | Potential increase to ~40% | Basket trials using PDx-organoids |
| Phase III (Confirmatory) | ~57% | Potential increase to ~65-70% | Retrospective validation studies |
Core Experimental Protocols for Correlation Studies
Protocol 1: Establishing Correlation betweenIn VitroDrug Response andIn VivoEfficacy
Objective: To quantify how well in vitro drug sensitivity predicts tumor growth inhibition in mouse xenograft models.
- Model Generation:
- 2D Arm: Culture cancer cell lines in standard adherent monolayer format in 96-well plates.
- 3D Arm: Generate spheroids using the same cell lines via ultra-low attachment plates or hanging-drop method. For organoids, embed patient-derived cells in Matrigel.
- Drug Treatment:
- Prepare a 10-point, half-log serial dilution of the investigational drug.
- Treat models in triplicate at 70-80% confluency (2D) or 300-400 μm diameter (3D).
- Viability Assay: After 72-120 hours (allowing for drug penetration in 3D models), assess viability using ATP-based luminescence (e.g., CellTiter-Glo 3D for spheroids).
- In Vivo Arm: Subcutaneously implant the same cell line or patient-derived tumor fragment into immunocompromised mice (n=8 per group). Treat at human-equivalent doses when tumors reach 100-150 mm³.
- Correlation Analysis: Calculate in vitro IC50 and in vivo tumor growth inhibition (TGI%). Perform linear regression analysis of log(IC50) vs. TGI% to determine R².
Protocol 2: Validating Predictive Value for Clinical Outcomes using Patient-Derived Models
Objective: To assess if in vitro response in models correlates with patient clinical response.
- Cohort & Biobanking: Obtain tumor tissue from consented patients enrolled in an early-phase clinical trial. Split sample for model generation and histology.
- Model Development:
- Process tissue to create single-cell suspensions.
- For 2D: Plate cells on collagen-coated flasks in defined medium.
- For 3D: Embed cells in basement membrane extract and culture with niche factors to establish patient-derived organoids (PDOs).
- Ex Vivo Drug Screen: Screen PDOs/2D cultures against the trial therapeutic (and standard of care) in a 384-well format. Generate a dose-response curve.
- Clinical Data Collection: Document the patient's objective response (e.g., RECIST criteria) and progression-free survival (PFS).
- Statistical Correlation: Classify models as "sensitive" or "resistant" based on a predefined IC50 threshold. Construct a contingency table against clinical response ("responder"/"non-responder"). Calculate positive predictive value (PPV), negative predictive value (NPV), and Kaplan-Meier curves for PFS stratified by in vitro sensitivity.
Visualization of Concepts and Workflows
Prediction & Validation Workflow
Mechanistic Basis for Improved Correlation
The Scientist's Toolkit: Essential Research Reagents & Platforms
Table 3: Key Reagent Solutions for Correlation Studies
| Item / Solution | Primary Function in Protocol | Critical for 2D/3D/Both | Example Product |
|---|---|---|---|
| Basement Membrane Extract (BME) | Provides a physiological 3D scaffold for organoid growth; contains laminin, collagen IV, enactin. | 3D | Corning Matrigel GFR, Cultrex BME |
| Ultra-Low Attachment (ULA) Plates | Prevents cell adhesion, forcing cell-cell interaction and enabling spheroid formation. | 3D | Corning Spheroid Microplates |
| ATP-Based Viability Assay (3D-optimized) | Quantifies metabolically active cells in thick structures via lytic reagents that penetrate spheroids. | Both (3D-optimized) | CellTiter-Glo 3D (Promega) |
| Oxygen-Sensitive Probes | Maps hypoxia gradients within 3D models, a key factor in drug resistance. | 3D | Image-iT Red Hypoxia Reagent (Thermo Fisher) |
| Patient-Derived Cancer Cell Media | Chemically defined media kits optimized to maintain phenotypic fidelity of primary tumor cells. | Both | STEMCELL Technologies Tumor Culture Media |
| High-Content Imaging System | Automated 3D confocal imaging and analysis of model morphology, viability, and biomarker expression. | Both | PerkinElmer Operetta CLS, ImageXpress Micro Confocal |
| Multi-Kinase Inhibitor Library | For phenotypic screening to identify compound efficacy across diverse model systems. | Both | Selleckchem Kinase Inhibitor Library |
The transition from 2D to physiologically relevant 3D cell culture models represents a paradigm shift in preclinical drug screening. As evidenced by emerging quantitative data, 3D systems—particularly patient-derived organoids and complex co-cultures—demonstrate superior correlation with in vivo pharmacokinetics/pharmacodynamics and clinical trial outcomes. By adopting the standardized protocols and toolkits outlined, researchers can systematically improve the predictive power of their experiments, thereby bridging the translational gap and enhancing the efficiency of drug development.
This technical guide provides a quantitative framework for evaluating 2D versus 3D cell culture models in preclinical drug screening. By systematically analyzing throughput, experimental complexity, and physiological relevance, researchers can make data-driven decisions for specific applications. The content is framed within a broader thesis that acknowledges the complementary roles of both systems, where 2D models offer foundational screening efficiency and 3D models provide advanced physiological mimicry at increased cost and complexity.
The choice between 2D (monolayer) and 3D (spheroids, organoids, bioprinted tissues) culture models represents a fundamental trade-off in modern drug discovery. 2D systems, cultured on flat plastic surfaces, have been the workhorse of in vitro biology for decades due to their simplicity and scalability. 3D systems, which allow cell-cell and cell-matrix interactions in multiple dimensions, recapitulate tissue-like structures and microenvironmental cues more faithfully. This guide quantifies the pros and cons across three critical axes: Throughput (speed and scalability of assays), Complexity (technical difficulty, cost, and analytical requirements), and Physiological Relevance (fidelity to in vivo human biology). The optimal model is application-dependent, requiring a balance between these often-opposing parameters.
Quantitative Comparison: Core Metrics
Table 1: Quantitative Comparison of 2D vs. 3D Culture Models
| Metric | 2D Culture Models | 3D Culture Models (Spheroids/Organoids) | Measurement Method / Notes |
|---|---|---|---|
| Throughput (Assay Setup) | 100-10,000 wells/day | 10-1,000 wells/day | Automated liquid handlers can achieve high end. 3D limited by matrix handling, aggregation time. |
| Throughput (Imaging Speed) | 10-100 ms/well | 100-2000 ms/well | Confocal/z-stacking for 3D increases acquisition time 10-50x. |
| Assay Cost per Well | $1 - $10 | $10 - $100+ | Cost includes ECM matrices, specialized plates, growth factors for 3D. |
| Experimental Timeline | Days 1-7 | Days 7-28 | 3D models require extended time for maturation and ECM deposition. |
| Oxygen Gradient Depth | N/A (uniform) | 50-200 μm | Measured via fluorescent probes (e.g., Image-iT Hypoxia Reagent). Central hypoxia common in >500 μm spheroids. |
| Proliferation Gradient | Uniform | 3-5 fold difference (core vs. surface) | Quantified by Ki67/EdU staining intensity profile. |
| Drug Penetration Rate | Immediate (minutes) | Slow (hours-days) | Measured via fluorescent drug analogs (e.g., Doxorubicin-FITC). IC50 often 10-1000x higher in 3D. |
| Gene Expression Concordance with Human Tissue | 20-40% | 60-80% | Based on transcriptomic studies (RNA-Seq) comparing models to primary tissue. |
| Intra-model Variability (Coefficient of Variation) | 5-15% | 15-35% | Higher in 3D due to heterogeneity in size, structure, and necrosis. |
Detailed Experimental Protocols
Protocol: High-Throughput 3D Spheroid Formation for Drug Screening (Liquid Overlay Method)
Objective: Generate uniform, reproducible spheroids in a 96- or 384-well format for compound screening. Key Reagents & Materials: See "The Scientist's Toolkit" (Section 6). Procedure:
- Plate Coating: Dispense 50 μL (96-well) or 20 μL (384-well) of sterile 1.5% agarose in PBS or complete media into each well. Allow to solidify at room temperature for 30 minutes under sterile conditions.
- Cell Seeding: Prepare a single-cell suspension of your target cell line (e.g., HCT-116 colon carcinoma) in complete medium at 2x the desired final seeding density. For a final density of 1000 cells/well in 100 μL (96-well), prepare a suspension at 2000 cells/50 μL.
- Seed Cells: Carefully pipette 50 μL of cell suspension into each agarose-coated well. The agarose prevents cell adhesion, forcing cells to aggregate.
- Initial Aggregation: Centrifuge plates at 200 x g for 3 minutes to gently pellet cells into a single focal point at the well bottom.
- Incubation: Place plates in a humidified incubator (37°C, 5% CO2). Spheroids will form within 24-72 hours.
- Drug Treatment: After spheroid formation (typically day 3-5), add 50 μL of 3x concentrated drug solution in medium to each well, resulting in a final volume of 150 μL and 1x drug concentration. Include DMSO vehicle controls.
- Endpoint Analysis: At designated times (e.g., 72h or 120h post-treatment), assess viability using assays like CellTiter-Glo 3D (see Protocol 3.3).
Protocol: Assessing Physiological Complexity via Immunofluorescence of 3D Models
Objective: Visualize and quantify spatial heterogeneity (proliferation, hypoxia, differentiation) within 3D structures. Procedure:
- Fixation: Aspirate medium from spheroids/organoids. Add 100 μL of 4% paraformaldehyde (PFA) in PBS. Fix for 45-60 minutes at room temperature.
- Permeabilization and Blocking: Remove PFA, wash 3x with PBS. Permeabilize and block with 100 μL of blocking buffer (PBS + 0.5% Triton X-100 + 5% normal goat serum) for 2 hours at RT or overnight at 4°C.
- Primary Antibody Staining: Prepare primary antibodies (e.g., anti-Ki67 for proliferation, anti-HIF-1α for hypoxia) in blocking buffer. Incubate spheroids with 50-100 μL of antibody solution for 24-48 hours at 4°C with gentle agitation.
- Washing: Wash 5x over 24 hours with PBS + 0.1% Tween-20 (PBST) to ensure complete penetration of wash buffer.
- Secondary Antibody and Nuclear Staining: Incubate with fluorophore-conjugated secondary antibodies and nuclear stain (e.g., DAPI, 1 μg/mL) in blocking buffer for 24 hours at 4°C, protected from light.
- Mounting and Imaging: Carefully transfer individual spheroids to a glass-bottom imaging dish using a wide-bore pipette tip. Mount in a clearing/compatible mounting medium (e.g., ProLong Glass). Image using a confocal or two-photon microscope, acquiring z-stacks at optimal intervals (e.g., 2-5 μm slices).
Protocol: Quantifying Drug Response in 3D Cultures using ATP-based Viability Assays
Objective: Obtain a quantitative, high-throughput viability readout for drug-treated 3D models. Procedure:
- Equilibration: Remove the 96-well plate containing treated spheroids from the incubator and allow it to equilibrate to room temperature for 30 minutes.
- Reagent Addition: Add an equal volume of CellTiter-Glo 3D Reagent to the volume of medium present in each well (e.g., add 100 μL reagent to 100 μL medium). The reagent contains a lytic agent to disrupt cells and release ATP, plus the luciferase substrate.
- Orbital Shaking: Place the plate on an orbital shaker (500 rpm) for 5 minutes to induce spheroid lysis and mixing.
- Incubation: Incubate the plate at room temperature for 25 minutes to stabilize the luminescent signal.
- Measurement: Record luminescence using a plate reader. The signal is proportional to the amount of ATP present, which is directly proportional to the number of viable cells.
- Data Normalization: Normalize raw luminescence values of treated wells to the average of vehicle control wells (set to 100% viability). Calculate dose-response curves and IC50 values using non-linear regression software (e.g., GraphPad Prism).
Signaling Pathway & Microenvironment Visualization
The following diagrams illustrate key physiological differences between 2D and 3D microenvironments that impact drug response.
Diagram 1: Microenvironmental Differences in 2D vs 3D Cultures (100 chars)
Diagram 2: Drug Penetration Challenge in 3D Models (99 chars)
Experimental Workflow for Model Comparison
Diagram 3: Decision Workflow for 2D vs 3D Screening (100 chars)
The Scientist's Toolkit: Key Research Reagent Solutions
Table 2: Essential Materials for 3D Cell Culture and Analysis
| Item | Function & Description | Example Product/Brand |
|---|---|---|
| Basement Membrane Matrix | Provides a biologically relevant, laminin-rich 3D scaffold for organoid growth and differentiation. | Corning Matrigel, Cultrex BME |
| Ultra-Low Attachment (ULA) Plates | Physically or chemically treated surfaces to inhibit cell adhesion, promoting cell aggregation into spheroids. | Corning Spheroid Microplates, Nunclon Sphera |
| Synthetic Hydrogels | Defined, tunable polymers (e.g., PEG) that provide mechanical and biochemical control over the 3D microenvironment. | PEG-based kits (e.g., Cellendes), Alvetex Scaffold |
| CellTiter-Glo 3D | Optimized luminescent ATP assay for viability measurement in 3D structures; includes stronger lytic agents. | Promega, Cat# G9683 |
| Live-Cell Imaging Dyes (Hypoxia, Viability) | Fluorescent probes to monitor oxygen levels (Image-iT Red Hypoxia Reagent) or live/dead status (Calcein AM/Propidium Iodide) in real-time. | Thermo Fisher Scientific |
| Automated Confocal Imagers | High-content screening microscopes with optical sectioning capability for 3D model analysis. | PerkinElmer Operetta CLS, Molecular Devices ImageXpress Confocal HT. |
| Tissue Clearing Reagents | Chemicals that render 3D samples optically transparent for deep imaging (e.g., CUBIC, ScaleS). | Miltenyi Biotec MACS Tissue Storage Solution, commercially available kits. |
| Organoid Culture Media Kits | Specialized, often serum-free media formulations containing essential niche factors for specific organoid types (intestinal, cerebral, etc.). | STEMCELL Technologies IntestiCult, Thermo Fisher Gibco PSC-Derived Organoid kits. |
No single model is universally superior. The future of efficient and predictive drug screening lies in strategic, sequential integration. A proposed pipeline begins with high-throughput primary screening in 2D models to rapidly eliminate inactive compounds and identify promising hits. These hits are then advanced to secondary screening in high-fidelity 3D models (patient-derived organoids, co-culture spheroids) to evaluate efficacy in a physiologically relevant context, assess penetration, and identify microenvironment-driven resistance mechanisms. This tiered approach maximizes throughput where possible and reserves high-complexity, high-relevance models for the most promising candidates, ultimately improving the predictive power of preclinical studies and reducing costly late-stage attrition.
Within the ongoing debate on 2D vs. 3D cell culture models for drug screening, a binary "versus" mentality is counterproductive. The core thesis is that the optimal strategy lies not in choosing one model over the other, but in leveraging their complementary strengths through an integrated, sequential workflow. 2D models offer unparalleled throughput, simplicity, and cost-effectiveness for initial high-content screening and mechanistic studies. 3D models—including spheroids, organoids, and organs-on-chips—provide superior pathophysiological relevance, capturing critical features like cell-cell/matrix interactions, nutrient/oxygen gradients, and drug penetration barriers. This whitepaper outlines a technical framework for the sequential and complementary integration of these platforms to enhance the predictive power and efficiency of the drug discovery pipeline.
Strategic Frameworks for Integration
Two primary operational frameworks guide integration:
- Sequential Triage: A high-to-low throughput cascade where 2D models (e.g., immortalized cell lines in monolayer) perform initial large-scale compound library screening. Hits are then prioritized and validated in more physiologically relevant 3D models (e.g., patient-derived organoids) to filter out false positives and assess efficacy in a tissue-like context.
- Complementary Mechanistic Analysis: A parallel, hypothesis-driven approach where 3D models identify complex phenotypic responses (e.g., lack of drug penetration, emergence of resistance). Follow-up mechanistic investigations are conducted in 2D models to enable precise genetic manipulation, high-resolution live imaging, and omics analyses that are technically challenging in 3D systems.
Quantitative Comparison of Model Attributes
Table 1: Comparative Analysis of 2D and 3D Model Attributes for Drug Screening
| Attribute | 2D Monolayer Models | 3D Models (Spheroids/Organoids) |
|---|---|---|
| Physiological Relevance | Low; lacks tissue architecture, gradients, and native ECM. | High; recapitulates tissue organization, signaling, and microenvironment. |
| Throughput | Very High (96-1536 well plates). Amenable to full automation. | Moderate to Low (96-384 well plates). Automation is possible but more complex. |
| Cost per Assay | Low ($0.10 - $5) | High ($10 - $500+, depends on model) |
| Assay Standardization | High; uniform culture conditions. | Moderate; heterogeneity is inherent and must be managed. |
| Drug Response Metrics | IC50, cell viability, target modulation. | IC50, growth inhibition, viability core vs. rim, invasion metrics. |
| Key Application | Target validation, primary HTS, mechanistic studies. | Secondary validation, efficacy & penetration studies, toxicity prediction. |
Table 2: Experimental Data from a Sequential Screening Workflow (Hypothetical Case Study: Oncology)
| Screening Stage | Model Used | # Compounds Tested | Hit Rate | Key Metric | False Positive Rate Reduction |
|---|---|---|---|---|---|
| Primary Screen | 2D (Cell Line Monolayer) | 10,000 | 2.5% (250 hits) | Cell Viability (ATP assay) | Baseline |
| Secondary Validation | 3D (Cell Line Spheroids) | 250 | 0.8% (20 hits) | Spheroid Growth Inhibition | 92% (from 250 to 20) |
| Tertiary Validation | 3D (PDX-derived Organoids) | 20 | 0.2% (2 leads) | Organoid Viability & Morphology | 90% (from 20 to 2) |
Detailed Experimental Protocols
Protocol 1: Primary High-Throughput Screen in 2D
- Objective: Identify compounds inducing cytotoxicity in target cancer cell line.
- Method:
- Seed cells (e.g., HCT-116 colorectal carcinoma) in 384-well plates at 2,000 cells/well in 50 µL complete medium.
- Incubate for 24 hrs for adherence.
- Pin-transfer compounds from library (nL volumes) to achieve final concentration range (e.g., 1 nM – 10 µM). Include DMSO controls.
- Incubate for 72 hours.
- Add 20 µL CellTiter-Glo 2.0 reagent, shake for 2 mins, incubate for 10 mins in dark.
- Measure luminescence. Calculate % viability relative to DMSO control.
- Hit Criteria: >70% inhibition at 10 µM.
Protocol 2: Secondary Validation in 3D Spheroids
- Objective: Confirm 2D hits in a 3D context with a penetration barrier.
- Method:
- Spheroid Formation: Seed HCT-116 cells in ultra-low attachment (ULA) 96-well round-bottom plates at 1,000 cells/well in 100 µL medium. Centrifuge plates at 300 x g for 3 mins. Incubate for 72 hrs to form compact spheroids.
- Drug Treatment: Add 100 µL of medium containing 2x concentration of each hit compound (from Protocol 1). Final concentration = 10 µM. Include controls.
- Incubation: Incubate for 96-120 hrs, refreshing medium/drug at 48 hrs.
- Analysis:
- Brightfield Imaging: Daily imaging to monitor growth (diameter measurement).
- Viability Assay: Add 50 µL of CellTiter-Glo 3D reagent, shake, lyse for 30 mins, measure luminescence.
- Viability/Death Staining: Use Calcein-AM (green, live) and Propidium Iodide (red, dead) for confocal imaging to assess necrotic core formation and penetration.
Protocol 3: Mechanistic Follow-up in 2D
- Objective: Elucidate mechanism of action for a compound active in 3D.
- Method (Apoptosis & Pathway Analysis):
- Seed cells in 6-well plates or imaging chambers.
- Treat with compound at IC50 (determined from Protocol 2) for 6, 24, and 48 hrs.
- Western Blot: Harvest lysates, probe for cleaved Caspase-3, PARP, and key pathway phospho-proteins (e.g., p-AKT, p-ERK).
- High-Content Imaging: Fix, stain for Annexin V (apoptosis), DAPI (nuclei), and a cytoskeletal marker. Use automated imaging to quantify apoptotic index and morphological changes.
Diagrammatic Workflows and Pathways
Title: Integrated Drug Screening & Analysis Workflow
Title: Drug Response Pathways in 2D vs. 3D Context
The Scientist's Toolkit: Essential Research Reagents & Materials
Table 3: Key Reagent Solutions for Integrated 2D/3D Workflows
| Reagent/Material | Category | Primary Function in Workflow |
|---|---|---|
| Ultra-Low Attachment (ULA) Plates (e.g., Corning Spheroid Microplates) | 3D Cultureware | Promotes the formation of single, centered spheroids via forced aggregation in round-bottom wells. Critical for assay standardization. |
| Basement Membrane Extract (BME/Matrigel) | Extracellular Matrix | Provides a physiological 3D scaffold for organoid culture, enabling polarized growth and stem cell maintenance. |
| CellTiter-Glo 2.0/3D | Viability Assay | ATP-based luminescent assays. The 3D version contains reagents optimized for cell lysis and signal penetration in larger tissue masses. |
| Calcein-AM & Propidium Iodide (PI) | Live/Dead Stain | Fluorescent dyes for assessing viability and necrotic core formation in 3D models via confocal microscopy. Calcein-AM (live, green), PI (dead, red). |
| Annexin V Apoptosis Detection Kits | Apoptosis Assay | Detects phosphatidylserine exposure on the outer leaflet of the plasma membrane, a key early apoptotic marker. Used in mechanistic 2D follow-up. |
| ROCK Inhibitor (Y-27632) | Small Molecule Inhibitor | Enhances viability of dissociated single cells, particularly primary and stem cells, during the seeding phase for both 2D and 3D assays. |
| Tissue Dissociation Enzymes (e.g., Liberase, TrypLE) | Enzymatic Mix | Gentle dissociation of 3D spheroids or organoids into single-cell suspensions for downstream flow cytometry or sub-culturing. |
Conclusion
The choice between 2D and 3D cell culture models is not a binary one but a strategic decision based on the specific research question, stage of drug discovery, and available resources. 2D models remain indispensable for high-throughput primary screens, mechanistic studies, and applications where simplicity and cost are paramount. In contrast, 3D models offer unparalleled physiological relevance for secondary validation, complex disease modeling, and toxicity assessment, bridging the gap between traditional monolayers and in vivo systems. The future of predictive drug screening lies in tiered, fit-for-purpose workflows that intelligently leverage the speed of 2D and the fidelity of 3D. Emerging technologies like organ-on-a-chip and AI-driven image analysis will further blur these lines, creating more sophisticated, human-relevant models that accelerate the translation of promising therapeutics from the lab bench to the clinic.