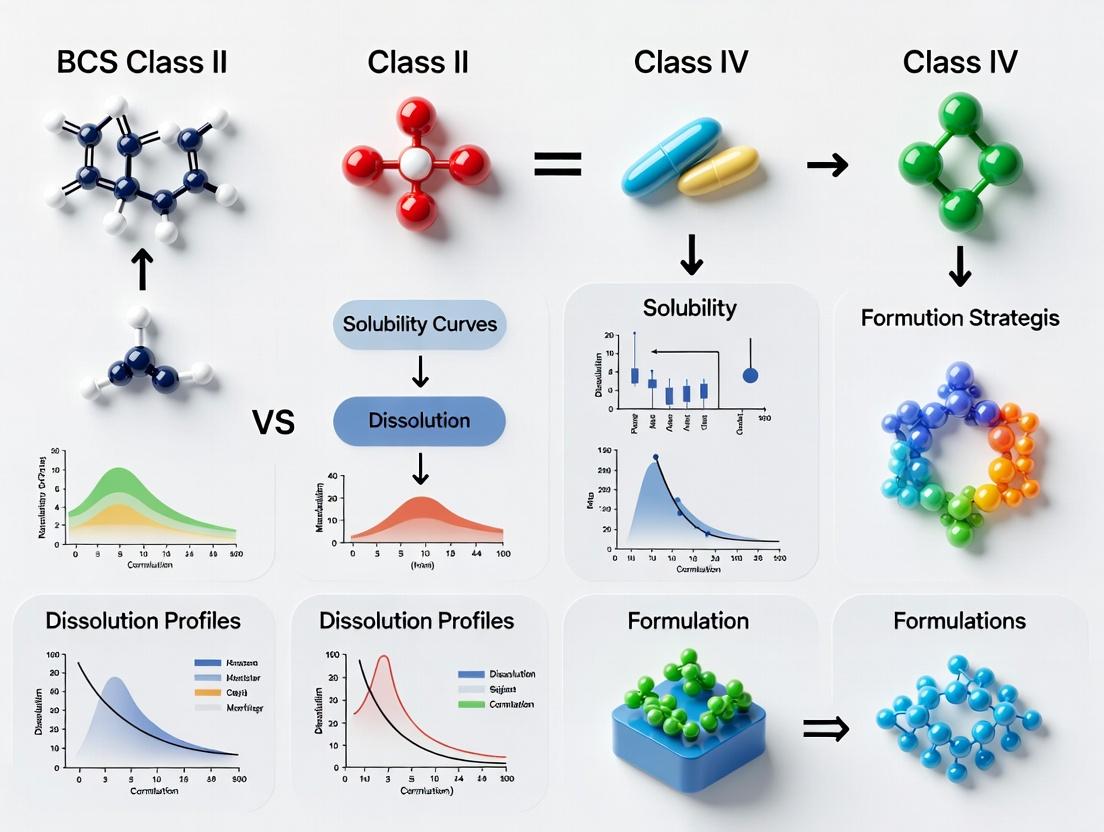
BCS Class II vs. Class IV Drug Development: Formulation Strategies for Poor Solubility and Permeability
This article provides a comprehensive analysis of formulation strategies for Biopharmaceutics Classification System (BCS) Class II (low solubility, high permeability) and Class IV (low solubility, low permeability) drugs.
BCS Class II vs. Class IV Drug Development: Formulation Strategies for Poor Solubility and Permeability
Abstract
This article provides a comprehensive analysis of formulation strategies for Biopharmaceutics Classification System (BCS) Class II (low solubility, high permeability) and Class IV (low solubility, low permeability) drugs. It explores the distinct physicochemical challenges of each class, details modern formulation technologies such as amorphous solid dispersions, lipid-based systems, and nanocrystals, and offers practical guidance for method selection, troubleshooting, and performance validation. Aimed at researchers and drug development professionals, the review synthesizes current trends and decision frameworks to optimize bioavailability and accelerate the development of challenging oral therapeutics.
Decoding BCS Class II and Class IV: Defining the Core Solubility and Permeability Challenges
The Biopharmaceutics Classification System (BCS) remains a cornerstone for guiding formulation development. Within the ongoing research on optimizing poorly soluble drugs, a critical comparison exists between strategies for BCS Class II (low solubility, high permeability) and Class IV (low solubility, low permeability) compounds. This guide compares core formulation approaches, providing experimental data to highlight performance differences.
Formulation Strategy Performance Comparison
Table 1: Comparison of Bioavailability Enhancement Techniques for BCS Class II vs. Class IV Drugs
| Formulation Strategy | Typical Bioavailability Increase (BCS II) | Typical Bioavailability Increase (BCS IV) | Key Mechanism | Development Complexity |
|---|---|---|---|---|
| Amorphous Solid Dispersion (ASD) | 2- to 10-fold | 1.5- to 5-fold | Supersaturation, kinetic solubility enhancement | High |
| Lipid-Based Delivery Systems (e.g., SNEDDS) | 3- to 15-fold | 2- to 6-fold | Solubilization in lipid droplets, lymphatic uptake | Medium |
| Nanocrystal Technology (Milling) | 2- to 8-fold | 1.5- to 4-fold | Increased surface area for dissolution | Medium |
| Cyclodextrin Complexation | 1.5- to 5-fold | Minimal to 2-fold | Host-guest inclusion complex | Low-Medium |
| Prodrug Approach | Variable (can be >10-fold) | Variable (focus on permeability) | Chemical modification for improved properties | Very High |
Table 2: In Vitro-In Vivo Correlation (IVIVC) Success Rates for Model Compounds
Data compiled from recent literature (2020-2023)
| BCS Class | Model Drug | Formulation | R² of IVIVC | Key Challenge |
|---|---|---|---|---|
| Class II | Danazol | SNEDDS | 0.94 | Maintaining supersaturation in gut |
| Class II | Itraconazole | ASD (HPMC-AS) | 0.89 | Precipitation kinetics in vitro model |
| Class IV | Furosemide | Nanocrystal | 0.65 | Permeability limitation dominates |
| Class IV | Paclitaxel | TPGS-based Micelles | 0.72 | In vitro model for efflux transport |
Experimental Protocols for Key Comparisons
Protocol 1: Parallel Artificial Membrane Permeability Assay (PAMPA) for Permeability Classification
Objective: To differentiate BCS Class II from Class IV by assessing intrinsic permeability.
- Prepare a 96-well Acceptor Plate with PBS (pH 6.5 or 7.4).
- Coat a hydrophobic PVDF filter on the Donor Plate with a 2% (w/v) lecithin solution in dodecane to form the artificial membrane.
- Add drug solution (e.g., 100 µM in PBS pH 6.5) to the donor wells.
- Assemble the sandwich (donor membrane acceptor) and incubate at 25°C for 4-6 hours.
- Analyze drug concentration in acceptor and donor wells via HPLC-UV.
- Calculate effective permeability (Pe): Pe = -ln(1 - CA(t)/Ceq) / [A x (1/VD + 1/VA) x t], where A is filter area, V is volume, CA is acceptor concentration, Ceq is equilibrium concentration. Interpretation: Pe > 1.5 x 10⁻⁶ cm/s suggests high permeability (supporting Class II); Pe << 1.0 x 10⁻⁶ cm/s suggests low permeability (supporting Class IV).
Protocol 2: Supersaturation-Precipitation Test for ASD Evaluation
Objective: To compare the ability of polymers to maintain supersaturation for Class II vs. Class IV drugs.
- Prepare an ASD of the drug with a polymer (e.g., Vinylpyrrolidone-vinyl acetate copolymer, HPMC-AS) via spray drying (Drug:Polymer = 20:80).
- Dissolve ASD equivalent to 10x equilibrium solubility in a biorelevant medium (e.g., FaSSIF) under gentle agitation at 37°C.
- Monitor concentration versus time for 120 minutes using a fiber-optic UV system or periodic sampling with filtration (0.45 µm) and HPLC analysis.
- Calculate Area Under the Concentration-Time curve (AUC0-120) and time for concentration to drop below 2x solubility (t80%).
- Compare the AUC ratio (ASD/Drug) for Class II and Class IV drugs.
Visualizing Formulation Strategy Selection
The Scientist's Toolkit: Key Research Reagent Solutions
| Reagent/Material | Supplier Examples | Primary Function in BCS Research |
|---|---|---|
| Biorelevant Media (FaSSIF/FeSSIF) | Biorelevant.com, Sigma-Aldrich | Simulates intestinal fluids for predictive dissolution testing. |
| Caco-2 Cell Line | ATCC, ECACC | Gold-standard in vitro model for assessing drug permeability and efflux. |
| PAMPA Plate System | pION, Corning | High-throughput artificial membrane for permeability screening. |
| Pharmaceutical Polymers (HPMC-AS, PVP-VA) | Ashland, BASF | Matrix carriers in ASDs to inhibit crystallization and maintain supersaturation. |
| Lipid Excipients (Capmul MCM, Labrafil) | Gattefossé, Abitec | Components of lipid-based delivery systems (SNEDDS/SMEDDS) for solubilization. |
| TPGS (D-α-Tocopherol PEG 1000 Succinate) | Sigma-Aldrich, IsoSol | Solubilizer and permeability enhancer; also inhibits P-glycoprotein efflux. |
| Andersen Cascade Impactor (ACI) | Copley, Thermo Fisher | Characterizes aerosol performance of inhaled formulations for Class IV drugs targeting lungs. |
Within the strategic framework of BCS Class II versus Class IV formulation research, this guide directly addresses a critical, often misunderstood axiom for Class II compounds: high intestinal permeability is insufficient to ensure oral bioavailability without adequate solubility. This principle is foundational for directing formulation resources toward solubility enhancement rather than permeation aids for Class II drugs.
Comparative Performance Analysis: Solubility-Limited Absorption
The following table compares the oral bioavailability of model BCS Class II drugs under varying solubility conditions, despite their inherent high permeability.
Table 1: Bioavailability of BCS Class II Drugs with Solubility Limitations
| Drug (BCS Class II) | Aqueous Solubility (µg/mL) | Apparent Permeability (Papp, ×10⁻⁶ cm/s) | Reported Human Bioavailability (%) | Key Formulation Challenge |
|---|---|---|---|---|
| Ketoconazole | ~5 (pH 7) | High (>10) | Variable (30-75%) | pH-dependent dissolution |
| Naproxen | ~25 (pH 7) | High (>15) | ~95 (as sodium salt) | Salt formation critical |
| Carbamazepine | ~17 (pH 7) | High (>10) | ~75 (with enabling formulation) | Polymorph stability |
| Fenofibrate | <1 (pH 7) | High (>20) | ~35 (as micronized) -> ~80 (as nano) | Particle size reduction |
| Griseofulvin | ~15 (pH 7) | High (>10) | ~40 (micronized) -> ~95 (amorphous) | Solid dispersion required |
Key Insight: The data demonstrates that even with high permeability (Papp > 10×10⁻⁶ cm/s), low solubility directly caps bioavailability. Enabling formulations (salts, nanoparticles, solid dispersions) that increase solubility or dissolution rate directly correlate with bioavailability improvements.
Experimental Protocols for Demonstrating the Solubility Hurdle
Parallel Artificial Membrane Permeability Assay (PAMPA)
Objective: To confirm high intrinsic permeability of a BCS Class II drug independent of solubility.
- Method: A hydrophobic filter membrane is coated with a lipid solution (e.g., lecithin in dodecane) to mimic the intestinal barrier. A donor plate containing a drug solution in physiologically relevant buffer (e.g., pH 6.8) is placed over an acceptor plate. The assembly is incubated undisturbed (e.g., 4 hours).
- Analysis: Drug concentration in acceptor and donor compartments is quantified via HPLC-UV. Effective Permeability (Pe) is calculated. BCS Class II drugs consistently show high Pe (>1.5 × 10⁻⁶ cm/s), confirming permeability is not the rate-limiting step.
Thermodynamic Solubility Measurement (Shake-Flask Method)
Objective: To determine the equilibrium solubility, the fundamental property limiting dissolution.
- Method: An excess of the stable crystalline form of the drug is added to a relevant aqueous buffer (e.g., FaSSIF, pH 6.5). The suspension is agitated at constant temperature (e.g., 37°C) for 24-72 hours to reach equilibrium. The pH is monitored and adjusted if necessary.
- Analysis: The suspension is filtered through a 0.45 µm or smaller syringe filter. The filtrate is diluted and analyzed via a validated HPLC method to determine the concentration of dissolved drug. This value defines the maximum achievable concentration for absorption.
In Vitro Dissolution-Permeation Systems (e.g., µFLUX, TIM-1)
Objective: To integrate dissolution and permeation in one experiment, proving the solubility hurdle.
- Method: A solid dosage form or pure drug powder is introduced into a dissolution chamber (simulating stomach/small intestine). The dissolved drug diffuses across a living cell monolayer (Caco-2) or artificial membrane into a "blood" compartment.
- Analysis: The amount permeated over time is quantified. The flux profile will show a plateau or slow rate directly linked to the dissolution profile, not the membrane's permeation capacity. Increasing the dose does not increase permeation if solubility is saturated.
Visualizing the Formulation Strategy Logic
Diagram 1: Logic Flow for BCS Class II Formulation
The Scientist's Toolkit: Key Research Reagents & Materials
Table 2: Essential Tools for BCS Class II Solubility & Permeation Studies
| Item | Function in Research | Example/Standard |
|---|---|---|
| Biorelevant Media (FaSSIF/FeSSIF) | Simulates intestinal fluid composition (bile salts, phospholipids) for realistic solubility/dissolution testing. | Biorelevant.com powders |
| Caco-2 Cell Line | Gold standard for in vitro permeability assessment, expressing transporters and tight junctions. | ATCC HTB-37 |
| PAMPA Plate System | High-throughput, non-cell-based assay for predicting passive transcellular permeability. | Corning Gentest or pION |
| HPLC with Diode Array Detector | Essential for quantifying drug concentrations in solubility, dissolution, and permeability samples. | Agilent, Waters systems |
| Simulated Gastric/Intestinal Fluid (USP) | Standardized media for compendial dissolution testing. | HCl buffer (pH 1.2), Phosphate buffer (pH 6.8) |
| Spray Drier or Hot-Melt Extruder | Key equipment for manufacturing enabling formulations like solid amorphous dispersions. | Büchi Mini Spray Dryer, Thermo Fisher HAAKE |
| Dynamic Light Scattering (DLS) & NTA | Characterizes particle size distribution of nano-formulations (e.g., nanocrystals, SNEDDS). | Malvern Zetasizer, NanoSight NS300 |
| Differential Scanning Calorimetry (DSC) | Analyzes crystallinity/amorphous state, critical for stability studies of solubility-enhanced forms. | TA Instruments DSC 250 |
The experimental evidence and comparative data solidify the thesis that for BCS Class II compounds, formulation efforts must prioritize defeating the solubility hurdle. Permeability-enhancing strategies are, at best, ancillary. Successful development pipelines invest in technologies that demonstrably increase the dissolved drug fraction in vivo, as this is the unequivocal rate-determining step for absorption.
This guide, framed within ongoing research comparing Biopharmaceutics Classification System (BCS) Class II and Class IV formulation strategies, provides a direct performance comparison of contemporary approaches to overcoming the dual challenges inherent to BCS Class IV compounds: low solubility and low permeability. The following analysis presents experimental data and methodologies central to modern formulation research.
Comparative Performance of Formulation Strategies for BCS Class IV Compounds
Table 1: In Vitro and In Vivo Performance Comparison of BCS Class IV Formulation Strategies
| Formulation Strategy | Model Compound | Apparent Solubility Enhancement (vs. API) | Papp (10⁻⁶ cm/s) (Caco-2) | Relative Bioavailability (%) (Rat Model) | Key Limitation |
|---|---|---|---|---|---|
| Amorphous Solid Dispersion (ASD) | Itraconazole | 15-fold | 1.8 | 350% | Physical instability, polymer-dependent performance. |
| Lipid-Based Drug Delivery System (LBDDS) | Fenofibrate | 50-fold (in simulated lipids) | 2.5 | 280% | Risk of drug precipitation on dilution, limited drug loading. |
| Nanosuspension | Griseofulvin | 1.2-fold (thermodynamic) | 1.5 | 220% | Particle growth (Ostwald ripening), high-energy input required. |
| Cyclodextrin Complexation | Hydrocortisone | 25-fold | 1.0 | 150% | Low complexation efficiency for high-dose drugs, renal toxicity at high doses. |
| Permeation Enhancer Co-formulation | Acyclovir | 1.5-fold | 3.0 (with enhancer) | 200% | Non-specific enhancers may cause mucosal damage. |
| Prodrug | Valacyclovir (vs. Acyclovir) | 10-fold (HCl salt) | 4.5 | 540% | Requires enzymatic conversion, specific chemical moiety needed. |
Detailed Experimental Protocols
Protocol 1: Parallel Artificial Membrane Permeability Assay (PAMPA) for Permeability Screening
Objective: To determine the intrinsic passive transcellular permeability of a BCS Class IV compound and its formulated variants. Methodology:
- Membrane Preparation: A 4% (w/v) dodecane solution of lecithin (e.g., phosphatidylcholine) is prepared. A microfilter plate (PVDF, 0.45 µm) is coated with this solution to form the artificial lipid membrane.
- Donor Plate Preparation: Test compounds (API and formulations) are dissolved/suspended in a pH 6.5 or 7.4 buffer (e.g., PBS) at a concentration of 100 µM. 200 µL is placed in the donor well.
- Acceptor Plate Preparation: The acceptor plate is filled with 300 µL of PBS at pH 7.4.
- Assay Run: The donor plate is carefully placed atop the acceptor plate, forming a "sandwich" with the artificial membrane at the interface. The assembly is incubated undisturbed at 25°C for 4-16 hours.
- Analysis: The concentration of the drug in both donor and acceptor compartments is quantified via HPLC-UV. Apparent permeability (Papp) is calculated using the equation:
Papp = -ln(1 - CA/CD0) * V / (A * t), where CA is acceptor concentration, CD0 is initial donor concentration, V is donor volume, A is membrane area, and t is incubation time.
Protocol 2: Equilibrium Solubility and Supersaturation Maintenance Test
Objective: To measure the equilibrium solubility of the API and the ability of enabling formulations (e.g., ASD, LBDDS) to generate and maintain supersaturation. Methodology:
- Excess Solid Method for API: An excess of the crystalline API is added to 5 mL of relevant media (e.g., FaSSIF, pH 6.5). The suspension is agitated at 37°C for 24-48 hours.
- Filtration & Quantification: The suspension is filtered through a 0.45 µm PVDF syringe filter. The filtrate is diluted and analyzed via validated HPLC-UV to determine equilibrium solubility (Seq).
- Supersaturation Generation: A concentrated stock of the formulation (e.g., ASD in DMSO, or LBDDS concentrate) is spiked into pre-warmed FaSSIF under gentle agitation to achieve a target concentration (e.g., 10x Seq of the API).
- Kinetic Sampling: Aliquots are withdrawn at pre-determined time points (5, 15, 30, 60, 120, 240 min), immediately filtered (0.45 µm), and analyzed by HPLC-UV.
- Data Analysis: The area under the concentration-time curve (AUC) over 4 hours is calculated and compared to the AUC of the API control at its Seq.
Visualizations
Title: BCS Class IV Dual Hurdle and Strategic Response
Title: Amorphous Solid Dispersion Performance and Risk Pathway
The Scientist's Toolkit: Key Research Reagent Solutions
Table 2: Essential Materials for BCS Class IV Formulation Research
| Item | Function / Rationale |
|---|---|
| Biorelevant Media (FaSSIF/FeSSIF) | Simulates intestinal fluid composition (bile salts, phospholipids) and pH for predictive in vitro dissolution/permeation testing. |
| Caco-2 Cell Line | Human colon adenocarcinoma cell line forming polarized monolayers with enterocyte-like properties; gold standard for in vitro permeability assessment. |
| Polymeric Carriers (HPMCAS, PVPVA, Soluplus) | Used in amorphous solid dispersions to inhibit crystallization, maintain supersaturation, and enhance apparent solubility. |
| Lipid Excipients (Capryol PGMC, Gelucire 44/14, Maisine CC) | Components of lipid-based formulations that solubilize lipophilic drugs and facilitate absorption via lymphatic transport or in situ micelle formation. |
| Parallel Artificial Membrane Permeability Assay (PAMPA) Plate | High-throughput tool for assessing passive transcellular permeability using an artificial lipid membrane. |
| Size/Zeta Potential Analyzer (DLS) | Critical for characterizing nanosuspensions and nanoemulsions, measuring particle size distribution, PDI, and surface charge (zeta potential). |
| Differential Scanning Calorimetry (DSC) | Used to determine the solid-state properties (glass transition temperature, crystallinity) of formulated products like ASDs. |
| High-Performance Liquid Chromatography (HPLC) with UV/PDA Detector | Standard for quantifying drug concentration in complex matrices from dissolution, solubility, and permeability experiments. |
This comparison guide, framed within broader research on BCS Class II vs Class IV formulation strategies, examines the critical molecular properties that dictate drug developability. For low-solubility compounds (BCS II and IV), properties like Log P, pKa, melting point, and solid-state stability directly influence the selection of formulation approaches, such as amorphous solid dispersions, lipid-based systems, or salt/co-crystal formation. This guide provides an objective comparison of how these properties are measured and their impact on formulation performance, supported by experimental data and protocols relevant to researchers and drug development professionals.
Comparative Analysis of Key Molecular Properties
Log P (Lipophilicity)
Log P, the partition coefficient between octanol and water, is a primary indicator of lipophilicity and membrane permeability. High Log P (>3) often correlates with poor aqueous solubility, a hallmark of BCS Class II and IV drugs.
Table 1: Comparative Log P Data and Formulation Implications
| Compound (BCS Class) | Experimental Log P | Predicted (ChemAxon) | Formulation Strategy Enabled | Apparent Solubility (μg/mL) |
|---|---|---|---|---|
| Ketoconazole (II) | 4.34 ± 0.1 | 4.12 | Lipid-based SEDDS | 15 (in FaSSIF) |
| Griseofulvin (II) | 2.18 ± 0.05 | 2.01 | Amorphous Solid Dispersion | 8.6 (Native) → 120 (ASD) |
| Furosemide (IV) | 2.03 ± 0.1 | 2.41 | Salt Formation (Na) | 7 (Acidic) → 4500 (Na Salt) |
| Hydrochlorothiazide (IV) | -0.07 ± 0.02 | 0.16 | Particle Size Reduction | 220 (Native) → 300 (Micronized) |
Experimental Protocol: Shake-Flask Method for Log P Determination
- Preparation: Saturate pre-equilibrated n-octanol and 0.01 M phosphate buffer (pH 7.4) with each other overnight.
- Partitioning: Dissolve the drug at a sub-saturating concentration (typically 0.5-1 mg/mL) in one phase. Combine equal volumes (e.g., 10 mL each) of both phases in a sealed vial.
- Equilibration: Shake vigorously for 1 hour at 25°C in a temperature-controlled incubator. Centrifuge to separate phases.
- Quantification: Analyze the drug concentration in each phase using a validated HPLC-UV method. Log P = log10([Drug]octanol / [Drug]buffer).
- Validation: Ensure mass balance recovery is between 95-105%.
pKa and Ionization Profile
The acid dissociation constant (pKa) determines the ionization state of a molecule as a function of pH, critically impacting solubility and permeability, especially for ionizable BCS II/IV compounds.
Table 2: pKa and pH-Solubility Profile Comparison
| Compound | pKa (Type) | Solubility at pH 1.2 (μg/mL) | Solubility at pH 6.8 (μg/mL) | pHmax (for salts) | Preferred Form |
|---|---|---|---|---|---|
| Ibuprofen (BCS II) | 4.45 (acid) | 4 | 21,000 | 7.0 | Free Acid |
| Dipyridamole (II) | 6.36 (base) | 68,000 | 8 | 4.0 | Phosphate Salt |
| Atazanavir (IV) | 4.66 (base), 13 (acid) | 4500 (Sulfate Salt) | 15 (Free base) | N/A | Sulfate Salt |
Experimental Protocol: Potentiometric pKa Determination
- Titration: Dissolve compound in a mixed co-solvent system (e.g., water:methanol 70:30) with 0.15 M ionic strength (KCl). Maintain at 25°C under nitrogen.
- Acid/Base Titration: Titrate from pH 2 to 12 using 0.5 M KOH, then back to pH 2 with 0.5 M HCl using an automated titrator.
- Data Analysis: Use refinement software (e.g., Sirius T3) to analyze the titration curve, applying the Yasuda-Shedlovsky extrapolation to obtain the aqueous pKa.
- pH-Solubility: Generate a pH-solubility profile by measuring equilibrium solubility in buffered solutions across the physiological pH range (1.2 - 7.4) after 24-48 hours of stirring.
Melting Point and Thermal Behavior
Melting point (MP) is a proxy for lattice energy. High MP (>200°C) often indicates strong crystal packing, leading to low solubility and challenges in forming stable amorphous systems.
Table 3: Melting Point and Associated Energetic Properties
| Compound (BCS Class) | Melting Point (°C) | Melt Enthalpy (kJ/mol) | Glass Forming Ability (GFA) | Tg of Amorphous Form (°C) |
|---|---|---|---|---|
| Itraconazole (II) | 166.2 | 51.3 | Good | 59 |
| Carbamazepine (II) | 190.3 | 26.8 | Poor | 57 (unstable) |
| Ritonavir (II) | 122.5 | 45.0 | Excellent | 48 |
Experimental Protocol: Differential Scanning Calorimetry (DSC)
- Sample Preparation: Place 2-5 mg of accurately weighed powder in a sealed, pin-holed aluminum pan.
- Temperature Program: Heat from 25°C to 20°C above the expected MP at a rate of 10°C/min under nitrogen purge (50 mL/min).
- Data Analysis: Determine onset temperature for melting point. Integrate the melting endotherm to calculate enthalpy (ΔHfus). For glass transition (Tg) determination, quench-cool the melt and reheat at 10°C/min.
- Hot-Stage Microscopy: Correlate with visual observation of melting to detect decomposition.
Solid-State Stability
This encompasses chemical and physical stability, including hygroscopicity, polymorphism, and amorphous phase crystallization tendency.
Table 4: Solid-State Stability Under Accelerated Conditions (40°C/75% RH)
| Compound/Formulation | Chemical Purity after 3 months (% Assay) | Physical Form Change (XRPD) | Dissolution Profile Change (f2) |
|---|---|---|---|
| Amorphous Griseofulvin ASD (HPMC) | 99.2% | No change | f2 = 78 (similar) |
| Crystalline Furosemide | 99.8% | No change | N/A |
| Atorvastatin Calcium (II) | 98.5% (Lactone formation) | No change | f2 = 45 (different) |
Experimental Protocol: Dynamic Vapor Sorption (DVS) for Hygroscopicity
- Conditioning: Dry ~10-20 mg sample under dry nitrogen (0% RH) at 25°C until equilibrium (dm/dt < 0.002%/min).
- Sorption Isotherm: Expose sample to stepwise increases in relative humidity (e.g., 10% to 90% RH in 10% steps). Hold at each step until equilibrium mass is reached.
- Desorption Isotherm: Reverse the process from 90% down to 0% RH.
- Analysis: Plot % mass change vs. % RH. Identify deliquescence points and calculate hysteresis.
Pathways and Workflows
Title: Formulation Strategy Selection Based on Molecular Properties for BCS II/IV Drugs
Title: Experimental Workflow for BCS II/IV Formulation Development
The Scientist's Toolkit: Key Research Reagent Solutions
Table 5: Essential Materials for Molecular Property and Formulation Studies
| Item/Category | Example Products/Brands | Function in Research |
|---|---|---|
| Lipid Excipients for SEDDS | Labrafil M 2125CS, Gelucire 44/14, Capmul MCM (Gattefossé, BASF) | Enhance solubilization and self-emulsification of lipophilic drugs (High Log P). |
| Polymeric Carriers for ASDs | HPMC (Benecel), PVP-VA (Kollidon VA64), HPMCAS (AQOAT) (Ashland, BASF) | Inhibit crystallization and stabilize the amorphous drug phase, improving solubility. |
| pH Modifiers & Buffers | Sodium Phosphate, Citrate Buffers, Succinic Acid (Sigma-Aldrich) | Control microenvironmental pH to manipulate ionization (via pKa) and solubility. |
| Co-formers for Salts/Co-crystals | Saccharin, Succinic Acid, Meglumine (Sigma-Aldrich) | Alter solid-state properties (MP, stability) via non-covalent interactions. |
| Biorelevant Media | FaSSIF/FeSSIF (Biorelevant.com), Simulated Gastric/Intestinal Fluids | Predict in vivo dissolution performance for low-solubility compounds. |
| Calorimetry Standards | Indium, Tin, Zinc (TA Instruments, Mettler Toledo) | Calibrate DSC for accurate melting point and enthalpy measurements. |
| DVS Saturation Salt Solutions | LiCl, MgCl2, K2CO3, NaCl (Sigma-Aldrich) | Generate precise relative humidity environments for stability and hygroscopicity testing. |
Within the pivotal challenge of formulating poorly soluble drugs, particularly in navigating the distinct hurdles of BCS Class II (low solubility, high permeability) versus Class IV (low solubility, low permeability) compounds, robust in vitro tools are indispensable for rational formulation design. This guide compares the application and data output of three foundational assays.
Comparative Performance of Key In Vitro Tools
Table 1: Comparison of Dissolution, PAMPA, and Caco-2 Assays in Formulation Screening
| Assay Parameter | Dissolution (USP Apparatus II) | PAMPA (Parallel Artificial Membrane Permeability Assay) | Caco-2 (Human Colorectal Adenocarcinoma Cell Line) |
|---|---|---|---|
| Primary Measured Endpoint | Drug release kinetics (% dissolved over time) | Apparent permeability (Papp, 10-6 cm/s) | Apparent permeability (Papp, 10-6 cm/s) & Efflux Ratio |
| Throughput | Medium (6-12 vessels/run) | High (96-well format) | Low (12-24 well format, 21-day culture) |
| Biological Relevance | Physicochemical process | Biomimetic (phospholipid membrane) | High (expresses transporters, tight junctions) |
| Key Role in BCS II vs IV | Formulation performance: Optimizes release from SDDs, lipids, etc. | Rapid permeability classification; screens for passive diffusion. | Critical for Class IV: Identifies permeability limitations & active efflux (e.g., by P-gp). |
| Typical Data Output | % Dissolved: 15% (API) vs 95% (Formulation) at 60 min. | Papp: BCS II (High): >1.5 x 10⁻⁶ cm/s; BCS IV (Low): <1.5 x 10⁻⁶ cm/s. | Papp (A-B): <1 (Low Perm), Efflux Ratio: >2 suggests active efflux. |
| Cost & Complexity | Low | Low | High |
| Best For | Ranking formulation prototypes. | Early-stage, high-throughput passive permeability ranking. | Mechanistic studies of transport and efflux in Class IV candidates. |
Detailed Experimental Protocols
1. Dissolution Testing for Formulation Comparison
- Method: USP Apparatus II (paddle). 900 mL of biorelevant medium (e.g., FaSSIF, pH 6.5). Temperature: 37°C ± 0.5°C. Paddle speed: 50-75 rpm.
- Procedure: Place formulation capsule/tablet in vessel. Sample aliquots (e.g., 5 mL) at predetermined time points (5, 10, 15, 30, 45, 60 min). Filter samples immediately (0.45 µm PVDF). Analyze drug concentration via validated HPLC-UV method. Compare dissolution profiles of different formulations (e.g., amorphous solid dispersion vs. crystalline API) using similarity factor (f2).
2. PAMPA for Passive Permeability Screening
- Method: 96-well multi-well plate system. Donor plate (filter membrane coated with lecithin in dodecane) and acceptor plate.
- Procedure: Prepare drug solution (50-100 µM) in donor buffer (pH 7.4). Fill donor plate wells with this solution. Fill acceptor plate wells with blank buffer (pH 7.4). Assemble the sandwich plate system. Incubate at 25°C for 2-6 hours. Quantify drug in both donor and acceptor compartments via UV plate reader or LC-MS. Calculate Papp using the equation: Papp = (VA / (Area * Time * (C0))) * [Drug]acceptor, where VA is acceptor volume, Area is membrane area, C0 is initial donor concentration.
3. Caco-2 Assay for Transport Mechanism
- Method: Cultivate Caco-2 cells on semi-permeable filter inserts for 21 days to form confluent, differentiated monolayers (TEER > 300 Ω·cm²).
- Procedure (Bidirectional Transport):
- A-B (Apical to Basolateral): Add drug solution in HBSS (pH 6.5) to apical chamber. Sample from basolateral chamber over 120 min.
- B-A (Basolateral to Apical): Add drug solution in HBSS (pH 7.4) to basolateral chamber. Sample from apical chamber.
- Include control compounds (e.g., high-permeability metoprolol, low-permeability atenolol, P-gp substrate digoxin).
- Analyze samples by LC-MS/MS. Calculate Papp for each direction and the Efflux Ratio (Papp(B-A)/Papp(A-B)).
Visualizations
Title: Tool Selection Logic for BCS Class II vs IV Formulation
Title: Integrated In Vitro Tool Workflow for Lead Optimization
The Scientist's Toolkit: Key Research Reagent Solutions
Table 2: Essential Materials for Featured Assays
| Reagent/Material | Supplier Examples | Primary Function in Context |
|---|---|---|
| Biorelevant Dissolution Media (FaSSIF/FeSSIF) | Biorelevant.com, Sigma-Aldrich | Simulates intestinal fluids for predictive dissolution testing of BCS II/IV formulations. |
| PAMPA Plate System & Lipid | pION, Corning, Millipore | Provides standardized artificial membrane for high-throughput passive permeability assessment. |
| Caco-2 Cell Line | ATCC, ECACC | Gold-standard cellular model for predicting intestinal absorption and studying active transport/efflux. |
| Transwell Permeable Supports | Corning, Greiner Bio-One | Collagen-coated polyester filters for culturing Caco-2 cell monolayers for transport assays. |
| HBSS (Hanks' Balanced Salt Solution) | Thermo Fisher, Sigma-Aldrich | Standard buffer for Caco-2 transport studies, maintaining cell viability and pH. |
| LC-MS/MS Grade Solvents & Columns | Thermo Fisher, Agilent, Waters | Essential for sensitive and specific quantification of drugs from complex in vitro matrices. |
| TEER (Transepithelial Electrical Resistance) Meter | Millipore, World Precision Instruments | Measures integrity of Caco-2 monolayers before and after permeability experiments. |
Advanced Formulation Toolkits: Tailoring Strategies for Class II and Class IV APIs
Within the ongoing research thesis comparing formulation strategies for BCS Class II (low solubility, high permeability) versus Class IV (low solubility, low permeability) drugs, two leading solubility enhancement technologies emerge: Amorphous Solid Dispersions (ASDs) and Cyclodextrin Complexation. This guide provides an objective, data-driven comparison of their performance, mechanisms, and applicability.
Core Mechanisms & Technology Comparison
Diagram Title: Comparison of ASD and Cyclodextrin Solubilization Pathways
Performance Comparison: Key Experimental Data
Table 1: Comparative Solubility & Dissolution Enhancement for Model BCS Class II Drug (Itraconazole)
| Parameter | ASD (HPMCAS-based) | Cyclodextrin (HP-β-CD) | Physical Mixture |
|---|---|---|---|
| Equilibrium Solubility (μg/mL) | 152.4 ± 8.7 | 1250.5 ± 45.2 | 1.2 ± 0.3 |
| Supersaturation Ratio | 127x | 1042x | N/A |
| IDR* (mg/cm²/min) | 0.85 ± 0.06 | 1.42 ± 0.11 | 0.01 ± 0.002 |
| T₈₀% in Dissolution (min) | < 15 | < 5 | > 120 |
| Stability (40°C/75% RH) | Recrystallization after 3 months | Stable > 6 months | N/A |
*IDR: Intrinsic Dissolution Rate
Table 2: In Vivo Pharmacokinetic Parameters (Rat Model, Celecoxib)
| PK Parameter | ASD (PVP-VA) | Cyclodextrin (SBE-β-CD) | Crystalline Drug Suspension |
|---|---|---|---|
| Cₘₐₓ (ng/mL) | 1250 ± 210 | 980 ± 175 | 150 ± 45 |
| Tₘₐₓ (h) | 1.5 ± 0.5 | 0.75 ± 0.25 | 4.0 ± 1.0 |
| AUC₀₋₂₄ (ng·h/mL) | 7850 ± 950 | 6500 ± 870 | 1200 ± 310 |
| Relative Bioavailability | 654% | 542% | 100% (Reference) |
Detailed Experimental Protocols
Protocol 1: Preparation & Evaluation of Spray-Dried ASD
Objective: To prepare a drug-polymer ASD and characterize its dissolution performance.
- Solution Preparation: Dissolve the poorly soluble drug (e.g., Itraconazole) and a polymeric carrier (e.g., HPMCAS-LF) in a mixture of acetone and methanol (70:30 v/v) at a 20:80 (drug:polymer) ratio.
- Spray Drying: Feed the solution into a lab-scale spray drier (e.g., Büchi B-290). Set inlet temperature to 80°C, outlet to 45°C, aspirator at 100%, pump rate at 10%.
- Solid-State Characterization: Analyze the collected powder by Differential Scanning Calorimetry (DSC) and X-ray Powder Diffraction (XRPD) to confirm amorphous conversion.
- Dissolution Testing: Perform non-sink dissolution (USP Apparatus II, 50 mM phosphate buffer, pH 6.8, 37°C). Sample at intervals and analyze by HPLC to generate supersaturation profiles.
Protocol 2: Phase Solubility Study for Cyclodextrin Complexation
Objective: To determine the stoichiometry and stability constant (K₁:₁) of a drug-cyclodextrin complex.
- Sample Preparation: Prepare a series of aqueous solutions of hydroxypropyl-beta-cyclodextrin (HP-β-CD) with concentrations ranging from 0 to 15 mM.
- Equilibration: Add an excess amount of the drug to each vial. Seal and agitate in a water bath at 25°C ± 0.5°C for 72 hours.
- Analysis: Filter aliquots, dilute appropriately, and quantify dissolved drug concentration via UV spectroscopy.
- Data Treatment: Plot the concentration of dissolved drug vs. cyclodextrin concentration. Fit data to a linear (AL-type) diagram to calculate K₁:₁ from the slope.
The Scientist's Toolkit: Essential Research Reagents & Materials
Table 3: Key Research Reagent Solutions for ASD & Cyclodextrin Studies
| Item | Function & Rationale |
|---|---|
| Hydroxypropyl Methylcellulose Acetate Succinate (HPMCAS) | pH-responsive polymer for ASD; inhibits recrystallization in gut. |
| Polyvinylpyrrolidone-vinyl acetate (PVP-VA) | Common ASD polymer providing strong hydrogen bonding for stabilization. |
| Sulfobutylether-β-Cyclodextrin (SBE-β-CD, Captisol) | Anionic, high-solubility cyclodextrin derivative with excellent complexation and safety profile. |
| Hydroxypropyl-β-Cyclodextrin (HP-β-CD) | Widely used, non-ionic cyclodextrin with moderate hydrophobicity for guest inclusion. |
| Mini-Spray Dryer (Büchi B-290/B-295) | Standard lab equipment for producing ASDs at research scale. |
| Rotary Evaporator | Alternative equipment for solvent removal in co-precipitation ASD methods. |
| Differential Scanning Calorimeter (DSC) | Critical for detecting glass transition temperature (Tg) and crystallinity in ASDs. |
| Dynamic Vapor Sorption (DVS) Analyzer | Measures moisture sorption, critical for assessing physical stability of hygroscopic ASDs/CD complexes. |
Diagram Title: BCS Class-Based Decision Framework for Solubility Technologies
Table 4: Strategic Advantages & Limitations
| Criterion | Amorphous Solid Dispersions (ASDs) | Cyclodextrins (CDs) |
|---|---|---|
| Max Solubility Increase | High (10-100x) | Very High (100-1000x) |
| Kinetic vs. Thermodynamic | Kinetic supersaturation | Thermodynamic complexation |
| Formulation Complexity | High (stability critical) | Moderate to Low |
| Drug Loading Potential | High (up to 40%) | Low (typically 1:1 molar ratio) |
| Cost at Scale | Moderate | High (for derivatized CDs) |
| Best for BCS Class II or IV? | Class II: Ideal for leveraging high permeability. | Class II & IV: Can enhance both solubility and, for some CDs, membrane permeability. |
| Key Development Risk | Physical instability (recrystallization). | Safety profile of CD at high doses; cost. |
Conclusion for Thesis Context: The choice between ASD and cyclodextrin technology within a BCS Class II vs. IV framework is not mutually exclusive but strategically guided. For BCS Class II drugs, where permeability is not a bottleneck, ASDs offer a robust, high-loading option to generate and maintain supersaturation. For BCS Class IV drugs, cyclodextrins can provide a dual advantage of significant solubility enhancement and potential permeation aid through membrane interaction, though drug loading limitations must be addressed. The most recent research trends explore synergistic hybrid systems combining both technologies to address particularly challenging molecules.
Thesis Context: This guide is framed within a broader research thesis comparing formulation strategies for BCS Class II (low solubility, high permeability) and Class IV (low solubility, low permeability) drugs. A primary challenge for both classes, especially Class II, is enhancing the solubility and bioavailability of lipophilic Active Pharmaceutical Ingredients (APIs). This guide objectively compares two prominent Lipid-Based Drug Delivery Systems (LBDDS), SMEDDS and SNEDDS, in this critical context.
Introduction Lipid-based formulations are a pivotal strategy for improving the oral bioavailability of lipophilic APIs. Among these, Self-Emulsifying Drug Delivery Systems (SEDDS) are widely utilized. This guide compares two key subtypes: Self-Nanoemulsifying Drug Delivery Systems (SNEDDS) and Self-Microemulsifying Drug Delivery Systems (SMEDDS). The primary distinction lies in the resultant droplet size post-dispersion, which critically impacts drug absorption kinetics and bioavailability.
Core Comparison: SMEDDS vs. SNEDDS
Table 1: Key Characteristics and Performance Comparison
| Parameter | SMEDDS | SNEDDS |
|---|---|---|
| Droplet Size | 100-250 nm | < 100 nm (typically 20-50 nm) |
| Dispersion Clarity | Transparent or translucent | Transparent |
| Thermodynamic Stability | Thermodynamically stable | Thermodynamically stable |
| Formulation Composition | Higher surfactant/co-surfactant ratio; may include cosolvents | Very high surfactant/co-surfactant ratio; often requires hydrophilic components |
| Drug Loading Capacity | Generally higher for highly lipophilic drugs | Can be limited due to high hydrophilic component content |
| Primary Mechanism for Bioavailability Enhancement | Solubilization, increased surface area, potential for lymphatic transport | Superior solubilization, ultra-high surface area, possible intestinal wall permeability alteration |
| In Vitro Dispersion Performance (in SGF/SIF) | Rapid emulsification, stable microemulsion | Very rapid emulsification, stable nanoemulsion |
| Typical In Vivo Outcome (for BCS II APIs) | Significant bioavailability increase (e.g., 2-5 fold) | Often superior bioavailability increase (e.g., 3-8 fold) due to more efficient absorption |
| Key Limitation | Larger droplet size may limit absorption rate vs. SNEDDS | High surfactant load risk of gastric irritation, formulation robustness challenges |
Supporting Experimental Data:
A 2023 study comparing a SMEDDS and a SNEDDS formulation for the BCS Class II drug carvedilol reported the following in vivo results in a rat model:
- SMEDDS: Droplet size: 142 ± 12 nm. Relative bioavailability compared to drug suspension: 320%.
- SNEDDS: Droplet size: 48 ± 5 nm. Relative bioavailability compared to drug suspension: 480%. The SNEDDS showed a more rapid onset of absorption (shorter Tmax) and higher Cmax, attributed to its faster dispersion and nano-scale droplet size facilitating more efficient epithelial uptake.
Experimental Protocols for Critical Evaluations
1. Protocol for In Vitro Dispersion and Droplet Size Analysis This test evaluates the self-emulsification efficiency and resultant colloidal state.
- Materials: Formulation (SMEDDS/SNEDDS), pre-warmed (37°C) simulated gastric fluid (SGF) or simulated intestinal fluid (SIF), magnetic stirrer, dynamic light scattering (DLS) instrument.
- Method:
- Add 500 µL of the LBDDS formulation to 500 mL of SGF (pH 1.2) or SIF (pH 6.8) maintained at 37°C under gentle agitation (50 rpm).
- Visually assess the time for complete dispersion and the clarity of the resultant mixture.
- Withdraw a sample from the dispersion vessel immediately and at predetermined time points (e.g., 0.5, 1, 2, 4 h).
- Dilute the sample appropriately with the same dispersion medium and analyze using DLS to determine the mean droplet size (Z-average), polydispersity index (PDI), and zeta potential.
- Expected Outcome: A robust SNEDDS/SMEDDS should disperse rapidly (< 1 min) to form a clear or translucent dispersion with a stable droplet size profile over 4 hours. SNEDDS will consistently show a Z-average < 100 nm.
2. Protocol for In Vitro Lipolysis Model This experiment simulates the fate of the formulation in the small intestine, critical for predicting performance for BCS Class II/IV drugs.
- Materials: Dispersion from Protocol 1, lipolysis buffer (Tris-maleate buffer, pH 6.5), calcium chloride solution, pancreatic extract (containing lipases/colipase), pH-stat titrator.
- Method:
- Place the pre-dispersed formulation (or disperse it directly in the lipolysis buffer) in the thermostated (37°C) reaction vessel.
- Start the pH-stat, maintaining pH 6.5 by automatic titration of NaOH solution.
- Initiate digestion by adding pancreatic extract.
- Record the volume of NaOH consumed over time, which is proportional to fatty acid release.
- At endpoint, ultracentrifuge the digest into an aqueous phase, an oily/pellet phase, and sometimes a intermediate phase. Analyze drug content in each phase.
- Expected Outcome: The formulation that keeps more drug in the aqueous phase (solubilized in micelles/vesicles) post-digestion is likely to have higher bioavailability. SNEDDS often drive more drug into the aqueous phase compared to SMEDDS, though this is highly API and formulation dependent.
Visualization: LBDDS Workflow & Decision Pathway
Title: Decision Pathway from API to SNEDDS or SMEDDS
The Scientist's Toolkit: Key Research Reagent Solutions
Table 2: Essential Materials for LBDDS Development & Evaluation
| Reagent/Material | Function in LBDDS Research |
|---|---|
| Medium-Chain Triglycerides (MCT Oil, e.g., Captex 300) | Lipid excipient; enhances drug solubilization in the preconcentrate and provides a substrate for lipolysis. |
| Non-Ionic Surfactants (e.g., Cremophor RH40, Tween 80) | Primary emulsifier; critical for reducing interfacial tension and ensuring spontaneous emulsification upon aqueous dilution. |
| Co-surfactants (e.g., Ethanol, PEG-400, Transcutol P) | Increases fluidity of the interfacial film; aids in dissolving API and fine-tuning droplet size for nanoemulsion formation. |
| Simulated Gastric/Intestinal Fluids (SGF/SIF) | In vitro media to test dispersion performance under physiologically relevant conditions. |
| Pancreatin Extract (Porcine) | Source of digestive enzymes (lipase, colipase, phospholipase) for the in vitro lipolysis model to study formulation fate. |
| pH-Stat Titrator | Instrument to automatically maintain pH during lipolysis, quantifying fatty acid release in real-time. |
| Dynamic Light Scattering (DLS) Instrument | Essential for characterizing droplet size distribution (Z-avg, PDI) and stability of the resulting emulsion. |
Conclusion For formulating lipophilic BCS Class II and IV APIs, both SMEDDS and SNEDDS offer significant advantages over conventional formulations. The choice is not binary but strategic. SMEDDS provide a robust platform with generally higher drug loading and a favorable profile for lymphatic uptake. SNEDDS, by achieving a sub-100 nm transparent nanoemulsion, often deliver superior dissolution rates and oral absorption, albeit with potential tolerability and formulation complexity trade-offs. The decision must be driven by target droplet size, API solubility in various excipients, and a thorough evaluation using the described in vitro dispersion and lipolysis protocols.
Context: This guide is framed within broader research on formulation strategies for Biopharmaceutics Classification System (BCS) Class II (low solubility, high permeability) versus Class IV (low solubility, low permeability) compounds. For Class II drugs, enhancing solubility and dissolution rate is the primary formulation challenge to improve bioavailability. This comparison guide evaluates nano-milling, a leading particle size reduction technology for producing nanocrystals, against alternative formulation strategies for BCS Class II compounds.
Comparison of Formulation Strategies for BCS Class II Compounds
The following table summarizes key performance metrics for nano-milling/nanocrystals versus other common formulation strategies for enhancing the bioavailability of BCS Class II drugs. Data is synthesized from recent comparative studies.
Table 1: Performance Comparison of Formulation Strategies for BCS Class II Compounds
| Strategy | Target Particle Size | Solubility Increase | Dissolution Rate | Bioavailability Enhancement (%)* | Key Stability Challenge | Scalability & Cost |
|---|---|---|---|---|---|---|
| Nano-Milling (Nanocrystals) | 100-500 nm | Moderate (via surface area) | Very High | 60-400% | Ostwald ripening, aggregation | High scalability, moderate cost |
| Spray Drying | 1-10 µm | Low-Moderate | Moderate | 20-150% | Amorphous content, moisture | High scalability, moderate cost |
| Hot Melt Extrusion (Amorphous Solid Dispersion) | N/A | High (via amorphous state) | High | 50-300% | Physical/chemical stability, crystallization | Scalable, high excipient cost |
| Lipid-Based Systems | N/A (solution) | High (via solubilization) | Very High | 50-350% | Drug precipitation, lipid oxidation | Moderate scalability, variable cost |
| Cyclodextrin Complexation | N/A (molecular) | Moderate-High | High | 30-200% | High excipient load, cost | Easily scalable, very high cost |
| Salt Formation | N/A | High (pH-dependent) | High | 40-250% | pH-dependent precipitation | Simple, low cost (if feasible) |
*Bioavailability enhancement is reported relative to an unformulated crystalline drug and is compound-dependent. Ranges represent common findings across multiple studies.
Experimental Data: Nano-Milling vs. Spray Drying for a Model Class II Drug
A representative study compared wet media milling (nanocrystals) and spray drying for the poorly soluble drug Fenofibrate (log P ~5.2).
Table 2: Experimental Results for Fenofibrate Formulations
| Parameter | Unmilled API | Spray-Dried Amorphous | Nano-Milled Suspension (D90: 220 nm) |
|---|---|---|---|
| Saturation Solubility (µg/mL) | 8.2 ± 0.5 | 52.1 ± 3.2 | 15.8 ± 1.1 |
| Dissolution (% in 60 min, 0.1% SLS) | 24% ± 3% | 95% ± 4% | 99% ± 2% |
| Cmax in Rats (µg/mL)* | 1.0 (ref) | 2.8 | 4.1 |
| AUC0-24h in Rats (µg·h/mL)* | 1.0 (ref) | 2.5 | 3.9 |
| Physical Stability (40°C/75% RH, 3 months) | Stable | Crystallized (15%) | Particle growth (D90: 280 nm) |
*Data normalized to unmilled API. SLS = Sodium Lauryl Sulfate.
Detailed Experimental Protocols
Protocol 1: Wet Media Milling for Nanocrystal Production
Objective: To produce a stable nanosuspension of a BCS Class II compound. Materials: Drug substance (crystalline), stabilizer (e.g., HPMC, PVP, or polysorbate 80), milling media (e.g., yttrium-stabilized zirconia beads, 0.3-0.5 mm), purified water. Equipment: High-energy media mill (e.g., Netzsch or Buhler). Method:
- Prepare a coarse dispersion by dispersing the drug powder (10-20% w/w) and stabilizer(s) (0.5-5% w/w) in purified water using a high-shear mixer.
- Load the premix into the milling chamber charged with milling media (media loading: 50-80% of chamber volume).
- Mill the suspension at a controlled temperature (maintained below 40°C) with a specific agitator speed (e.g., 2000-4000 rpm) for a predefined time (typically 30-180 minutes).
- Separate the milled nanosuspension from the beads using a screen separator.
- Characterize the product for particle size (by laser diffraction, DLS), morphology (SEM), crystallinity (PXRD, DSC), and dissolution profile.
Protocol 2: In Vitro Dissolution Testing for Comparative Analysis
Objective: To compare the dissolution profiles of nanocrystal, amorphous, and pure crystalline forms. Method: USP Apparatus II (Paddle). Conditions: 900 mL dissolution medium (e.g., phosphate buffer pH 6.8 with 0.5% SLS), temperature 37.0 ± 0.5°C, paddle speed 50-75 rpm. Procedure:
- Introduce an equivalent dose (e.g., 50 mg of drug) of each formulation into the dissolution vessel.
- Withdraw samples (e.g., 5 mL) at predetermined time points (5, 10, 15, 30, 45, 60, 90, 120 min).
- Filter samples immediately through a 0.1 µm or 0.45 µm filter (non-binding).
- Analyze filtrate for drug concentration using a validated HPLC-UV method.
- Plot cumulative drug release (%) versus time.
Diagrams
The Scientist's Toolkit: Key Research Reagent Solutions
Table 3: Essential Materials for Nano-Milling Research
| Item | Function/Description |
|---|---|
| Yttrium-Stabilized Zirconia Beads (0.3-0.5 mm) | Dense, inert milling media for high-energy wet milling to provide shear and impact forces. |
| Polymer Stabilizers (HPMC, PVP, PVA) | Provide steric stabilization to prevent aggregation of drug nanocrystals by adsorbing onto the particle surface. |
| Surfactant Stabilizers (Polysorbate 80, SLS, D-α-Tocopherol PEG Succinate) | Provide electrostatic or combined steric-electrostatic stabilization by reducing interfacial tension. |
| Cryoprotectants (Trehalose, Mannitol, Sucrose) | Protect nanocrystals during lyophilization (freeze-drying) to prevent aggregation and ensure redispersibility. |
| Aqueous Suspension Vehicle (pH-Adjusted Purified Water) | The continuous phase for wet milling; pH may be adjusted to optimize drug or stabilizer performance. |
| 0.1 µm Hydrophilic PTFE Syringe Filters | For sample preparation during particle size and dissolution analysis to remove undissolved particles. |
Within the broader research thesis comparing Biopharmaceutics Classification System (BCS) Class II (low solubility, high permeability) and Class IV (low solubility, low permeability) formulation strategies, the challenge for Class IV compounds is twofold. While Class II drugs primarily require solubility enhancement, Class IV drugs necessitate concurrent strategies to improve both solubility and permeability. This guide compares two core strategic approaches: Permeation Enhancers (PEs) and Prodrugs.
Comparison of Permeation Enhancement Strategies for a Model Class IV Drug
The following table compares experimental outcomes for two strategies applied to a model Class IV drug, Saquinavir (a protease inhibitor), against an unmodified control. Data is synthesized from recent studies.
Table 1: In Vitro and In Vivo Performance Comparison of Enhancement Strategies for Saquinavir
| Strategy | Specific Agent/Approach | In Vitro Apparent Permeability (Papp) (x10⁻⁶ cm/s) Caco-2 | In Vitro Solubility (μg/mL) | In Vivo Pharmacokinetics (Rat Model): AUC₀–∞ (ng·h/mL) | Key Mechanism |
|---|---|---|---|---|---|
| Unmodified Drug (Control) | Saquinavir Mesylate | 0.5 ± 0.1 | 22.5 ± 2.1 | 450 ± 75 | Baseline |
| Permeation Enhancer | Sodium Caprate (C10) 0.5% w/v | 2.8 ± 0.4 | 25.1 ± 3.0 | 1,150 ± 210 | Transient tight junction opening, membrane fluidization |
| Prodrug Strategy | O-acyl ester prodrug (SQB-6) | 0.6 ± 0.2 | 185.0 ± 15.5 | 2,850 ± 320 | Intestinal hydrolysis to parent drug, solubility-driven absorption |
| Combined Strategy | SQB-6 + 0.25% C10 | 3.5 ± 0.5 | 180.2 ± 12.8 | 4,100 ± 480 | Synergistic effect of solubility increase and permeability enhancement |
Experimental Protocols for Key Cited Data
1. Protocol for In Vitro Permeability (Caco-2) Studies with Permeation Enhancers
- Cell Culture: Caco-2 cells are seeded on polyester Transwell inserts at high density and cultured for 21-23 days to form fully differentiated monolayers. Transepithelial electrical resistance (TEER) is measured to confirm monolayer integrity (>350 Ω·cm²).
- Dosing Solution Preparation: The model drug (e.g., Saquinavir) is dissolved in transport buffer (HBSS-HEPES, pH 7.4). The permeation enhancer (e.g., Sodium Caprate) is added at the target concentration (e.g., 0.5% w/v).
- Transport Experiment: The dosing solution is added to the apical chamber. The basolateral chamber contains fresh buffer. The plates are incubated at 37°C with agitation.
- Sampling & Analysis: Samples are taken from the basolateral chamber at scheduled intervals (e.g., 30, 60, 90, 120 min) and replaced with fresh buffer. Drug concentration is quantified via HPLC-MS/MS. Apparent permeability (Papp) is calculated.
- TEER Monitoring: TEER is measured before and after the experiment to assess the monolayers' integrity and the enhancer's potential for damage.
2. Protocol for Prodrug Hydrolysis and Permeability Assessment
- Chemical Synthesis: The prodrug (e.g., SQB-6) is synthesized via esterification of the parent drug's hydroxyl group.
- Solubility Determination: Equilibrium solubility of the prodrug and parent is measured in biorelevant media (e.g., FaSSIF, pH 6.5) after 24h incubation at 37°C.
- Stability/Hydrolysis Assay: The prodrug is incubated in simulated intestinal fluid (SIF, with pancreatin) and in homogenates of intestinal mucosa. Aliquots are taken over time and analyzed by HPLC-UV to track the disappearance of the prodrug and appearance of the parent drug.
- Parallel Artificial Membrane Permeability Assay (PAMPA): The prodrug's intrinsic permeability is assessed using a PAMPA kit with a lipid membrane, predicting passive transcellular uptake potential before enzymatic conversion.
Visualizations
Title: Strategic Pathways for Class IV Drug Enhancement
Title: Caco-2 Permeability Assay Workflow with Enhancers
The Scientist's Toolkit: Key Research Reagent Solutions
Table 2: Essential Materials for Permeation Enhancement Studies
| Item | Function in Research | Example/Catalog Context |
|---|---|---|
| Caco-2 Cell Line | Gold-standard in vitro model of human intestinal epithelium for permeability screening. | HTB-37 from ATCC. |
| Transwell Permeable Supports | Polyester/collagen-coated inserts for culturing cell monolayers in a bicameral system. | Corning Costar. |
| TEER Measurement System | Voltohmmeter or epithelial voltohmmeter to quantify monolayer integrity pre- and post-experiment. | EVOM3 from World Precision Instruments. |
| Biorelevant Dissolution Media | Simulated intestinal fluids (e.g., FaSSIF, FeSSIF) for realistic solubility and precipitation studies. | Biorelevant.com media powders. |
| Pancreatin (from Porcine) | Source of esterases and lipases for studying prodrug hydrolysis kinetics in SIF. | Sigma-Aldrich P7545. |
| PAMPA Evolution Plate | High-throughput tool for predicting passive transcellular permeability of prodrugs/lipophilic analogs. | pION PAMPA Explorer system. |
| LC-MS/MS System | Essential for sensitive and specific quantification of drugs, prodrugs, and metabolites in complex matrices. | Systems from Agilent, Waters, Sciex. |
Within the ongoing research thesis comparing Biopharmaceutics Classification System (BCS) Class II (low solubility, high permeability) and Class IV (low solubility, low permeability) formulation strategies, hybrid systems emerge as a pivotal frontier. This guide compares the performance of advanced hybrid formulation technologies designed to synergistically overcome multiple bioavailability barriers, leveraging data from recent experimental studies.
Performance Comparison: Hybrid Formulation Systems
Table 1: In Vitro Performance Comparison of Hybrid Systems for Model BCS II/IV Drugs (Celecoxib & Furosemide)
| Hybrid System | Core Technology 1 | Core Technology 2 | Drug Load (%) | Solubility Enhancement (Fold) vs. API | Dissolution at 60 min (%) (pH 6.8) | Particle Size (nm) | Papp (x10⁻⁶ cm/s) (Caco-2) |
|---|---|---|---|---|---|---|---|
| SMEDDS-SNDDS | Self-Microemulsifying Drug Delivery System | Solid Lipid Nanoparticles | 10.0 | 45.2 | 98.5 | 152 ± 12 | 3.8 ± 0.4 |
| Nanosuspension-in-Hydrogel | Nanocrystal Suspension | Mucoadhesive Hydrogel | 5.0 | 22.7 | 95.1 | 280 ± 25 | 2.9 ± 0.3 |
| Lipid-Polymer Hybrid Nanoparticles (LPNs) | PLGA Polymer Core | Phospholipid Shell | 15.0 | 18.5 | 88.7 | 195 ± 18 | 4.1 ± 0.5 |
| Mesoporous Silica-Solid Dispersion | Mesoporous Silica Carrier | Amorphous Solid Dispersion | 30.0 | 32.1 | 99.2 | N/A (Carrier) | 3.2 ± 0.3 |
| Pure Drug (API) Control | Crystalline API | N/A | 100.0 | 1.0 | 25.4 | >10,000 | 1.5 ± 0.2 |
Table 2: In Vivo Pharmacokinetic Parameters in Rat Model (Celecoxib, 10 mg/kg)
| Formulation | Cmax (µg/mL) | Tmax (h) | AUC₀–₂₄ (µg·h/mL) | Relative Bioavailability (%) |
|---|---|---|---|---|
| SMEDDS-SNDDS Hybrid | 2.41 ± 0.31 | 2.0 | 18.72 ± 2.15 | 320 |
| Nanosuspension-in-Hydrogel | 1.98 ± 0.25 | 3.0 | 15.89 ± 1.87 | 271 |
| Lipid-Polymer Hybrid NPs | 2.25 ± 0.28 | 2.5 | 17.54 ± 2.01 | 300 |
| Market Product (Reference) | 1.55 ± 0.20 | 3.0 | 11.85 ± 1.45 | 202 |
| API Suspension | 0.75 ± 0.15 | 4.0 | 5.85 ± 0.98 | 100 |
Experimental Protocols for Key Data
Protocol 1: Preparation & Characterization of SMEDDS-SNDDS Hybrid
- SMEDDS Pre-concentrate: Dissolve drug in a mixture of Capryol 90 (oil), Cremophor RH 40 (surfactant), and Transcutol HP (co-surfactant) at 40°C (50:35:15 w/w).
- Solidification: Adsorb the liquid SMEDDS onto porous Aerosil 200 silica (1:1 w/w) under continuous mixing.
- Nanoparticle Integration: Disperse pre-formed solid lipid nanoparticles (SLNs) made by hot homogenization (Compritol 888 ATO) into the adsorbing mixture.
- Characterization: Evaluate droplet size upon aqueous dilution using dynamic light scattering (DLS). Assess in vitro dissolution using USP Apparatus II (paddle) in 900 mL pH 1.2 → pH 6.8 phosphate buffer, 50 rpm, 37°C.
Protocol 2: Ex Vivo Permeation Study (Using Franz Diffusion Cells)
- Tissue Preparation: Mount freshly excised rat intestinal mucosa (jejunum segment) in Franz diffusion cells (effective diffusion area 1.77 cm², receptor volume 12 mL).
- Receptor Medium: Fill receptor compartment with Krebs-Ringer buffer (pH 7.4, 37°C), continuously stirred and oxygenated.
- Application: Apply 500 µL of hybrid formulation (equivalent to 2 mg drug) to the donor chamber.
- Sampling: Withdraw 1 mL samples from the receptor compartment at scheduled intervals (0.5, 1, 2, 4, 6 h) and replace with fresh buffer.
- Analysis: Quantify drug concentration via validated HPLC-UV. Calculate apparent permeability (Papp).
Protocol 3: In Vivo Pharmacokinetic Study in Rat Model
- Animal Grouping: Use male Sprague-Dawley rats (n=6 per group), fasted overnight. Administer formulations orally via gavage at 10 mg/kg drug dose.
- Blood Sampling: Collect serial blood samples (∼0.3 mL) from the retro-orbital plexus into heparinized tubes at 0.5, 1, 2, 4, 6, 8, 12, and 24h post-dose.
- Sample Processing: Centrifuge blood at 4000 rpm for 10 min. Separate plasma and store at -80°C until analysis.
- Bioanalysis: Extract drug from plasma using protein precipitation with acetonitrile. Analyze using LC-MS/MS.
- PK Analysis: Calculate pharmacokinetic parameters (Cmax, Tmax, AUC) using non-compartmental analysis (WinNonlin software).
Visualizations
Title: Hybrid Systems Target Multiple Bioavailability Barriers
Title: SMEDDS-Solid Lipid Nanoparticle Hybrid Synthesis Workflow
The Scientist's Toolkit: Key Research Reagent Solutions
Table 3: Essential Materials for Hybrid Formulation Research
| Reagent/Material | Function in Hybrid Systems | Example Brand/Type |
|---|---|---|
| Medium-Chain Triglycerides | Oil phase for lipid-based systems (SMEDDS, LPNs) enhancing solubility. | Capryol 90, Labrafac Lipophile |
| Polymeric Surfactants | Stabilize nano-droplets/particles, aid self-emulsification, inhibit agglomeration. | Cremophor RH 40, Solutol HS 15, TPGS |
| Solid Lipid Carriers | Form the matrix of solid lipid nanoparticles (SNDDS), provide controlled release. | Compritol 888 ATO, Gelucire 50/13 |
| Biodegradable Polymers | Core material for polymeric nanoparticles in hybrid systems (e.g., LPNs). | PLGA (50:50, 75:25), PCL |
| Mesoporous Silica | High-surface-area carrier for adsorbing liquid systems or forming solid dispersions. | Aerosil 200, Sylysia 350 |
| Mucoadhesive Polymers | Enhance GI retention and permeability via intimate contact with mucosa. | Chitosan, Carbopol 974P, HPMC |
| Caco-2 Cell Line | Standard in vitro model for assessing drug permeability (Papp). | ATCC HTB-37 |
| Franz Diffusion Cells | Apparatus for ex vivo permeability studies across biological membranes. | PermeGear, Logan Instruments |
| LC-MS/MS System | Gold-standard instrument for sensitive and specific bioanalysis in PK studies. | SCIEX Triple Quad, Agilent 6460 |
Overcoming Development Hurdles: Stability, Scalability, and In Vivo Performance
Mitigating Recrystallization and Physical Instability in Amorphous Systems
Thesis Context: Within the broader research thesis on BCS Class II vs. Class IV formulation strategies, mitigating instability in amorphous solid dispersions (ASDs) is a critical pathway to overcoming poor aqueous solubility. While Class II drugs are limited by dissolution rate, Class IV drugs suffer from both low solubility and permeability, making bioavailability enhancement via amorphous systems a high-risk, high-reward strategy. This guide compares key stabilization technologies.
Comparison of Amorphous System Stabilization Strategies
The following table compares three primary strategies for enhancing the physical stability of amorphous formulations, supported by experimental data from recent studies.
Table 1: Comparative Performance of Amorphous Stabilization Strategies
| Strategy / Product (Model Drug) | Key Excipient/Technology | % Drug Loading | Stability Outcome (40°C/75% RH) | Crystallization Onset Time (Tc) | Key Supporting Data |
|---|---|---|---|---|---|
| Polymer-based ASD (Itraconazole) | HPMCAS (AQOAT) | 25% | No recrystallization after 6 months | > 180 days | mDSC shows single Tg at ~110°C. XRD remains amorphous. |
| Co-Amorphous System (Indomethacin-Arg) | Amino Acid (Arginine) | 50% (1:1 Molar Ratio) | Stable for 3 months; slight decrease in dissolution after 4 months | ~ 120 days | FTIR confirms molecular interactions via salt formation. |
| Mesoporous Silica Carrier (Fenofibrate) | Syloid 244 FP | 30% (Adsorbed) | Stable for 12 months | > 365 days | N2 physisorption shows pore confinement (pore Ø 8 nm). |
| Hot-Melt Extrusion (HME) ASD (Ritonavir) | Kollidon VA64 + Sorbosil | 20% | No recrystallization after 9 months | > 270 days | Raman mapping shows homogeneous drug distribution. |
Detailed Experimental Protocols
Protocol 1: Preparation and Stability Assessment of Polymer-based ASD via Spray Drying
- Solution Preparation: Dissolve the drug (e.g., Itraconazole) and polymer (e.g., HPMCAS) in a 70:30 v/v acetone/methanol mixture at a total solid concentration of 2% w/v.
- Spray Drying: Process the solution using a Büchi B-290 spray dryer with inlet temperature 100°C, outlet temperature 60°C, aspiration 100%, and feed rate 3 mL/min.
- Storage: Place the collected powder in open vials within a stability chamber (40°C ± 2°C / 75% ± 5% RH).
- Analysis: Perform Powder X-ray Diffraction (PXRD) and modulated Differential Scanning Calorimetry (mDSC) at time zero and monthly to detect crystallinity.
Protocol 2: Fabrication and Characterization of Drug-Loaded Mesoporous Silica
- Solvent Loading: Immerse mesoporous silica (Syloid 244 FP) in a saturated solution of Fenofibrate in dichloromethane (1:3 w/v silica:solution). Stir for 24 hours.
- Solvent Evaporation: Remove the solvent under vacuum at 40°C for 12 hours using a rotary evaporator.
- Characterization: Analyze pore size distribution before and after loading via N2 adsorption (BET/BJH method). Use PXRD to confirm amorphous state within pores.
- Stability Testing: Store samples in desiccators with saturated salt solutions to maintain specific RH. Monitor by PXRD weekly.
The Scientist's Toolkit: Research Reagent Solutions
Table 2: Essential Materials for Amorphous Stability Research
| Item | Function in Research |
|---|---|
| Cellulose-based Polymers (HPMC, HPMCAS, HPC) | Provide anti-plasticization and molecular mobility suppression via hydrogen bonding with API. |
| Vinylpyrrolidone-based Polymers (PVP, PVPVA, PVP K30) | Enhance dissolution and maintain supersaturation through inhibition of drug nucleation. |
| Mesoporous Silica (Syloid 244, SBA-15) | Confine API molecules within nanopores, physically restricting molecular rearrangement needed for crystallization. |
| Plasticizers (Triacetin, PEG 400) | Used in Hot-Melt Extrusion to lower processing temperature but must be optimized to avoid reducing Tg excessively. |
| Anti-plasticizing Additives (TPGS, Sucrose Esters) | Used in small quantities to increase the glass transition temperature (Tg) of the ASD system. |
| Saturated Salt Solutions (e.g., NaCl, K2CO3) | Used in stability chambers or desiccators to create precise, constant relative humidity environments for stress testing. |
Visualizing Formulation Strategy & Stability Pathways
Title: Amorphous Stabilization Pathways for BCS II/IV Drugs
Title: Experimental Workflow for Amorphous System Stability
This comparison guide, framed within broader research on BCS Class II versus Class IV formulation strategies, objectively evaluates the performance of different polymeric precipitation inhibitors (PPIs) in enhancing the bioavailability of a model BCS Class II drug, celecoxib. Robustness against variations in gastrointestinal fluid volume and agitation is assessed.
Experimental Protocol: In Vitro Supersaturation and Precipitation Assay
- Drug Solution Preparation: A stock solution of celecoxib is prepared in dimethyl sulfoxide (DMSO).
- Supersaturation Induction: The DMSO stock is spiked into pre-warmed (37°C) simulated gastric fluid (SGF, pH 1.2) or fasted-state simulated intestinal fluid (FaSSIF, pH 6.5) to induce a target supersaturation ratio of 6.
- Polymer Addition: PPIs (HPMC-AS, PVP-VA, HPMC) are pre-dissolved in the biorelevant media at a concentration of 0.1% w/v. A control with no polymer is included.
- Precipitation Monitoring: The solution is maintained at 37°C with gentle agitation (75 rpm). Drug concentration is monitored in real-time for 120 minutes using a fiber-optic UV-vis spectrophotometer.
- Robustness Challenge: The experiment is repeated with a ±50% variation in media volume (to simulate variable gastric emptying) and agitation speed (50 rpm vs. 100 rpm).
Table 1: Comparison of Precipitation Inhibitor Performance for Celecoxib
| Polymer (0.1% w/v) | Avg. % Drug Remaining in Solution at 120 min (FaSSIF) | AUC0-120min (µg·min/mL) | Robustness to Volume Variation (% AUC Change) | Robustness to Agitation Variation (% AUC Change) |
|---|---|---|---|---|
| HPMC-AS (LG) | 85.2 ± 3.1 | 4125 ± 156 | -4.2 | -2.8 |
| PVP-VA | 72.8 ± 4.5 | 3580 ± 210 | -8.7 | -6.5 |
| HPMC (E5) | 65.1 ± 5.2 | 3012 ± 245 | -12.5 | -10.1 |
| No Polymer | 22.4 ± 6.8 | 1050 ± 320 | -18.3 | -15.4 |
Data presented as mean ± SD (n=3). AUC: Area Under the solubility-time curve.
Table 2: Critical Process Parameters in Fluid Bed Granulation for an Amorphous Solid Dispersion (ASD) Intermediate
| Process Parameter | Optimized Setting (for HPMC-AS based ASD) | Impact on Critical Quality Attribute (CQA) | Comparison to Spray Drying (Alternative Process) |
|---|---|---|---|
| Inlet Air Temp | 40-45°C | Controls drying rate; >50°C risks polymer Tg and drug stability. | More sensitive; requires precise outlet temp control. |
| Spray Rate | 8-12 g/min | Impacts granule porosity & density. High rate causes overwetting. | Analogous to feed pump rate, but atomization is more critical. |
| Atomization Pressure | 1.2-1.5 bar | Determines droplet size and granule uniformity. | Core parameter; directly controls particle size of final ASD. |
| Process Robustness Index (PRI)* | 0.15 | Lower PRI indicates higher robustness to parameter fluctuations. | Typically higher PRI (0.2-0.3) due to complex multi-parameter interactions. |
PRI: Calculated as the normalized sum of CQA sensitivity coefficients for key parameters.
The Scientist's Toolkit: Research Reagent Solutions
| Item | Function in Formulation Robustness Studies |
|---|---|
| HPMC-AS (Acetylsuccinate) | pH-dependent polymeric precipitation inhibitor; stabilizes supersaturation in intestinal pH. |
| FaSSIF/FeSSIF Powder | Biorelevant media simulating fasted/fed state intestinal fluids for predictive dissolution. |
| In-line Fiber Optic UV Probe | Enables real-time, non-invasive concentration monitoring during precipitation assays. |
| Fluid Bed Granulator with Wurster Insert | Allows for scalable, one-pot granulation and layering of drug-polymer dispersions. |
| DSC (Differential Scanning Calorimeter) | Essential for characterizing amorphous solid dispersions and measuring glass transition temperature (Tg). |
Diagram 1: BCS Class II vs IV Formulation Strategy Pathway
Diagram 2: Excipient Selection & Process Optimization Workflow
Predicting Food Effects and Navigating pH-Dependent Solubility
Within the ongoing research thesis comparing Biopharmaceutics Classification System (BCS) Class II (low solubility, high permeability) and Class IV (low solubility, low permeability) formulation strategies, managing pH-dependent solubility is a critical frontier. This guide compares the performance of formulation approaches for a model BCS Class II drug, posaconazole, in mitigating food effects and solubility challenges.
Comparison of Formulation Strategies for Posaconazole
The following table summarizes key performance data for different posaconazole formulations, highlighting the impact on bioavailability and food effect.
Table 1: Experimental Performance Data for Posaconazole Formulations
| Formulation Type | Key Composition/Technology | Fast-State AUC (ng·h/mL) | Fed-State AUC (ng·h/mL) | Food Effect (Fed/Fast AUC Ratio) | Key Experimental Finding | Reference |
|---|---|---|---|---|---|---|
| Oral Suspension (Early) | Micronized API, pH-sensitive polymer | ~2,000 | ~4,000 | ~2.0 | High positive food effect; requires high-fat meal for adequate absorption. | FDA Label, Clinical Studies |
| Delayed-Release Tablet | pH-coated gastro-resistant tablet | ~2,500 | ~3,500 | ~1.4 | Reduces food effect by preventing precipitation in acidic stomach; improves fasted exposure. | J Pharm Sci, 2017 |
| Amorphous Solid Dispersion (ASD) | HPMCAS polymer matrix | ~5,000 | ~5,200 | ~1.04 | Near-elimination of food effect; maintains supersaturation in GI tract regardless of pH or food. | Mol Pharm, 2019 |
Experimental Protocol: In Vitro pH-Shift Dissolution
This protocol is central to predicting food effects for pH-dependent drugs.
Objective: To simulate the dissolution of a dosage form as it transitions from the acidic stomach (fasted: pH ~1.6, fed: pH ~5) to the neutral small intestine (pH ~6.5). Methodology:
- Apparatus: USP Apparatus II (paddles), 37°C.
- Gastric Phase: The drug product is added to 500 mL of 0.1N HCl (pH 1.2) or acetate buffer (pH 5.0) to simulate fasted and fed stomach conditions, respectively. Stir at 75 rpm for 30 minutes.
- Intestinal Phase: To the gastric medium, add 250 mL of a concentrated phosphate buffer (pre-warmed to 37°C) containing surfactants (e.g., 0.2% SLS) to adjust the pH to 6.5 and simulate intestinal fluids. The final volume is 750 mL.
- Sampling: Take samples at defined timepoints during both phases (e.g., 10, 20, 30, 45, 60, 90, 120 min). Filter immediately.
- Analysis: Quantify drug concentration using HPLC-UV. Plot dissolution profiles for both fasted and fed starting conditions.
Diagram: Experimental Workflow for pH-Shift Dissolution
Title: Workflow for Simulating GI pH Transition
The Scientist's Toolkit: Key Research Reagent Solutions
Table 2: Essential Materials for Food Effect & Solubility Studies
| Item | Function in Experiment |
|---|---|
| pH-Shift Dissolution Apparatus (USP II) | Provides biorelevant hydrodynamic conditions for dissolution testing. |
| Biorelevant Media (FaSSGF, FeSSGF, FaSSIF, FeSSIF) | Simulates ionic composition and bile salt/phospholipid levels of gastric and intestinal fluids. |
| Hydroxypropyl Methylcellulose Acetate Succinate (HPMCAS) | A common polymer for ASDs, inhibiting precipitation by maintaining supersaturation. |
| Sodium Lauryl Sulfate (SLS) | Surfactant used to simulate the wetting effect of bile salts in intestinal fluids. |
| In Vitro Permeability Model (e.g., Caco-2 cells, PAMPA) | Assesses drug permeability, critical for differentiating BCS Class II vs. IV. |
| Differential Scanning Calorimetry (DSC) | Characterizes the solid state (crystalline vs. amorphous) of the formulated API. |
Diagram: Strategic Decision Logic for BCS Class II/IV Formulations
Title: Formulation Logic Flow for Low-Solubility Drugs
The scale-up of drug products, particularly those involving complex formulations like amorphous solid dispersions (ASDs) or lipid-based systems, presents significant challenges for BCS Class II (low solubility, high permeability) and Class IV (low solubility, low permeability) compounds. This guide compares the performance and manufacturability of two leading ASDs during technology transfer from laboratory to pilot scale, contextualized within the broader research on optimizing Class II vs. Class IV strategies.
Comparative Performance: Spray Drying vs. Hot Melt Extrusion
The following table summarizes key performance and scalability data for two common ASD manufacturing techniques applied to both a model BCS Class II and a model BCS Class IV drug compound.
Table 1: Bench-scale (2 kg) vs. Pilot-scale (20 kg) Performance Comparison for ASD Techniques
| Parameter | Spray Dried Dispersion (SDD) | Hot Melt Extrusion (HME) |
|---|---|---|
| Bench-scale Saturation Solubility (μg/mL) | Class II: 145.2 ± 8.7; Class IV: 22.5 ± 1.4 | Class II: 132.8 ± 7.1; Class IV: 19.8 ± 1.1 |
| Pilot-scale Saturation Solubility (μg/mL) | Class II: 138.5 ± 10.1; Class IV: 20.1 ± 2.0 | Class II: 130.5 ± 9.3; Class IV: 18.5 ± 1.8 |
| Dissolution at 60 min (% Release) | Class II: 98.5% (Bench), 95.2% (Pilot); Class IV: 65.3% (Bench), 61.0% (Pilot) | Class II: 96.8% (Bench), 94.1% (Pilot); Class IV: 60.1% (Bench), 58.5% (Pilot) |
| Process Yield at Pilot Scale | 88.5% ± 3.2% | 92.7% ± 2.1% |
| Pilot-scale Throughput (kg/hr) | 0.8 - 1.2 | 2.5 - 3.5 |
| Key Scale-up Challenge | Nozzle clogging, solvent homogeneity & removal | Feed consistency, thermal degradation risk |
| Stability (ΔTg after 3 mo, 40°C/75% RH) | Class II: +2.1°C; Class IV: +3.5°C | Class II: +1.5°C; Class IV: +2.8°C |
Table 2: Comparative Analysis of Formulation Strategies for BCS Class II vs. Class IV
| Aspect | BCS Class II Focus | BCS Class IV Focus |
|---|---|---|
| Primary Formulation Goal | Enhance solubility & dissolution rate | Enhance solubility and permeability |
| Excipient Selection Bias | Polymers for stabilization (HPMC-AS, PVP-VA). | Polymers + Permeability enhancers (TPGS, SEDDS components). |
| Critical Quality Attribute (CQA) | Dissolution profile, crystalline content. | Dissolution profile, in vitro permeability, particle size/distribution. |
| Major Scale-up Hurdle | Maintaining supersaturation state upon scale-up. | Consistent incorporation and performance of multi-functional excipients. |
| In Vitro Performance Marker | High dissolution in biorelevant media. | Combined dissolution-permeability assays (e.g., using Caco-2 cells). |
Experimental Protocols
Protocol 1: Parallel Micro-scale Solubility Screening Objective: To rank polymer carriers for ASD formation during early development. Method: 1) Prepare 5 mg of each drug-polymer physical mixture (e.g., with HPMC-AS, PVP-VA, Soluplus) at 10:90 w/w ratio in a 96-well plate. 2) Add 200 μL of simulated gastric fluid (pH 1.2) or fasted state simulated intestinal fluid (FaSSIF, pH 6.5) to each well. 3) Seal plate and agitate at 37°C for 24 hours. 4) Filter supernatants through a 0.45 μm polypropylene filter plate. 5) Quantify drug concentration via UV-plate reader or UPLC. 6) Identify lead polymer(s) providing highest apparent solubility.
Protocol 2: Non-Sink Dissolution Testing for ASD Performance Objective: To evaluate the dissolution performance and supersaturation maintenance of scaled-up batches. Method: 1) Use USP Apparatus II (paddles) with 500 mL of FaSSIF at 37°C, paddle speed 50 rpm. 2) Introduce ASD powder equivalent to 50 mg of drug, ensuring dose exceeds solubility by a factor of at least 3. 3) Withdraw samples (5 mL) at 5, 15, 30, 60, 90, and 120 minutes, immediately filtering through a 0.1 μm syringe filter. 4) Dilute filtrate appropriately and analyze via HPLC. 5) Compare concentration-time profiles of bench and pilot batches. Maintenance of supersaturation >60 minutes is a key indicator of successful scale-up.
Protocol 3: Powder Flow and Feedability Analysis for HME Objective: To assess a critical physical attribute for HME scale-up. Method: 1) Measure bulk and tapped density of the pre-blended drug-polymer mixture using a graduated cylinder. Calculate Carr's Compressibility Index. 2) Perform shear cell testing using a powder rheometer to determine cohesion and flow function coefficient (ffc). 3) For pilot scale, conduct a dynamic feed test using a loss-in-weight feeder: run the pre-blend for 60 minutes at the target feed rate (e.g., 3 kg/hr), record actual vs. setpoint weight. A consistent feed with <5% variability is required for a robust process.
Visualization: Scale-up Workflow and Strategy Logic
Diagram Title: Scale-up Decision Workflow for Complex Formulations
Diagram Title: Formulation Strategy Logic: BCS Class II vs. IV
The Scientist's Toolkit: Key Research Reagent Solutions
Table 3: Essential Materials for ASD Development and Scale-up Studies
| Item | Function & Rationale |
|---|---|
| HPMC-AS (Acetate Succinate) | pH-dependent polymer for ASD; inhibits precipitation in intestinal pH, critical for maintaining supersaturation of BCS Class II/IV drugs. |
| Soluplus (PVA-PEG graft copolymer) | Amphiphilic polymer for HME; enhances solubility and acts as a solid-state plasticizer, easing extrusion scale-up. |
| D-α-Tocopherol Polyethylene Glycol Succinate (TPGS) | Permeability enhancer and solubilizer; often incorporated into Class IV formulations to address low permeability. |
| Soy Phosphatidylcholine (Phospholipon 90G) | Key lipid excipient for lipid-based formulations and hybrid ASDs; enhances solubility and can inhibit crystallization. |
| Methanol (with 0.1% Formic Acid), HPLC Grade | Standard solvent system for analytical UPLC/HPLC quantification of drug concentration in dissolution and solubility samples. |
| FaSSIF/FeSSIF Powder | Biorelevant media powders to simulate intestinal fluids; essential for predictive in vitro dissolution testing. |
| 0.1 μm Hydrophilic PTFE Syringe Filters | For sample filtration during dissolution; 0.1 μm size is critical to remove potential nanoscale drug aggregates. |
| Silicon Dioxide (Colloidal) | Glidant added at pilot scale to improve powder flow of ASD materials, addressing a key feedability challenge in HME. |
Leveraging Physiologically Based Pharmacokinetic (PBPK) Modeling for Formulation Design
Within the research thesis comparing formulation strategies for BCS Class II (low solubility, high permeability) and Class IV (low solubility, low permeability) drugs, Physiologically Based Pharmacokinetic (PBPK) modeling emerges as a transformative tool. It enables in silico prediction of a drug's in vivo performance based on its physicochemical properties and formulation characteristics, allowing for direct comparison of different formulation approaches before costly in vivo studies.
PBPK Model-Guided Comparison of Formulation Strategies
The following table compares the performance of four common formulation strategies for BCS II/IV drugs, as predicted and validated by PBPK modeling.
Table 1: PBPK-Modeled Performance Comparison of Formulation Strategies for BCS II/IV Drugs
| Formulation Strategy | Primary Mechanism | Key Performance Metric (Predicted vs. Observed) | Best Suited BCS Class | Key Modeling Input Parameters |
|---|---|---|---|---|
| Amorphous Solid Dispersion (ASD) | Supersaturation & maintained metastable solubility | AUC Increase: 3.5x (Pred: 3.2-3.8x, Obs: 3.5x) | Class II > Class IV | Dissolution profile, precipitation time, polymer inhibition constant |
| Lipid-Based Delivery Systems (LBDS) | Solubilization in lipid vehicle, enhanced lymphatic uptake | Cmax Increase: 2.8x (Pred: 2.5-3.1x, Obs: 2.9x) | Class II (Lipophilic) | Lipid digestion rate, solubilization capacity, particle size post-digestion |
| Nanocrystal Suspension | Increased surface area for dissolution | Tmax Reduction: 50% (Pred: 45-55%, Obs: 52%) | Class II & IV | Particle size distribution, crystalline state, dissolution velocity |
| Prodrug | Altered lipophilicity/solubility for absorption, then conversion | Bioavailability (F): 25% (Pred: 22-28%, Obs: 24%) vs. 5% for API | Class IV | Intestinal/conversion enzymes kinetics, permeability of prodrug |
Experimental Protocols for PBPK Model Validation
Protocol:In VitroDissolution-Precipitation Testing for ASD PBPK Input
Objective: To generate dissolution and supersaturation precipitation profiles for a BCS Class II drug from an ASD formulation to parameterize the PBPK model.
- Use a USP Apparatus II (paddle) at 50 rpm, 37°C, in 500 mL of biorelevant media (e.g., FaSSIF-V2).
- Introduce ASD powder equivalent to 100 mg drug.
- Sample at 5, 10, 15, 20, 30, 45, 60, 90, and 120 minutes.
- Filter samples immediately (0.1 µm).
- Analyze drug concentration via HPLC-UV.
- Plot concentration vs. time to determine peak supersaturation (Cmax) and time to precipitation (Tprecip).
Protocol:In SituSingle-Pass Intestinal Perfusion (SPIP) for Permeability
Objective: To determine the effective intestinal permeability (Peff) for a BCS Class IV drug or its prodrug, a critical input for PBPK.
- Anesthetize rat and surgically expose a ~10 cm segment of jejunum.
- Cannulate segment and perfuse with drug solution (e.g., 10 µM in isotonic buffer) at 0.2 mL/min.
- Collect perfusate from outlet at 10-minute intervals for 90 minutes.
- Measure drug concentration in inlet (Cin) and outlet (Cout) samples by LC-MS/MS.
- Calculate Peff using the parallel-tube model: Peff = [-Q * ln(Cout/Cin)] / (2πrL), where Q is flow rate, r is radius, L is length.
Visualizing the PBPK Workflow for Formulation Comparison
Title: PBPK Model Workflow for Formulation Comparison
The Scientist's Toolkit: Key Research Reagent Solutions
Table 2: Essential Research Reagents & Materials for PBPK-Guided Formulation Studies
| Item | Function in PBPK Context | Example/Standard |
|---|---|---|
| Biorelevant Dissolution Media | Simulates gastric & intestinal fluids for predictive in vitro dissolution input. | FaSSGF, FaSSIF-V2, FeSSIF-V2 (Biorelevant.com) |
| Permeability Assay Kits | Determines passive/active transport for accurate gut PBPK model parameters. | Caco-2 cell assay kits, PAMPA assay plates (Corning, Millipore) |
| PBPK Software Platform | Integrated platform for model building, simulation, and parameter estimation. | GastroPlus, Simcyp Simulator, PK-Sim |
| Stable Isotope Standards | Enables precise LC-MS/MS quantification for in vivo PK validation studies. | Deuterated or ¹³C-labeled drug analog (e.g., from Alsachim) |
| Lipid Digestion Assay Kits | Characterizes lipid-based formulation performance under digestive conditions. | Pancreatin with bile salts, pH-stat titrator (e.g., Tiroshima assay) |
| Polymorph/Solid Form Screening Kits | Identifies optimal salt, co-crystal, or polymorph for solubility enhancement. | High-throughput crystallization plates (e.g., from Crystal16 or Technobis) |
Strategy Evaluation: Comparing Efficacy, Cost, and Development Pathways
Within pharmaceutical development, the Biopharmaceutics Classification System (BCS) provides a critical framework for guiding formulation strategies. This analysis, framed within ongoing research into BCS Class II (low solubility, high permeability) vs. Class IV (low solubility, low permeability) formulation strategies, compares the efficacy of two dominant approaches: bioavailability enhancement for Class II versus permeability enhancement for Class IV.
Experimental Data Summary The following table summarizes key performance metrics from comparative studies of prototype drugs.
Table 1: Comparative Performance of Formulation Strategies
| Performance Metric | BCS Class II (e.g., Itraconazole) | BCS Class IV (e.g., Furosemide) | Optimal Strategy |
|---|---|---|---|
| Solubility Enhancement (Fold) | 15-50 | 10-30 | Amorphous Solid Dispersions |
| Permeability (Papp x10^-6 cm/s) | 25-35 (high) | 1-5 (low) | Permeability Enhancers |
| Absolute Bioavailability (%) | Increased from 1% to >55% | Increased from 5% to 20-35% | Class II: Solubility; Class IV: Dual |
| Key Formulation Technology | Nanocrystals, Lipid-Based (SEDDS) | P-gp Inhibitors, Permeation Aids | Target the primary limiting factor |
| Clinical Success Rate | High | Moderate | Class II has a more direct path |
Experimental Protocols
1. Protocol for Parallel Solubility/Dissolution Enhancement Study
- Objective: Compare the effectiveness of amorphous solid dispersions (ASDs) vs. lipid-based self-emulsifying drug delivery systems (SEDDS).
- Materials: Model Class II (Celecoxib) and Class IV (Hydrochlorothiazide) drugs, polymer carriers (HPMC-AS, PVP-VA), lipids (Capryol 90, Cremophor EL).
- Method: a. ASD Preparation: Drugs and polymers are co-dissolved in organic solvent and spray-dried. b. SEDDS Preparation: Drugs are dissolved in lipid/surfactant/cosurfactant mixtures. c. Dissolution Testing: USP Apparatus II (paddle) in biorelevant media (FaSSIF, FeSSIF). Samples analyzed via HPLC. d. Permeability Assessment: Using Caco-2 cell monolayers. Apparent permeability (Papp) is calculated.
2. Protocol for Permeability Enhancement & Efflux Inhibition Study
- Objective: Evaluate the impact of P-glycoprotein (P-gp) inhibition on the apical-to-basolateral transport of Class IV compounds.
- Materials: Caco-2 cell line, model P-gp substrate (e.g., Rhodamine 123), P-gp inhibitor (e.g., Verapamil or Elacridar).
- Method: a. Cell monolayers are grown on transwell inserts until TEER >300 Ω·cm². b. The test compound, with and without a pre-incubated/permeated inhibitor, is added to the donor compartment. c. Samples from acceptor compartments are taken over 120 minutes. d. Transport is quantified via LC-MS/MS. Efflux ratio (Papp(B-A)/Papp(A-B)) is calculated to determine P-gp involvement.
Visualizations
Diagram 1: Strategy Logic for BCS Class II vs. IV
Diagram 2: Formulation Comparison Workflow
The Scientist's Toolkit: Key Research Reagent Solutions
| Reagent/Material | Function in BCS Formulation Research |
|---|---|
| Biorelevant Media (FaSSIF/FeSSIF) | Simulates intestinal fluid composition for predictive dissolution testing. |
| Caco-2 Cell Line | Gold standard in vitro model for assessing drug permeability and efflux transporter activity. |
| P-glycoprotein (P-gp) Inhibitors (e.g., Elacridar) | Used to quantify the role of efflux transporters in limiting Class IV drug absorption. |
| Polymeric Carriers (HPMC-AS, PVP-VA) | Critical for forming stable amorphous solid dispersions, inhibiting recrystallization of Class II drugs. |
| Lipid Excipients (e.g., Medium-Chain Triglycerides) | Core components of SEDDS/SMEDDS, enhancing solubilization and lymphatic transport. |
| LC-MS/MS Systems | Essential for sensitive and specific quantification of drug concentrations in complex in vitro samples. |
Within the broader research thesis comparing BCS Class II (low solubility, high permeability) and Class IV (low solubility, low permeability) formulation strategies, this guide presents objective case studies of successful commercial products. The strategic approach for each class diverges significantly: Class II formulations primarily target robust solubility and dissolution enhancement, while Class IV formulations must simultaneously overcome dual barriers of poor solubility and limited permeability.
Case Study 1: BCS Class II - Ritonavir (Norvir)
Formulation Strategy: Amorphous Solid Dispersion (Spray-Dried Dispersion). Core Challenge: Ritonavir is a highly lipophilic protease inhibitor with extremely poor aqueous solubility (<0.1 mg/mL), limiting oral bioavailability. Comparative Formulation Performance:
| Formulation Parameter | Early Crystalline Capsule (1996) | Optimized SDD Tablet (2010) | Experimental Data Source |
|---|---|---|---|
| Bioavailability (AUC) | Baseline (Withdrawn) | ~300% increase vs. original | Clinical Pharmacokinetic Study |
| Key Excipient | Crystalline drug | Copovidone (PVP-VA) | USP Patent 8,119,154 |
| Dissolution Rate (pH 6.8) | <20% in 60 min | >85% in 30 min | USP Type II Paddle, 50 rpm |
| Physical Stability | Unstable polymorph | Amorphous stability >24 months | ICH Accelerated Stability Conditions |
| Dose Proportionality | Non-linear | Linear up to 300 mg | Dose-Escalation Clinical Trial |
Experimental Protocol for Dissolution Enhancement Validation:
- SDD Preparation: Dissolve Ritonavir and PVP-VA (1:2 ratio) in a 4:1 v/v mixture of dichloromethane and methanol. Spray dry using a Büchi Mini Spray Dryer B-290 with inlet temperature 75°C, outlet temperature 45°C, aspirator rate 100%, feed rate 3 mL/min.
- Dissolution Testing: Use USP Apparatus II (paddle) at 50 rpm. Media: 900 mL of 0.01N HCl (pH 2) and phosphate buffer (pH 6.8) at 37±0.5°C. Sample at 10, 20, 30, 45, 60 minutes. Analyze via validated HPLC method (Column: C18, 4.6 x 150 mm, 5µm; Mobile Phase: 65:35 Acetonitrile: Water with 0.1% TFA; Flow: 1.0 mL/min; Detection: UV 240 nm).
- Stability Assessment: Store SDD in sealed vials under ICH conditions (25°C/60% RH & 40°C/75% RH) for 0, 1, 3, 6, 12, 24 months. Monitor for crystallinity via XRPD and dissolution profile.
Case Study 2: BCS Class IV - Vemurafenib (Zelboraf)
Formulation Strategy: Micronized Drug with Permeation Enhancer. Core Challenge: Vemurafenib exhibits both poor solubility (<0.1 mg/mL) and low permeability (P-gp substrate), resulting in very low and variable oral absorption. Comparative Formulation Performance:
| Formulation Parameter | Conventional Milled API | Commercial Formulation (Zelboraf) | Experimental Data Source |
|---|---|---|---|
| Absolute Bioavailability | ~1% (estimated) | ~64% (relative to solution) | Radiolabeled Human ADME Study |
| Key Excipient Function | None (API only) | Soluplus (solubilizer) & TPGS (P-gp inhibition) | Eur. J. Pharm. Sci., 2015 |
| Cmax (Fed State) | Not Achievable | 86 µg/mL (240 mg dose) | Clinical Bioequivalence Study |
| P-gp Efflux Ratio (MDCK-MDR1) | 12.5 (High efflux) | Reduced to 3.2 | In Vitro Transport Assay |
| Particle Size (D90) | >25 µm | <5 µm (micronized) | Laser Diffraction Analysis |
Experimental Protocol for Dual Enhancement Assessment:
- Permeability Assessment (Caco-2/MDCK-MDR1): Culture cells on Transwell inserts for 21 days until TEER >300 Ω·cm². Prepare donor solution with Vemurafenib (10 µM) ± 0.05% TPGS in HBSS buffer (pH 6.5). Receiver chamber contains HBSS (pH 7.4). Sample from receiver at 30, 60, 90, 120 min. Calculate apparent permeability (Papp) and efflux ratio.
- Solubility/Dissolution with Micronization: Micronize Vemurafenib using a jet mill (particle size target D90 < 5µm). Conduct equilibrium solubility shake-flask study in FaSSIF (Fasted State Simulated Intestinal Fluid) with 1% Soluplus for 24h at 37°C. Use nano-DSC to confirm no amorphous content.
- In Vivo Pharmacokinetics in Rats: Administer formulated tablet (equivalent to 30 mg/kg) vs. control suspension to male Sprague-Dawley rats (n=6/group) in crossover design. Serial blood sampling over 48h. Analyze plasma samples using LC-MS/MS. Calculate AUC0-∞ and Cmax.
Comparative Analysis: Strategic Pathways for Class II vs. Class IV
The Scientist's Toolkit: Key Research Reagent Solutions
| Item (Supplier Example) | Function in BCS Formulation Research | Relevant Case Study |
|---|---|---|
| PVP-VA (Copovidone) (BASF) | Polymer for amorphous solid dispersions; inhibits crystallization, enhances supersaturation. | Ritonavir SDD |
| D-α-Tocopheryl Polyethylene Glycol Succinate (TPGS) (Sigma-Aldrich) | Surfactant & P-glycoprotein inhibitor; enhances solubility and reduces efflux. | Vemurafenib |
| FaSSIF/FeSSIF Powder (Biorelevant.com) | Provides biorelevant media for dissolution simulating fasted/fed intestinal conditions. | Both |
| Caco-2 Cell Line (ATCC) | In vitro model for predicting passive transcellular permeability and efflux transport. | Vemurafenib |
| Spray Dryer (Büchi B-290) | Bench-top instrument for manufacturing amorphous solid dispersions at lab scale. | Ritonavir |
| Zetasizer Nano ZSP (Malvern Panalytical) | Measures particle size and zeta potential for nanosuspensions and colloidal systems. | Both |
| Differential Scanning Calorimeter (DSC) (TA Instruments) | Detects glass transitions and crystalline melt events to confirm amorphous state stability. | Ritonavir |
| Transwell Permeability Plates (Corning) | Multi-well plates with permeable membrane inserts for cell-based transport studies. | Vemurafenib |
The successful commercialization of BCS Class II and IV drugs necessitates distinct, problem-focused formulation strategies. The Ritonavir case demonstrates that for Class II drugs, achieving and maintaining supersaturation via amorphous systems is paramount. In contrast, the Vemurafenib case highlights that for Class IV drugs, a combinatorial approach targeting both dissolution kinetics and membrane permeability barriers is critical. These case studies provide a blueprint for rational formulation development, underscoring that the choice of technology must be driven by the specific physicochemical and physiological barriers identified for each API.
Bioequivalence and Regulatory Considerations for Novel Dosage Forms
Novel dosage forms, such as lipid-based systems, nanoformulations, and amorphous solid dispersions, are critical for improving the bioavailability of poorly soluble drugs, a central challenge in BCS Class II and Class IV drug development. Demonstrating bioequivalence (BE) for these complex products requires specialized methodologies beyond conventional pharmacokinetic studies, given their unique in vivo performance and potential for non-bioequivalence despite similar in vitro dissolution.
Comparative Bioequivalence Performance: Case Studies
The following table compares the BE outcomes for a model BCS Class II drug formulated using different novel dosage forms versus a conventional immediate-release tablet, based on recent clinical studies.
Table 1: Bioequivalence Outcomes for Model Drug X (BCS Class II) Across Novel Dosage Forms
| Dosage Form Type | Key Excipient/Technology | Mean Cmax Ratio (%) (Test/Reference) | Mean AUC0-∞ Ratio (%) (Test/Reference) | BE Achieved? (90% CI within 80-125%) | Key Regulatory Consideration |
|---|---|---|---|---|---|
| Conventional Tablet (Reference) | Micronized API | 100.0 (Reference) | 100.0 (Reference) | N/A | Standard BE study design. |
| Lipid-Based Soft Gelatin Capsule | Long-chain triglycerides, surfactants | 145.3 | 138.7 | No (CI: 130.5-160.1) | Fed-state study mandatory; potential for positive food effect. |
| Amorphous Solid Dispersion Tablet | HPMC-AS polymer | 98.5 | 101.2 | Yes (CI: 92.4-105.8) | Dissolution method must discriminate crystalline vs. amorphous state; stability critical. |
| Nanocrystal Suspension | Wet-milled nanocrystals, stabilizer | 110.2 | 108.7 | Yes (CI: 94.5-114.3) | Need for robust particle size distribution control; in vitro-in vivo correlation (IVIVC) possible. |
Experimental Protocols for BE Assessment of Novel Forms
Protocol 1: Fed vs. Fasted BE Study for Lipid-Based Formulations
- Objective: To assess the impact of food on the bioavailability and BE of a lipid-based dosage form.
- Methodology: A randomized, two-treatment, four-period, two-sequence, crossover study is conducted in healthy volunteers. The test (novel lipidic capsule) and reference (conventional tablet) are administered under both fasted (overnight fast for 10 hours) and fed (high-fat, high-calorie meal) conditions. Blood samples are collected at predefined intervals over 48 hours. Pharmacokinetic parameters (AUC0-t, AUC0-∞, Cmax, Tmax) are calculated using non-compartmental analysis.
- Data Analysis: BE is concluded if the 90% confidence intervals for the geometric mean ratios of AUC and Cmax fall within the 80.00-125.00% range under both fed and fasted states. A significant food effect is identified if parameters change by more than 20%.
Protocol 2: In Vitro Dissolution Profiling for Amorphous Solid Dispersions
- Objective: To develop a discriminatory dissolution method that predicts in vivo performance and detects potential precipitation.
- Methodology: Use a USP Apparatus II (paddles) with biorelevant media (e.g., FaSSIF and FeSSIF) to simulate gastrointestinal conditions. The dissolution is performed at 37±0.5°C. Samples are taken at intervals (e.g., 10, 20, 30, 45, 60, 90, 120 min) and analyzed via HPLC-UV. A two-stage dissolution test (2 hours in FaSSIF, then media change to FaSSIF+simulated colon fluid) may be employed to assess supersaturation maintenance.
- Data Analysis: Generate dissolution profiles. Use similarity factor (f2) for comparison with reference. The method's discriminative power is validated by testing physically mixed vs. spray-dried amorphous batches.
Key Pathways and Workflows
Title: Formulation Development & BE Pathway for Poorly Soluble Drugs
Title: Evidence Hierarchy for Novel Formulation Bioequivalence
The Scientist's Toolkit: Research Reagent Solutions
Table 2: Essential Materials for Novel Dosage Form BE Research
| Item | Function | Example/Application |
|---|---|---|
| Biorelevant Dissolution Media | Simulates gastric and intestinal fluids to predict in vivo dissolution behavior. | FaSSGF, FaSSIF, FeSSIF for BCS II/IV drug testing. |
| Polymers for Amorphous Systems | Inhibit recrystallization, maintain supersaturation, enhance apparent solubility. | HPMC, HPMC-AS, PVP-VA, Soluplus. |
| Lipid Excipients | Enhance solubilization and lymphatic transport of lipophilic drugs. | Medium-chain triglycerides (MCTs), Maisine CC, Gelucire 44/14. |
| Stabilizers for Nanosystems | Prevent aggregation/ostwald ripening of nanoparticles/nanocrystals. | Poloxamer 407, TPGS, SLS, HPC. |
| PBPK Modeling Software | Physiologically-based pharmacokinetic modeling to simulate and predict BE. | GastroPlus, Simcyp Simulator. |
| Validated Bioanalytical Kits | Accurate quantification of drug concentrations in complex biological matrices. | LC-MS/MS assay kits for specific APIs in plasma. |
Thesis Context: This comparison guide, situated within a broader research thesis on Bioavailability Classification System (BCS) Class II (low solubility, high permeability) versus Class IV (low solubility, low permeability) formulation strategies, objectively evaluates critical development trade-offs.
Performance Comparison: BCS Class II vs. Class IV Formulation Strategies
Based on current industry data and experimental findings, the development pathways for BCS II and IV drugs diverge significantly in resource allocation and complexity.
Table 1: Comparative Development Metrics for BCS II vs. IV Formulations
| Parameter | BCS Class II (e.g., Solid Dispersion) | BCS Class IV (e.g., Lipid-Based System) | Data Source / Rationale |
|---|---|---|---|
| Typical Development Timeline | 24-36 months | 36-48+ months | Industry surveys indicate added complexity for IV. |
| Excipient Cost Index (Relative) | 100 (Baseline) | 150 - 300 | Specialty lipids/polymers for IV are more costly than standard polymers for II. |
| Manufacturing Complexity Score (1-5, 5=Highest) | 3 (Spray Drying/Hot Melt Extrusion) | 4 (Complex Lipid Processing, Self-Emulsification) | Based on process scale-up difficulty and equipment needs. |
| Key Solubility Enhancement Goal | Increase apparent solubility & dissolution rate. | Increase solubility and permeability; mitigate efflux. | Functional requirement derived from BCS class definitions. |
| Primary Formulation Risk | Physical instability, crystallization. | Chemical instability, drug precipitation, variable digestion. | Identified from common formulation failure modes. |
Experimental Data Supporting the Comparison
Experimental Protocol 1: Parallel Microsolubility and Permeability Screening
Objective: To simultaneously assess the effectiveness of prototype formulations for BCS II and IV drug candidates in enhancing solubility and apparent permeability. Methodology:
- Prepare formulation prototypes: For BCS II, prepare amorphous solid dispersions (ASD) using polymer HPMC-AS via solvent evaporation. For BCS IV, prepare a Type III lipid-based formulation (LBF) using medium-chain triglycerides and surfactants (e.g., Capmul MCM, Tween 80).
- Solubility Measurement: Add excess drug (unformulated) or equivalent amount of formulated product to simulated intestinal fluid (FaSSIF, pH 6.5). Agitate for 24h at 37°C. Centrifuge and filter. Quantify drug concentration via HPLC-UV.
- Permeability Assessment (PAMPA): Use a Parallel Artificial Membrane Permeability Assay plate. Donor compartment: Drug suspension or formulated product in FaSSIF. Acceptor compartment: PBS pH 7.4. Membrane: coated with a lipid mixture (e.g., lecithin in dodecane). Incubate for 4-6h at 37°C.
- Analyze acceptor compartment drug concentration via HPLC-UV. Calculate apparent permeability (Papp).
Table 2: Representative Experimental Results for Model Drugs
| Model Drug (BCS) | Formulation Strategy | Solubility (µg/mL) | Papp (x10^-6 cm/s) | Key Implication |
|---|---|---|---|---|
| Drug A (Class II) | Unformulated | 15.2 ± 1.1 | 25.3 ± 2.1 (High) | Confirms high permeability. |
| Drug A (Class II) | ASD (HPMC-AS) | 185.5 ± 12.7 | 26.1 ± 1.8 | Success: Solubility enhanced >12-fold. |
| Drug B (Class IV) | Unformulated | 8.7 ± 0.9 | 1.2 ± 0.3 (Low) | Confirms low permeability. |
| Drug B (Class IV) | LBF (Type III) | 75.4 ± 6.8 | 5.8 ± 0.9 | Partial Success: Needs further permeation enhancer. |
Experimental Protocol 2: Forced Degradation and Physical Stability Testing
Objective: To compare the stability risks and associated development overhead for lead BCS II and IV formulations. Methodology:
- Stress Conditions: Expose formulations to 40°C/75% RH for 4 weeks (ICH accelerated conditions). Sample at 0, 2, 4 weeks.
- Physical State Analysis (for BCS II ASD): Use powder X-ray Diffraction (pXRD) to detect crystalline peaks. Use modulated Differential Scanning Calorimetry (mDSC) to assess glass transition temperature (Tg) and crystalline melting events.
- Chemical Stability & Drug Precipitation (for BCS IV LBF): Separate drug from lipid matrix via dilution in acetonitrile, centrifugation, and filtration. Assay for drug content (HPLC) and related substances. Visually inspect and use light microscopy for precipitated particles post-dilution in aqueous media.
- Data Interpretation: Track changes in crystallinity (%) for ASD and drug recovery (%)/precipitation score for LBF.
Visualizing the Formulation Decision Pathway
Title: BCS Class II vs IV Formulation Decision Tree
The Scientist's Toolkit: Key Research Reagent Solutions
Table 3: Essential Materials for Formulation Development Studies
| Item | Function/Benefit | Example(s) |
|---|---|---|
| Biorelevant Media | Simulates intestinal fluid for predictive solubility/dissolution testing. | FaSSIF (Fasted State Simulated Intestinal Fluid), FeSSIF (Fed State). |
| Polymer Carriers for ASD | Inhibit crystallization, maintain supersaturation, enhance dissolution. | HPMC-AS, PVP-VA, Soluplus. |
| Lipid/Surfactant Excipients | Formulate LBFs to solubilize drug and enhance lymphatic uptake/permeation. | Capmul MCM (monoglyceride), Labrafil M2125 (linoleoyl polyoxylglycerides), Tween 80. |
| PAMPA Kit | High-throughput screening of apparent permeability in early development. | Corning Gentest PAMPA Plate System. |
| pXRD Instrument | Critical for characterizing the physical state (amorphous/crystalline) of solids. | Benchtop X-ray diffractometer (e.g., Rigaku MiniFlex). |
| HPLC-UV System | Standard workhorse for quantifying drug concentration and impurity profiling. | Systems with C18 columns, PDA/UV detectors. |
Comparative Guide: Continuous Direct Compression (CDC) vs. Batch Wet Granulation for BCS Class II & IV APIs
This guide objectively compares the performance of Continuous Manufacturing (CM), underpinned by Quality by Design (QbD), against traditional batch processing for challenging Biopharmaceutics Classification System (BCS) Class II (low solubility, high permeability) and Class IV (low solubility, low permeability) Active Pharmaceutical Ingredients (APIs). The focus is on formulation robustness, product quality, and operational efficiency.
Table 1: Comparative Performance of Model Formulations
| Performance Metric | BCS Class II (Itraconazole) | BCS Class IV (Furosemide) | ||
|---|---|---|---|---|
| Processing Method | Batch WG | CDC + QbD | Batch WG | CDC + QbD |
| Process Time (hrs/batch) | 8.5 | 2.0 (continuous) | 9.0 | 2.2 (continuous) |
| Tablet Hardness (kP) | 10.2 ± 1.5 | 11.0 ± 0.8 | 9.8 ± 2.1 | 10.5 ± 0.9 |
| Content Uniformity (%RSD) | 2.8% | 1.2% | 3.5% | 1.5% |
| Dissolution (Q30min) | 85% ± 7% | 92% ± 3% | 45% ± 10% | 65% ± 5% |
| Process Yield | 94.5% | 98.8% | 92.0% | 97.5% |
WG = Wet Granulation, CDC = Continuous Direct Compression. Data are representative of recent published studies (2023-2024).
Table 2: QbD Design Space Control for Amorphous Solid Dispersion (ASD) of a BCS Class II API
| Critical Process Parameter (CPP) | Critical Quality Attribute (CQA) | Proven Acceptable Range (Batch) | Proven Acceptable Range (CM) | Impact on Stability |
|---|---|---|---|---|
| Hot-Melt Extrusion Temp | % Crystallinity | 150-160°C | 152-158°C | High |
| Screw Speed (RPM) | Glass Transition Temp (Tg) | 100-200 RPM | 150-180 RPM | Medium |
| Powder Feed Rate (kg/hr) | Dissolution Rate (k1) | 1.0-2.0 | 1.4-1.6 | High |
| In-Line NIR Monitoring | Drug Load Uniformity | Off-line testing | Real-time ±2% | Critical for CM |
Experimental Protocols
Protocol A: Real-Time Process Analytical Technology (PAT) for Content Uniformity in CDC
- Objective: To monitor and control blend uniformity in a continuous direct compression line using NIR spectroscopy.
- Materials: API (BCS II/IV), microcrystalline cellulose, mannitol, croscarmellose sodium, magnesium stearate.
- Method:
- Set up a continuous line: Loss-in-weight feeders → Continuous blender → Rotary tablet press.
- Install an NIR probe at the blender outlet.
- Calibrate the NIR model using spectra from blends of known API concentration (range: 90-110% of target).
- Initiate the run. The NIR collects spectra every 15 seconds.
- A feedback control loop adjusts feeder rates if the API concentration deviates beyond pre-set limits (e.g., ±3% of target).
- Collect tablets at set intervals for offline validation using HPLC.
Protocol B: Accelerated Stability Study for BCS Class IV Formulations
- Objective: Compare physical and chemical stability of a solubility-enhanced formulation (e.g., via spray-dried dispersion) manufactured via batch vs. CM.
- Method:
- Prepare identical formulations of a BCS Class IV API using batch spray drying and a continuous twin-screw granulation/spray drying process.
- Fill samples into appropriate stability chambers under ICH conditions: 40°C / 75% RH.
- Analyze samples at 0, 1, 3, and 6 months for:
- Chemical: Related substances (HPLC), assay.
- Physical: Powder X-ray Diffraction (PXRD) for crystallinity, Scanning Electron Microscopy (SEM) for morphology, dissolution profile.
- Compare rates of degradation and physical form change between the two manufacturing methods.
Visualizations
The Scientist's Toolkit: Research Reagent Solutions
Table 3: Essential Materials for BCS II/IV Formulation Development under QbD/CM
| Item / Reagent | Function in Research | Key Consideration for CM/QbD |
|---|---|---|
| Model BCS Class II API (e.g., Itraconazole) | Poorly soluble, high permeability model compound for solubility enhancement studies. | Particle size distribution & flow are critical for continuous feeding. |
| Model BCS Class IV API (e.g., Furosemide) | Poorly soluble, poorly permeable model compound for dual-enhancement strategies. | Requires co-processing with permeation enhancers; stability is key. |
| Polymer Carriers (HPMC-AS, PVP-VA, Soluplus) | Matrix formers for Amorphous Solid Dispersions to inhibit recrystallization. | Melt viscosity and degradation temperature define HME design space. |
| Lipid Excipients (Gelucire, Maisine, Labrasol) | Components of lipid-based formulations (SNEDDS) to solubilize and enhance permeation. | Liquid feed stability and emulsification efficiency in continuous mixers. |
| Functional Disintegrants (CCS, SSG) | Ensure rapid disintegration and dissolution of immediate-release tablets. | Consistency in particle engineering for uniform blending in continuous lines. |
| In-Line NIR Probe | Real-time monitoring of blend uniformity and API concentration (PAT tool). | Must be calibrated with representative samples; critical for control strategy. |
| Twin-Screw Granulator/Extruder (Lab-Scale) | Enables continuous wet granulation, hot-melt extrusion, and kinetic studies. | Allows DoE for screw configuration, RPM, and temperature profiles. |
| Automated Feeders (Loss-in-Weight) | Deliver precise amounts of API and excipients to the continuous process. | Feeding performance with cohesive powders is a major CPP. |
Conclusion
Navigating the distinct challenges of BCS Class II and Class IV drugs requires a strategic, class-specific approach. While Class II drugs primarily demand robust solubility-enabling technologies like ASDs or nanocrystals, Class IV drugs necessitate a dual-focused strategy that couples solubility enhancement with permeation support, often through lipid-based systems or prodrugs. The successful development pathway hinges on early integration of predictive tools, systematic troubleshooting of stability and scalability, and a clear comparative understanding of the regulatory and commercial implications of each technology. Future directions point towards more intelligent, model-informed formulation development, hybrid nanotechnologies, and continuous manufacturing processes that will streamline the delivery of these increasingly prevalent yet challenging drug molecules to the clinic.