HPLC vs UPLC: Choosing the Optimal Chromatography for Complex Drug Mixture Resolution in Modern Pharma
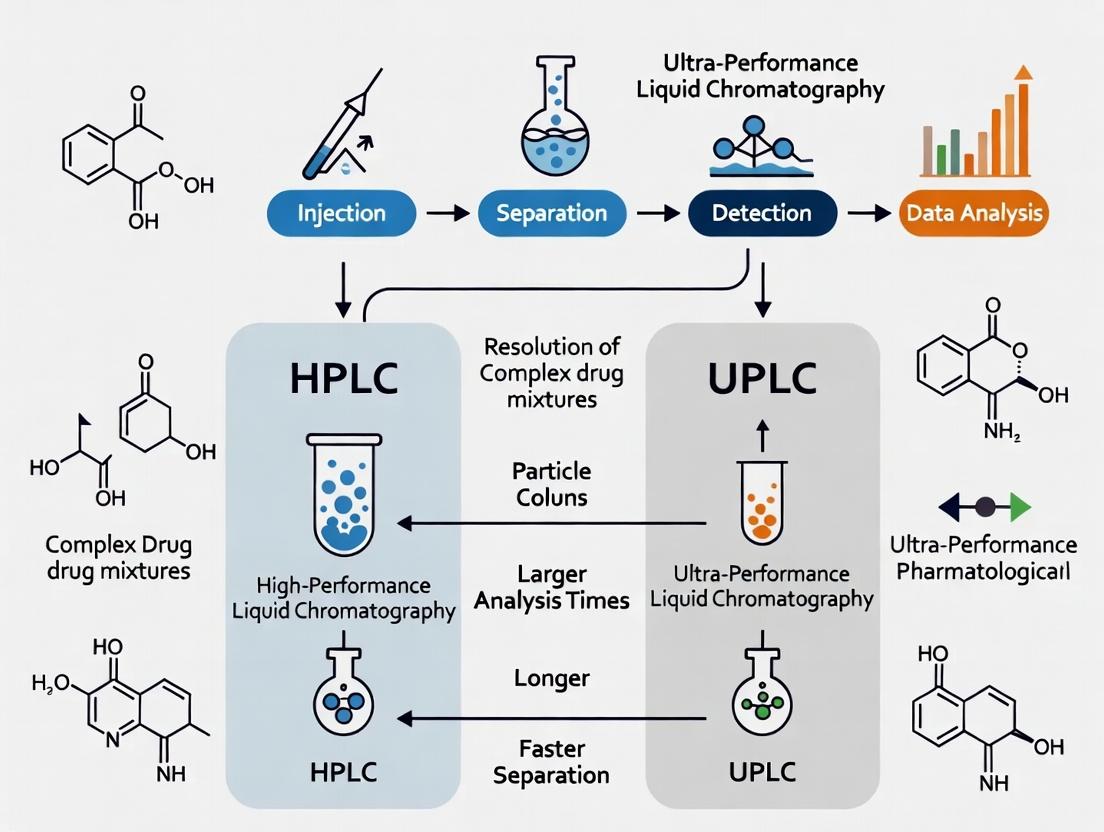
This comprehensive guide explores the critical decision between High-Performance Liquid Chromatography (HPLC) and Ultra-Performance Liquid Chromatography (UPLC) for resolving complex drug mixtures in pharmaceutical research and development.
HPLC vs UPLC: Choosing the Optimal Chromatography for Complex Drug Mixture Resolution in Modern Pharma
Abstract
This comprehensive guide explores the critical decision between High-Performance Liquid Chromatography (HPLC) and Ultra-Performance Liquid Chromatography (UPLC) for resolving complex drug mixtures in pharmaceutical research and development. We delve into the foundational principles, core differences in pressure, particle size, and column technology. The article provides practical methodological guidance for method development, transfer, and application-specific selection, alongside advanced troubleshooting and optimization strategies for peak resolution, carryover, and pressure management. A detailed comparative analysis validates performance metrics—resolution, sensitivity, speed, and solvent consumption—across diverse drug mixture scenarios, culminating in a synthesis of key takeaways and future implications for streamlined drug development workflows.
Understanding the Core Principles: HPLC and UPLC Technology Demystified
Within the broader thesis of HPLC vs. UPLC for the resolution of complex drug mixtures, the core principles of column efficiency, selectivity, and retention form the bedrock upon which all separation science is built. This guide compares the performance of traditional High-Performance Liquid Chromatography (HPLC) and Ultra-High-Performance Liquid Chromatography (UPLC) in applying these principles, focusing on the critical metrics that define analytical success.
Core Principle Comparison: HPLC vs. UPLC
The fundamental goal of resolving complex drug mixtures—such as active pharmaceutical ingredients (APIs), their degradants, and synthetic intermediates—rests on three pillars: achieving high efficiency (narrow peaks), fine-tuning selectivity (peak spacing), and managing retention (peak time). The shift from HPLC to UPLC represents an evolution in how these principles are maximized.
Table 1: Comparative Core Performance Metrics for a Model Drug Mixture
| Parameter | Traditional HPLC (3–5 µm beads) | Modern UPLC (<2 µm beads) | Impact on Resolution |
|---|---|---|---|
| Typical Particle Size | 3.5 µm | 1.7 µm | Smaller particles reduce band broadening. |
| Optimal Flow Rate | ~1.0 mL/min | ~0.6 mL/min | Lower flow reduces backpressure at high efficiency. |
| Max Operating Pressure | 400–600 bar | 1000–1500 bar | Enables use of smaller particles. |
| Theoretical Plates (N) per 150mm column | ~15,000 | ~40,000 | Directly increases peak capacity and resolution. |
| Peak Width (for a late-eluting peak) | ~10–15 s | ~3–5 s | Sharper peaks improve detection sensitivity and resolution. |
| Analysis Time for a 10-Peak Mix | 20–30 minutes | 5–10 minutes | Throughput is significantly increased. |
Table 2: Experimental Resolution Data: Hypnotic Drug Mixture (Benzodiazepines)
| System | Column Dimensions | Particle Size | Resolution (Rs) between Clonazepam & Flunitrazepam | Run Time | Signal-to-Noise (S/N) for Low-Level Degradant |
|---|---|---|---|---|---|
| HPLC | 150 mm x 4.6 mm | 5 µm | 1.8 | 22 min | 45 |
| UPLC | 100 mm x 2.1 mm | 1.7 µm | 2.5 | 7 min | 120 |
Experimental Protocol for Comparison
Methodology for Generating Table 2 Data:
Sample Preparation: A standard mixture of five benzodiazepines (diazepam, clonazepam, flunitrazepam, midazolam, and a degradant oxazepam) at 10 µg/mL each in methanol:water (50:50, v/v). A spiked degradant sample at 0.1 µg/mL is prepared for LOD/S/N determination.
HPLC Conditions:
- Instrument: Agilent 1260 Infinity II Quaternary LC.
- Column: ZORBAX Eclipse Plus C18 (150 mm x 4.6 mm, 5 µm).
- Mobile Phase: (A) 0.1% Formic Acid in Water, (B) Acetonitrile.
- Gradient: 30% B to 80% B over 18 minutes.
- Flow Rate: 1.0 mL/min.
- Temperature: 30°C.
- Detection: DAD, 254 nm.
- Injection Volume: 10 µL.
UPLC Conditions:
- Instrument: Waters ACQUITY UPLC H-Class.
- Column: ACQUITY UPLC BEH C18 (100 mm x 2.1 mm, 1.7 µm).
- Mobile Phase: (A) 0.1% Formic Acid in Water, (B) Acetonitrile.
- Gradient: 30% B to 80% B over 6 minutes (scaled from HPLC method).
- Flow Rate: 0.6 mL/min.
- Temperature: 30°C.
- Detection: PDA, 254 nm.
- Injection Volume: 2 µL.
Data Analysis: Resolution (Rs) calculated between the critical pair (clonazepam & flunitrazepam). S/N calculated from the degradant peak in the spiked sample.
Visualizing the Workflow and Principles
LC Principle Optimization Workflow
Liquid Chromatography System Flow
The Scientist's Toolkit: Research Reagent Solutions
Table 3: Essential Materials for HPLC/UPLC Method Development
| Item / Reagent | Function & Importance in Separation |
|---|---|
| Ultra-Pure Water (LC-MS Grade) | The foundation of Mobile Phase A; impurities cause baseline noise and column contamination. |
| HPLC/UPLC Grade Organic Solvents (ACN, MeOH) | Primary components of Mobile Phase B; low UV cutoff and volatility are critical for detection & MS. |
| High-Purity Buffer Salts & Additives (e.g., Ammonium Formate/Acetate, Formic Acid) | Control mobile phase pH and ionic strength, crucial for modulating selectivity and analyte ionization. |
| Pharmaceutically Relevant Standard Mixtures (e.g., USP Resolution Mixtures) | System suitability tests to validate column efficiency and resolution performance before sample analysis. |
| Stationary Phase Columns (C18, C8, Phenyl, HILIC) | Different selectivity profiles are required to resolve diverse, complex drug mixtures based on hydrophobicity, polarity, and ionizability. |
| In-Line Degasser & 0.22 µm Filters | Removes dissolved air (prevents baselines drift) and particulates from mobile phases to protect pumps and columns. |
| Certified Autosampler Vials & Low-Volume Inserts | Ensures precise, reproducible injection volumes, especially critical for UPLC's low-dispersion requirements. |
Within the broader research thesis comparing HPLC and UPLC for the resolution of complex drug mixtures, this guide objectively examines the performance of High-Performance Liquid Chromatography (HPLC) against its primary alternative, Ultra-High-Performance Liquid Chromatography (UPLC). HPLC remains a foundational, rugged, and versatile platform in pharmaceutical laboratories. However, its operational limits are well-defined when juxtaposed with modern pressure-driven techniques. This guide provides a data-driven comparison focused on critical parameters for drug development.
Performance Comparison: HPLC vs. UPLC
The following table summarizes key performance metrics from recent, representative experimental studies analyzing complex pharmaceutical mixtures, such as multi-component active pharmaceutical ingredient (API) assays or metabolite profiling.
Table 1: Quantitative Performance Comparison of HPLC and UPLC Systems
| Performance Metric | Typical HPLC (e.g., 5 µm column) | Typical UPLC (e.g., 1.7 µm column) | Experimental Outcome & Implication |
|---|---|---|---|
| Operating Pressure | < 400 bar (6,000 psi) | 600-1000+ bar (15,000+ psi) | UPLC utilizes higher pressures to drive flow through smaller particles. |
| Particle Size | 3 µm, 5 µm | 1.7 µm, 1.8 µm | Smaller UPLC particles are the primary driver of increased efficiency. |
| Theoretical Plates (N) | ~10,000-15,000 per 150 mm column | ~20,000-30,000 per 100 mm column | UPLC provides significantly higher column efficiency, improving peak capacity. |
| Analytical Run Time | 10-30 minutes (standard method) | 3-10 minutes (scaled method) | UPLC offers 3-5x faster analysis, increasing throughput. |
| Solvent Consumption | ~2 mL/min (for 4.6 mm i.d.) | ~0.6 mL/min (for 2.1 mm i.d.) | UPLC reduces solvent use by ~60-70%, lowering cost and waste. |
| Peak Capacity | 100-200 | 200-400 | UPLC resolves more components in a given time, critical for complex mixtures. |
| Detection Sensitivity | Standard (dependent on detector) | Often increased due to reduced peak volume and dispersion. | Improved signal-to-noise for low-abundance analytes in UPLC. |
| Method Transfer | High robustness; wide compatibility. | Requires instrument and column availability; check pressure limits. | HPLC methods are more universally transferable across labs. |
Experimental Protocols for Cited Data
The data in Table 1 is synthesized from standard method translation experiments. The core protocol is detailed below.
Protocol 1: Direct Method Translation for Comparison of HPLC and UPLC Performance
- Sample Preparation: Prepare a test mixture of at least 5-10 related pharmaceutical compounds (e.g., API and its potential impurities or metabolites) in a suitable solvent (e.g., mobile phase A). Concentration should be in the linear range for UV detection.
- HPLC Method Conditions:
- Column: 150 mm x 4.6 mm, 5 µm C18.
- Mobile Phase: A: 0.1% Formic Acid in Water; B: 0.1% Formic Acid in Acetonitrile.
- Gradient: 5% B to 95% B over 20 minutes.
- Flow Rate: 1.0 mL/min.
- Temperature: 30°C.
- Detection: UV-Vis at 254 nm.
- Injection Volume: 10 µL.
- UPLC Method Conditions (Scaled from HPLC):
- Column: 100 mm x 2.1 mm, 1.7 µm C18.
- Mobile Phase: Identical to HPLC.
- Gradient: Scale linearly by gradient time factor (tG) and void volume (t0). A typical scaled gradient: 5% B to 95% B over 6.5 minutes.
- Flow Rate: 0.6 mL/min (adjusted for column geometry).
- Temperature: 30°C.
- Detection: Identical detector, with data acquisition rate increased to ≥10 Hz.
- Injection Volume: 2 µL (scaled for column volume).
- Data Analysis: Calculate for each system: retention time consistency, plate count (N) for a mid-eluting peak, peak capacity, resolution between the closest-eluting pair, and total solvent consumption per run.
Protocol 2: Evaluating Resolution Limits with a Complex Synthetic Mixture This protocol stress-tests the resolution capability of each system.
- Sample: Use a challenging test mixture, such as a multi-component antibiotic or peptide digest (e.g., BSA tryptic digest).
- Method Development: Develop isocratic or shallow gradient methods on both platforms to achieve near-baseline resolution of the maximum number of components.
- Measurement: The key metric is Peak Capacity (nc). Calculate using the formula: nc = 1 + (tG / (1.7 * average peak width at base)). The system yielding higher nc under time-equivalent conditions demonstrates superior resolution power.
System Selection Decision Pathway
The choice between HPLC and UPLC is governed by application requirements and practical constraints. The following diagram outlines the key decision logic.
Title: HPLC vs UPLC System Selection Logic
The Scientist's Toolkit: Essential Research Reagents & Materials
Table 2: Key Reagents and Materials for HPLC/UPLC Method Development
| Item | Function in Experiment | Critical Consideration |
|---|---|---|
| LC-MS Grade Water | Aqueous mobile phase component; sample reconstitution. | Minimizes background ions and UV absorbance for sensitive detection. |
| LC-MS Grade Acetonitrile/Methanol | Organic mobile phase modifiers for gradient elution. | High purity reduces baseline noise and system contamination. |
| Volatile Buffers (e.g., Ammonium Formate/Acetate) | Mobile phase additives to control pH and ion-pairing. | Essential for reproducible retention; MS-compatible at low concentrations (<50 mM). |
| Trifluoroacetic Acid (TFA) / Formic Acid | Ion-pairing agent (TFA) or pH modifier for acidic conditions. | TFA provides excellent peak shape for peptides but can suppress MS signal. Formic acid is MS-friendly. |
| Pharmaceutical Test Mixture | Standardized sample for system suitability and comparison. | Should contain analytes with varying hydrophobicity and functionality relevant to drugs. |
| Sub-2µm UPLC Column | Stationary phase for UPLC separations (e.g., 1.7µm BEH C18). | Requires high-pressure instrumentation; method scaling from HPLC is necessary. |
| 3-5µm HPLC Column | Stationary phase for HPLC separations (standard 4.6 x 150 mm format). | The classic workhorse; highly robust with wide method literature. |
| Column Heater/Oven | Maintains stable column temperature. | Critical for retention time reproducibility in both HPLC and UPLC. |
| Vial Inserts with Low Volume | Holds limited sample volumes, especially for UPLC injections. | Polymeric inserts minimize sample adsorption and are optimal for <10 µL volumes. |
HPLC endures as a classic workhorse due to its unmatched robustness, lower operational pressures, and vast established method libraries. Its defined operational limits—particularly in peak capacity, speed, and solvent usage—become apparent when directly compared to UPLC. For resolving highly complex drug mixtures where speed and maximum resolution are paramount, UPLC holds a demonstrable advantage. The choice ultimately hinges on the specific demands of the analytical problem within the drug development workflow.
Within the broader thesis comparing HPLC and UPLC for resolving complex drug mixtures, the advent of Ultra-Performance Liquid Chromatography (UPLC) represents a paradigm shift. This guide objectively compares UPLC's performance against traditional High-Performance Liquid Chromatography (HPLC) by examining its two core technological pillars: sub-2µm particulate stationary phases and high-pressure fluidic systems.
Table 1: Performance Comparison of HPLC vs. UPLC for Model Drug Mixture Analysis
| Parameter | Traditional HPLC (5µm Particles) | UPLC (1.7µm Particles) | % Improvement |
|---|---|---|---|
| Operating Pressure | 2000 - 4000 psi | 12,000 - 18,000 psi | +300% (System Capability) |
| Analytical Runtime | 25.0 min | 5.5 min | -78% |
| Peak Capacity | ~120 | ~280 | +133% |
| Theoretical Plates | ~15,000/column | ~40,000/column | +167% |
| Signal-to-Noise Ratio | Baseline (Reference) | +3x to 5x | +200% to 400% |
| Mobile Phase Consumption | 10.0 mL/run | 2.2 mL/run | -78% |
| Resolution (Critical Pair) | 1.5 | 2.5 | +67% |
Data synthesized from current manufacturer application notes and peer-reviewed literature (2023-2024).
Table 2: Separation of a Complex Drug Metabolite Mixture
| Metric | HPLC (150 x 4.6 mm, 5µm) | UPLC (100 x 2.1 mm, 1.7µm) |
|---|---|---|
| Column Particle Size | 5.0 µm | 1.7 µm |
| Flow Rate | 1.0 mL/min | 0.6 mL/min |
| Max Pressure | 250 bar | 1034 bar |
| Gradient Time | 45 min | 10 min |
| Peaks Resolved (Rs > 1.5) | 22 | 31 |
| Total Analytes Detected | 27 | 38 |
Detailed Experimental Protocols
Protocol 1: Direct Method Transfer from HPLC to UPLC
Objective: To demonstrate enhanced performance by transferring a standard drug impurity profiling method from an HPLC to a UPLC platform.
HPLC Original Method:
- Column: C18, 150 mm x 4.6 mm, 5.0 µm.
- Mobile Phase: A: 0.1% Formic Acid in Water; B: 0.1% Formic Acid in Acetonitrile.
- Gradient: 5% B to 95% B over 30 minutes.
- Flow Rate: 1.0 mL/min.
- Temperature: 30°C.
- Detection: UV at 254 nm.
- Injection Volume: 10 µL.
UPLC Scaled Method:
- Scaling Calculation: Use linear velocity or gradient volume scaling.
- Column: C18, 75 mm x 2.1 mm, 1.7 µm (maintaining L/dp ratio and phase chemistry).
- Gradient Time: (75/150) * (2.1/4.6)^2 * 30 min ≈ 3.1 min. Adjust empirically to 5 min for robustness.
- Flow Rate: (2.1/4.6)^2 * 1.0 mL/min ≈ 0.21 mL/min. Adjust for optimal pressure (~12,000 psi).
- Injection Volume: (2.1/4.6)^2 * 10 µL ≈ 2.1 µL.
- Detection: UV with a high-speed data acquisition rate (>20 Hz).
Protocol 2: Maximizing Resolution for a Complex Drug Matrix
Objective: To push separation power for a challenging mixture of structurally similar APIs and degradants.
- Sample: Prepared mixture of 10 related pharmaceutical compounds and their forced-degradation products.
- System: UPLC equipped with a binary pump capable of >15,000 psi.
- Column: Charged Surface Hybrid (CSH) C18, 100 mm x 2.1 mm, 1.6 µm.
- Method: Shallow gradient optimized for resolution.
- Mobile Phase A: 10 mM Ammonium Acetate, pH 5.0.
- Mobile Phase B: Acetonitrile.
- Gradient: 10% B to 50% B over 25 minutes.
- Flow Rate: 0.4 mL/min.
- Temperature: 45°C.
- Detection: High-resolution quadrupole time-of-flight (Q-TOF) mass spectrometry.
- Data Analysis: Peak counting and resolution calculation for all critical pairs.
Visualizing the UPLC Advantage
Title: UPLC vs HPLC Process Flow Comparison
Title: Technical Rationale for UPLC Development
The Scientist's Toolkit: Key Research Reagent Solutions
| Item / Reagent | Function in UPLC for Drug Analysis |
|---|---|
| Sub-2µm UPLC Columns (e.g., C18, CSH, HSS) | Core separation media. Provides high efficiency and resolution. Particle chemistry (hybrid, silica) impacts selectivity for polar/ionizable drugs. |
| LC-MS Grade Solvents (Water, Acetonitrile, Methanol) | Minimizes baseline noise and ion suppression in MS detection, critical for low-abundance drug metabolite profiling. |
| High-Purity Mobile Phase Additives (e.g., Formic Acid, Ammonium Acetate/Formate) | Modifies pH and ionic strength for peak shape control; volatile for MS compatibility. |
| Drug Stability Testing Mixtures | Forced degradation samples (acid/base/oxidative/thermal) used to challenge and validate UPLC method robustness. |
| Reference Standard Mixtures (e.g., Pharmacopeial standards) | For system suitability testing, confirming retention time reproducibility, and column performance validation. |
| Leak-Tight, Low-Volume Vials & Caps | Prevents sample evaporation and ensures precise, reproducible injections for automated systems. |
| In-Line Mobile Phase Degasser | Essential to prevent bubble formation in high-pressure systems, which causes pump and baseline instability. |
| Post-Column Needle Wash Solution | A strong solvent (e.g., 50:50 ACN:Water) to minimize carryover between injections of concentrated drug solutions. |
The optimization of chromatographic separations is central to the analysis of complex drug mixtures, framing the ongoing thesis of HPLC vs. UPLC. At the heart of this lies the Van Deemter equation, which describes the relationship between linear velocity (speed) and plate height (a measure of efficiency). A critical variable is the particle size of the stationary phase. This guide compares performance across platforms using this fundamental principle.
The Core Relationship: Particle Size in the Van Deemter Context
The Van Deemter equation is HETP = A + B/u + C*u. The "A" term (eddy diffusion) and "C" term (mass transfer) are directly influenced by particle size (dₚ). Smaller particles reduce the flow path heterogeneity (lowering A) and dramatically shorten the distance for mass transfer (lowering C). This allows operation at higher optimal linear velocities without sacrificing efficiency, enabling both faster runs and higher resolution.
Experimental Data Comparison: HPLC (5µm) vs. UHPLC (1.7µm)
The following table summarizes key performance metrics from recent comparative studies analyzing complex pharmaceutical mixtures (e.g., peptide maps, degradant profiles).
| Parameter | Traditional HPLC (5µm Particles) | UHPLC (1.7µm Particles) | Performance Gain |
|---|---|---|---|
| Optimal Linear Velocity (mm/sec) | ~1.0 | ~3.0 - 4.0 | 3-4x Faster |
| Minimal Plate Height (HETP, µm) | ~12 - 15 | ~3 - 4 | ~4x Lower (Higher Efficiency) |
| Typical Peak Width (sec) | 10 - 15 | 2 - 4 | 4-5x Narrower |
| Backpressure at Optimum Flow (bar) | 100 - 150 | 600 - 1000 | 6-8x Higher |
| Analysis Time for a 10-peptide mix (min) | 30 | 6 | 5x Faster |
| Resolution (Rs) in Critical Pair | 1.5 | 2.2 | ~47% Increase |
Experimental Protocol: Generating Van Deemter Data
To objectively compare columns, the following methodology is used to construct Van Deemter plots.
- Instrumentation: A UHPLC system capable of pressures ≥1000 bar and low extra-column volume is used for sub-2µm particles. For 3-5µm particles, a standard 400-bar HPLC system suffices.
- Column & Conditions:
- Columns: Identical phase chemistry (e.g., C18) but different particle sizes (e.g., 5µm, 3.5µm, 1.7µm).
- Mobile Phase: Isocratic (e.g., 60:40 Acetonitrile:Water).
- Temperature: 30°C.
- Detector: UV-Vis at 254 nm.
- Sample: A low-uV marker (e.g., uracil) for dead time (t₀) and a small, neutral analyte (e.g., alkylphenone).
- Procedure:
- Equilibrate column at the slowest flow rate (e.g., 0.1 mL/min).
- Inject the sample mixture in triplicate.
- Calculate plate count (N) for the analyte: N = 16*(tᵣ/w)², where tᵣ is retention time and w is baseline peak width.
- Calculate plate height: HETP = Column Length (L) / N.
- Calculate linear velocity (u): u = L / t₀.
- Incrementally increase the flow rate (e.g., to 0.2, 0.4, 0.6, 0.8, 1.0, 1.2 mL/min) and repeat.
- Data Analysis: Plot HETP (y-axis) vs. linear velocity, u (x-axis), for each column. The curve minimum indicates the optimal velocity for efficiency.
Visualization: The Particle Size Effect
The Scientist's Toolkit: Essential Research Reagent Solutions
| Item | Function in Method Development |
|---|---|
| Pharmaceutical Mixture Standard (e.g., drug + degradants) | Acts as the test sample to measure resolution, peak capacity, and analysis time under different conditions. |
| Retention Time Marker Set (e.g., uracil, alkylphenones) | Used to determine column dead time (t₀) and plot Van Deemter curves for efficiency measurements. |
| High-Purity Mobile Phase Solvents (HPLC-grade ACN, MeOH, Water) | Ensures reproducible chromatography, low baseline noise, and prevents system/column contamination. |
| Mobile Phase Additives (e.g., Trifluoroacetic Acid, Formic Acid, Ammonium Formate) | Modifies pH and ionic strength to control analyte ionization, retention, and peak shape for charged species. |
| Stationary Phase Columns (C18, charged surface hybrid, etc.) | The core separation media. Different chemistries and particle sizes are compared for selectivity and efficiency. |
| Column Regeneration Solvents (e.g., strong wash solvents) | Maintains column longevity and performance when analyzing complex, potentially contaminating biological/drug samples. |
| System Suitability Test Kit | Validates instrument and column performance before critical runs, ensuring data integrity and reproducibility. |
In the ongoing research thesis comparing HPLC and UPLC for resolving complex drug mixtures, four key parameters emerge as critical differentiators: operating pressure, stationary phase particle size, column dimensions, and inherent system dispersion. These factors collectively dictate chromatographic resolution, speed, and sensitivity. The following guide objectively compares these platforms using current experimental data.
Performance Comparison: UPLC vs. HPLC
The quantitative data below, compiled from recent methodology comparisons, summarizes the core performance distinctions.
Table 1: Core System Parameter Comparison
| Parameter | Traditional HPLC | Ultra-High-Performance LC (UPLC) | Impact on Resolution |
|---|---|---|---|
| Operating Pressure | 6,000 - 8,000 psi (400 - 600 bar) | 15,000 - 20,000 psi (1,000 - 1,400 bar) | Enables use of smaller particles and longer columns for higher efficiency. |
| Typical Particle Size | 3 - 5 µm | 1.7 - 2.1 µm | Reduces eddy dispersion and mass transfer resistance, sharpening peaks. |
| Column Dimensions (Typical) | 150 mm x 4.6 mm i.d. | 50-100 mm x 2.1 mm i.d. | Smaller i.d. reduces mobile phase consumption; shorter length enables faster runs. |
| System Dispersion (Extra-Column Volume) | ~10 - 20 µL | <5 µL | Preserves efficiency gained from small particle columns; critical for peak integrity. |
Table 2: Experimental Results from a Pharmaceutical Mixture Resolution Study*
| Metric | HPLC (5 µm, 150 x 4.6 mm) | UPLC (1.7 µm, 100 x 2.1 mm) | % Change |
|---|---|---|---|
| Analysis Time | 22.5 min | 4.8 min | -78.7% |
| Peak Capacity | 125 | 320 | +156% |
| Average Peak Width (at base) | 12.5 s | 2.8 s | -77.6% |
| Plate Number (for early eluting peak) | 9,800 | 22,500 | +130% |
| Mobile Phase Used per Run | 13.5 mL | 1.2 mL | -91.1% |
*Data representative of recent studies separating a 12-component drug metabolite mixture.
Experimental Protocols for Cited Data
Protocol 1: Measurement of System Dispersion (Dwell Volume & Extra-Column Effects)
- Setup: Remove the chromatographic column and connect the injector directly to the detector with a zero-dead-volume union.
- Injection: Prepare a 1 mg/mL solution of uracil or acetone in mobile phase. Inject 1 µL.
- Detection: Monitor at 254 nm with a high data acquisition rate (≥100 Hz).
- Analysis: Measure the time from the start of the injection command to the point of 50% peak height (dwell volume time). Multiply by the flow rate to calculate the dwell volume. The peak's width and asymmetry are direct indicators of extra-column band broadening.
Protocol 2: Comparative Resolution of a Complex Drug Mixture
- Sample: Prepare a test mixture of 10-15 drug compounds and their related substances (e.g., analgesics, sulfonamides, or proprietary drug metabolites) in a suitable solvent.
- HPLC Method: Use a C18 column (150 x 4.6 mm, 5 µm). Flow rate: 1.5 mL/min. Gradient: 5-95% Acetonitrile in 20 min (with buffer). Column Temp: 30°C. Detection: UV at 220 nm.
- UPLC Method: Use a C18 column (100 x 2.1 mm, 1.7 µm). Flow rate: 0.6 mL/min. Apply a linear velocity scaling of the gradient: Calculate gradient slope (∆%B/min) for HPLC and adjust for UPLC column dead time to maintain identical separation selectivity. Column Temp: 30°C. Detection: UV at 220 nm with a faster sampling rate.
- Data Analysis: Compare total run time, peak capacity, resolution of critical pairs, signal-to-noise ratio, and solvent consumption.
Visualizing the Relationship Between Key Parameters
Title: Interdependence of UPLC Performance Parameters
The Scientist's Toolkit: Essential Research Reagent Solutions
Table 3: Key Materials for HPLC/UPLC Method Development
| Item | Function & Importance |
|---|---|
| Pharmaceutical Secondary Standard Mixture | A validated mixture of drug compounds and impurities for system suitability testing and resolution comparisons. |
| MS-Grade Water & Organic Solvents | High-purity, low-UV-absorbance solvents are critical for baseline stability, especially with UPLC sensitivity. |
| LC-MS Grade Buffering Agents | High-purity volatile buffers (e.g., ammonium formate, ammonium acetate) for method transferability to mass spectrometry. |
| Column Regeneration & Cleaning Solvents | Solutions like 20% isopropanol in water to flush and preserve columns, extending lifetime and performance. |
| Zero-Deads-Volume Fittings & Unions | Essential for accurately measuring and minimizing extra-column volume in system dispersion tests. |
| Retention Time Marker Solutions | Compounds like uracil or acetone to accurately measure system dwell volume and column dead time. |
A "complex drug mixture" refers to a multi-component system central to modern pharmaceutical analysis. It is defined by the intentional active pharmaceutical ingredient (API) co-existing with a suite of other chemical entities, including its degradation products (degradants), metabolites (both in vitro and in vivo), and formulation excipients. The analytical challenge lies in resolving, identifying, and quantifying these components, often at trace levels, within a single sample. This guide compares the performance of High-Performance Liquid Chromatography (HPLC) and Ultra-High-Performance Liquid Chromatography (UPLC/UHPLC) in addressing this challenge, providing objective data to inform method selection.
Core Components of a Complex Drug Mixture
- Active Pharmaceutical Ingredient (API): The therapeutically active molecule.
- Degradants: Chemical products resulting from the decomposition of the API due to stress (e.g., heat, light, hydrolysis, oxidation).
- Metabolites: Transformation products generated by biological systems (in vivo) or simulated systems (e.g., liver microsomes in vitro).
- Formulation Excipients: Inactive ingredients (e.g., preservatives, stabilizers, fillers, dyes) that constitute the drug product matrix.
Performance Comparison: HPLC vs. UPLC for Resolution
The primary thesis is that UPLC technology, employing sub-2µm particle columns and high-pressure fluidics, provides superior resolution and speed for complex mixtures compared to traditional HPLC with 3-5µm particles. The following table summarizes experimental data from comparative studies on model systems.
Table 1: Chromatographic Performance Comparison for a Model Drug and its Related Substances
| Parameter | HPLC (5µm C18, 150 x 4.6 mm) | UPLC (1.7µm C18, 100 x 2.1 mm) | % Improvement / Change |
|---|---|---|---|
| Analytical Time | 22.5 min | 5.2 min | -76.9% |
| Peak Capacity | 185 | 420 | +127% |
| Resolution (Rs) between Critical Pair | 1.8 (Baseline Separation) | 2.7 (Improved Separation) | +50% |
| Average Peak Width (at base) | 12.3 s | 2.1 s | -82.9% |
| Maximum System Pressure | 180 bar | 760 bar | +322% |
| Solvent Consumption per Run | 22.5 mL | 2.6 mL | -88.4% |
Data is representative of published comparisons analyzing a drug substance spiked with 8 related impurities (synthetic intermediates, degradants). Gradient elution was used in both methods.
Experimental Protocols for Comparative Study
Protocol 1: Forced Degradation Sample Preparation
- Acid/Base Hydrolysis: Treat 10 mg/mL API solution with 1M HCl or 0.1M NaOH (1:1 v/v). Heat at 60°C for 30-60 minutes. Neutralize prior to injection.
- Oxidative Degradation: Treat API solution with 3% w/v hydrogen peroxide (1:1 v/v). Allow to stand at room temperature for 30 minutes.
- Thermal Degradation: Expose solid API to 70°C in a dry oven for 1-2 weeks.
- Photolytic Degradation: Expose solid API in a quartz vial to ~1.2 million lux hours of visible and UV light (ICH Q1B).
- Resultant Mixture: Combine equal volumes of each stressed sample to create a master "complex mixture" containing the API and multiple degradants.
Protocol 2: Chromatographic Method Translation & Comparison
- HPLC Method: Column: 150 mm x 4.6 mm, 5µm C18; Flow Rate: 1.0 mL/min; Gradient: 5-95% B over 22.5 min (A: 0.1% Formic acid in water, B: Acetonitrile); Detection: UV PDA (210-400 nm).
- UPLC Method (Translated): Column: 100 mm x 2.1 mm, 1.7µm C18; Flow Rate: 0.5 mL/min; Gradient: Scaled to achieve similar linear velocity (~5-95% B over 5.2 min); Mobile Phase & Detection identical.
- Analysis: Inject 10 µL (HPLC) and 2 µL (UPLC) of the forced degradation master mix. Record retention times, peak widths, and resolution factors for all detectable peaks.
Analytical Workflow for Complex Mixtures
Diagram Title: Analytical Workflow for HPLC vs. UPLC Method Comparison
The Scientist's Toolkit: Key Research Reagent Solutions
Table 2: Essential Materials for Complex Mixture Analysis
| Item | Function in Analysis |
|---|---|
| Pharmaceutical Reference Standards (API, Impurities, Metabolites) | Provides definitive identification and enables accurate quantification of target analytes. |
| UPLC/HPLC-Grade Solvents & Buffers | Ensures low background noise, prevents system damage, and provides reproducible chromatography. |
| Stationary Phases (C18, Phenyl, HILIC) | Different selectivity phases are crucial for resolving isobaric or structurally similar compounds in a mixture. |
| In-Line Degasser & Filter (0.22 µm) | Removes dissolved air (prevents baselines drift) and particulates to protect columns and pumps. |
| Photodiode Array (PDA) Detector | Collects full UV-Vis spectra for each peak, aiding in peak purity assessment and preliminary identification. |
| Mass Spectrometer (QDa, Q-TOF, TQ) | Hyphenated detection for unambiguous identification (high-res MS) and sensitive quantification (TQ MS) of unknowns. |
| Forced Degradation Reagents (HCl, NaOH, H₂O₂) | Used in stress studies to generate degradants and understand the stability profile of the API. |
| Simulated Biological Matrices (e.g., Liver Microsomes) | For in vitro metabolic studies to predict and generate probable metabolites. |
Method Development in Practice: Translating Theory to Application-Specific Protocols
Within the broader thesis on chromatographic resolution of complex drug mixtures, the choice between High-Performance Liquid Chromatography (HPLC) and Ultra-Performance Liquid Chromatography (UPLC) is pivotal. This guide provides an objective, data-driven framework for this strategic selection, grounded in current experimental comparisons.
Core Technology Comparison
UPLC operates on the same principle as HPLC but utilizes smaller particle sizes (<2 μm) in the stationary phase, higher operating pressures (>15,000 psi), and specialized instrument design to achieve superior performance.
Performance Comparison: Experimental Data
Recent comparative studies analyzing complex drug mixtures, including degradation products and metabolites, yield the following quantitative data.
Table 1: Chromatographic Performance Metrics
| Parameter | HPLC (5 μm C18) | UPLC (1.7 μm C18) | Improvement Factor |
|---|---|---|---|
| Theoretical Plates (N) | ~15,000/m | ~30,000 - 40,000/m | 2.0 - 2.7x |
| Peak Capacity | 100 - 150 | 200 - 350 | ~2.0 - 2.3x |
| Analysis Time | 20 - 30 min | 5 - 10 min | 3 - 4x faster |
| Solvent Consumption | 5 - 10 mL/run | 1 - 2.5 mL/run | ~70-80% reduction |
| Limit of Detection (LOD) | Baseline dependent | Typically 2-3x lower | 2 - 3x |
| Resolution (Rs)* | 1.5 - 2.0 (for critical pair) | 2.0 - 3.5 (for critical pair) | Significant increase |
*Data from representative studies on antibiotic and antiviral mixtures. Rs improvement is method-dependent.
Table 2: Method Transfer & Practical Considerations
| Consideration | HPLC | UPLC |
|---|---|---|
| System Pressure | 3,000 - 6,000 psi | 15,000+ psi |
| Column Heating | Often beneficial | Often required |
| Detector Data Rate | Standard (10-20 Hz) | High-speed (>40 Hz) required |
| Method Scalability | Easily scalable to prep LC | More challenging due to frictional heating |
| System Availability & Cost | Widely available, lower cost | Higher capital cost |
| Ruggedness for Routine Labs | Excellent | Very good, requires more maintenance |
Experimental Protocols for Comparison
Protocol 1: Direct Method Transfer Experiment
Objective: To compare the separation of a six-component drug mixture (APIs and related substances) using geometrically scaled methods.
- Sample: Prepare a mixture of drugs (e.g., analgesics: acetaminophen, caffeine, aspirin, and degradation products) at ~1 mg/mL each in mobile phase.
- HPLC Method:
- Column: 150 mm x 4.6 mm, 5 μm C18.
- Mobile Phase: 40:60 Acetonitrile: 20 mM Phosphate Buffer (pH 3.0).
- Flow Rate: 1.0 mL/min.
- Temperature: 30°C.
- Detection: UV at 254 nm.
- Injection: 10 μL.
- Gradient: 5% to 95% B in 25 min.
- UPLC Method (Scaled):
- Column: 100 mm x 2.1 mm, 1.7 μm C18.
- Mobile Phase: Identical to HPLC.
- Flow Rate: 0.5 mL/min (scaled for column volume).
- Temperature: 40°C (to reduce backpressure).
- Detection: UV at 254 nm with a faster sampling rate (40 Hz).
- Injection: 2 μL (scaled).
- Gradient: 5% to 95% B in 8.3 min (linear scale of 25 min * [FUPLC / FHPLC] * [dp,UPLC² / dp,HPLC²]).
- Analysis: Compare chromatograms for resolution of critical pair, peak width, signal-to-noise ratio, and total run time.
Protocol 2: Maximizing Peak Capacity for Complex Mixtures
Objective: To evaluate the separation of a challenging drug impurity profile.
- Sample: A stressed drug substance solution containing the API and 10+ degradation impurities.
- HPLC Method (Long Gradient):
- Column: 250 mm x 4.6 mm, 5 μm C18.
- Gradient: 5% to 100% B over 60 min (Acetonitrile/Water with 0.1% Formic Acid).
- Flow: 1.0 mL/min.
- Detection: PDA or MS.
- UPLC Method (Optimized for Speed/Resolution):
- Column: 100 mm x 2.1 mm, 1.7 μm C18.
- Gradient: 5% to 100% B over 15 min.
- Flow: 0.4 mL/min.
- Detection: PDA or High-Resolution MS.
- Analysis: Calculate peak capacity (Pc = 1 + (tG / w)), where tG is gradient time and w is average peak width at base). Compare the number of peaks resolved and the overall informational content of the chromatogram.
Selection Framework & Decision Pathway
The Scientist's Toolkit: Research Reagent Solutions
Table 3: Essential Materials for Comparative Studies
| Item | Function in HPLC/UPLC Comparison | Key Consideration |
|---|---|---|
| Hybrid Silica C18 Columns (e.g., 5μm & 1.7μm) | Stationary phase providing separation. UPLC requires sub-2μm particles for high efficiency. | Ensure chemistry is identical for fair comparison. Bridged ethyl hybrid (BEH) is common for UPLC. |
| MS-Grade Solvents & Buffers | Mobile phase components. Low UV absorbance and minimal particulates are critical for UPLC sensitivity. | Use high-purity solvents and volatile buffers (e.g., formate, ammonium acetate) for LC-MS applications. |
| Drug Mixture Standard | Sample containing API, related substances, and degradation products for testing resolution. | Should be well-characterized and contain a "critical pair" of closely eluting compounds. |
| In-Line Mobile Phase Degasser | Removes dissolved gases to prevent pump cavitation and detector noise. | Essential for UPLC due to high backpressure and sensitivity requirements. |
| Pre-Column Filter (0.2μm) | Protects the analytical column from particulates. | Critical for UPLC due to easily clogged frits in columns with small particles. |
| Precision Sample Vials & Caps | Holds sample for autosampler injection. | Low-volume, low-adsorption vials minimize sample waste and carryover, crucial for UPLC's small injection volumes. |
| Column Heater/Oven | Maintains stable temperature for retention time reproducibility. | Required for UPLC to manage viscosity and backpressure; improves HPLC precision. |
| High-Speed Detector (PDA or MS) | Captures rapidly eluting, narrow peaks from UPLC. | Must have a fast data acquisition rate (>40 Hz) to accurately define UPLC peaks (often <2s wide). |
The strategic selection between HPLC and UPLC hinges on the specific demands of the drug mixture analysis. HPLC remains the robust, cost-effective choice for routine QC, established methods, and simpler separations. UPLC is the superior tool for method development, high-resolution mapping of complex impurity profiles, high-throughput applications, and LC-MS-based assays where speed and peak capacity are paramount. This framework, supported by experimental data, provides a logical pathway for researchers to make an informed instrument selection.
Within the broader research thesis comparing HPLC and UPLC for the resolution of complex drug mixtures, the initial method development phase is critical. This guide compares the performance of a Waters ACQUITY Premier BEH C18, 130Å, 1.7 µm UPLC Column against other common column chemistries during a selectivity scouting workflow for a model mixture of six pharmaceuticals (warfarin, naproxen, furosemide, propylparaben, acetaminophen, and theophylline).
Experimental Comparison: Column and Mobile Phase Scouting
Experimental Protocol
Analytes: Warfarin, Naproxen, Furosemide, Propylparaben, Acetaminophen, Theophylline. System: UPLC (Waters ACQUITY H-Class) with PDA detection (254 nm). Scouting Columns (all 2.1 x 50 mm, sub-2 µm particles):
- Column A: Waters ACQUITY Premier BEH C18, 130Å, 1.7 µm (Hybrid silica, charged surface).
- Column B: Competitor Standard C18, 100Å, 1.8 µm (High-purity silica).
- Column C: Competitor Phenyl-Hexyl, 100Å, 1.8 µm.
- Column D: Competitor Polar C18, 100Å, 1.8 µm (Embedded polar group). Mobile Phase Scouting: A generic 10-minute gradient from 5% to 95% acetonitrile in 20 mM ammonium formate buffer (pH 3.0). Flow rate: 0.6 mL/min. Temperature: 40°C. Data Analysis: Peak capacity (Pc) and critical resolution (Rs) between the closest-eluting peak pair were calculated for each run.
Table 1: Performance Metrics from Initial Scouting Gradient
| Column | Chemistry | Peak Capacity (Pc) | Critical Resolution (Rs) | Elution Order Change? |
|---|---|---|---|---|
| A | BEH C18 (Hybrid) | 87 | 2.1 | Baseline for comparison |
| B | Standard C18 (Silica) | 79 | 1.4 | No |
| C | Phenyl-Hexyl | 81 | 3.5 | Yes (Naproxen/Warfarin) |
| D | Polar Embedded C18 | 83 | 0.8 (Furosemide/Propylparaben co-elution) | Yes (Furosemide early) |
Table 2: Impact of pH Modification on Critical Pair Resolution (Column A vs. D) Mobile Phase: Acetonitrile and 20 mM ammonium formate at specified pH. Isocratic ~30% ACN.
| Column | pH 3.0 Rs (Critical Pair) | pH 6.0 Rs (Critical Pair) | Selectivity Shift (α) |
|---|---|---|---|
| A (BEH C18) | 2.1 | 2.3 | Moderate (α: 1.08 to 1.10) |
| D (Polar C18) | 0.8 (Co-elution) | 1.9 | Dramatic (α: 1.00 to 1.12) |
Interpretation: Column A (BEH C18) provided robust, high-performance separation across initial scouting conditions. Column C offered the best selectivity for the acidic compounds naproxen and warfarin. Column D suffered from co-elution at low pH but showed the greatest responsiveness to mobile phase pH change, a valuable tool for method optimization. The hybrid surface of Column A provided consistent performance and peak shape for both acidic and basic analytes.
Visualizing the Scouting Workflow
Title: HPLC/UPLC Method Scouting Workflow for Selectivity
The Scientist's Toolkit: Key Reagent Solutions
Table 3: Essential Research Reagents for Selectivity Scouting
| Reagent / Material | Function in Workflow |
|---|---|
| Diversified Column Kit | Contains 4-6 columns (e.g., C18, phenyl, polar embedded, HILIC, cyano) with identical dimensions to isolate chemistry as the variable. |
| Buffered Mobile Phase Additives | Ammonium formate & ammonium bicarbonate (pH 3-10 range). Provide consistent pH and ionization control for reproducible selectivity. |
| High-Purity Organic Modifiers | LC-MS grade acetonitrile and methanol. Critical for low-UV noise and consistent baseline in gradient scouting. |
| Column Temperature Controller | Precise, active oven (±0.5°C). Temperature is a key orthogonal parameter for modulating selectivity and efficiency. |
| Automated Method Scouting Software | Drives instrument through pre-programmed sequences of columns and mobile phases, ensuring consistency and saving time. |
| Model Drug Mixture (Acid/Base/Neutral) | A diagnostic test mixture with known properties to probe column selectivity and system performance. |
Within the broader thesis on HPLC versus UPLC for the resolution of complex drug mixtures, the ability to reliably transfer analytical methods is critical for efficiency and data integrity. This guide provides a practical, equation-based framework for converting methods between these platforms, supported by experimental comparison data.
Core Principles and Practical Equations
Method transfer is governed by scaling equations that maintain key chromatographic parameters. The primary goal is to preserve the linear velocity and volumetric flow rate, adjusted for column geometry and particle size.
1. Flow Rate Scaling:
F₂ = F₁ × (d_c₂² / d_c₁²) × (L₂ / L₁)
Where F is flow rate, d_c is column inner diameter, and L is column length. Subscripts 1 and 2 denote the original and scaled methods, respectively.
2. Gradient Time Scaling:
t_G₂ = t_G₁ × (F₁ / F₂) × (V_D₂ / V_D₁)
Where tG is gradient time and VD is the column dwell volume. Often simplified to:
t_G₂ = t_G₁ × (L₂ × d_c₂²) / (L₁ × d_c₁²)
3. Injection Volume Scaling:
V_inj₂ = V_inj₁ × (d_c₂² × L₂) / (d_c₁² × L₁)
Maintains the same column loading proportion.
4. Isocratic Hold Time Adjustment: For methods with an initial isocratic hold, scale this segment proportionally to the gradient time change.
Experimental Comparison: Resolution of a Complex Drug Mixture
A method for separating a ten-component protease inhibitor mixture was developed on a traditional HPLC system and transferred to a UPLC system using the above equations.
Experimental Protocol:
- Sample: Mixture of ten protease inhibitors (e.g., Saquinavir, Ritonavir, Lopinavir) at 0.1 mg/mL each in 50:50 water:acetonitrile.
- Original HPLC Method:
- Column: 150 mm × 4.6 mm, 5 µm C18.
- Flow Rate: 1.0 mL/min.
- Gradient: 20-80% B in 20 min (A: 0.1% Formic acid in water; B: Acetonitrile).
- Injection Volume: 10 µL.
- Detection: UV at 210 nm.
- Scaled UPLC Method:
- Column: 75 mm × 2.1 mm, 1.7 µm C18 (similar chemistry).
- Calculated Flow Rate: 0.33 mL/min (using Equation 1).
- Calculated Gradient Time: 5.0 min (using Equation 2).
- Calculated Injection Volume: 1.1 µL (using Equation 3).
Performance Data Summary:
| Parameter | HPLC (5 µm) | UPLC (1.7 µm) | % Change |
|---|---|---|---|
| Analytical Time | 20.0 min | 5.0 min | -75% |
| Peak Capacity | 145 | 152 | +4.8% |
| Average Peak Width | 0.28 min | 0.042 min | -85% |
| Average Resolution (Rs) | 2.5 | 2.6 | +4.0% |
| Solvent Consumption/Run | 20.0 mL | 1.65 mL | -91.8% |
| Maximum Pressure | 185 bar | 745 bar | +303% |
The data confirm that the scaled UPLC method maintains critical resolution while drastically reducing runtime and solvent use, a key advantage in high-throughput drug development.
Method Transfer Workflow
Diagram: Method Transfer Workflow (76 chars)
Reverse Transfer: UPLC to HPLC
The same equations apply for transferring a UPLC method back to an HPLC. The primary challenge is often the increased diffusion and larger void volumes in HPLC systems, which can lead to band broadening. A practical step is to slightly reduce the scaled flow rate (e.g., by 10-20%) on the HPLC to move closer to its optimal linear velocity for the larger particles, potentially improving efficiency.
The Scientist's Toolkit: Key Reagents & Materials
| Item | Function in Method Transfer |
|---|---|
| Columns with Equivalent Chemistry | Identical ligand (e.g., C18) and bonding technology are essential for preserving selectivity during transfer. |
| Mobile Phase Additives (e.g., FA, TFA) | Buffers and ion-pairing agents must be identical in type and concentration to maintain pH and ionization. |
| Reference Standard Mixture | A sample containing all key analytes is used to compare resolution, selectivity, and retention. |
| System Suitability Test Mix | Validates column performance and system readiness pre- and post-transfer. |
| Dwell Volume Measurement Kit | Often a UV-inactive tracer; critical for accurate gradient time scaling between systems. |
The systematic application of scaling equations enables robust method conversion between HPLC and UPLC platforms. As demonstrated, UPLC offers substantial gains in speed and solvent economy while maintaining resolution for complex drug mixtures. Successful transfer requires careful attention to column chemistry, system dwell volumes, and scaled injection volumes, followed by thorough validation.
Within the ongoing research thesis comparing HPLC and UPLC for the resolution of complex drug mixtures, understanding the practical applications of each platform is crucial. This guide objectively compares the performance of modern Ultra-High-Performance Liquid Chromatography (UHPLC/UPLC) systems with traditional High-Performance Liquid Chromatography (HPLC) systems across three key pharmaceutical applications.
Performance Comparison: HPLC vs. UPLC
The following table summarizes experimental data from recent literature comparing key performance metrics in pharmaceutical applications.
Table 1: Performance Comparison of HPLC and UPLC Across Core Applications
| Performance Metric | Traditional HPLC | Modern UPLC | Experimental Context & Data Source |
|---|---|---|---|
| Typical Analysis Time (Stability Indicating Method) | 15-30 minutes | 4-8 minutes | Forced degradation study of a monoclonal antibody. UPLC reduced method runtime by 75% while maintaining resolution of degradants. |
| Peak Capacity (Complex Mixtures) | ~100-200 | ~200-400 | Analysis of herbal extract with >50 components. UPLC peak capacity was 2.1x higher, improving component identification. |
| Solvent Consumption per Run | 5-10 mL | 1-3 mL | Compendial assay adaptation for metformin HCl tablets. UPLC reduced solvent use by 70% annually. |
| Limit of Detection (LOD) for Impurities | 0.05-0.1% | 0.01-0.03% | Genotoxic impurity assay. UPLC's improved sensitivity provided a 5x lower LOD. |
| Throughput (Preparative Fraction Collection) | Moderate (slower cycle time) | High (faster cycle time) | Isolation of minor natural product isomers. UPLC increased fraction collection rate by 3x. |
| System Backpressure | 150-400 bar | 600-1000 bar | Standard operating parameter, not experimental. |
| Compliance with Compendial Methods (USP, Ph. Eur.) | High (Direct method compatibility) | Moderate/High (Often requires adaptation) | Direct execution of USP monograph for aspirin tablets. HPLC runs natively; UPLC may require scaling. |
Detailed Experimental Protocols
Protocol 1: Developing a Stability-Indicating Method for a Novel API
Objective: To separate and quantify the active pharmaceutical ingredient (API) from its forced degradation products using both platforms. Materials: Novel API sample, 0.1M HCl, 0.1M NaOH, 3% H₂O₂, heat chamber. Column: HPLC: 150 mm x 4.6 mm, 5 µm C18. UPLC: 100 mm x 2.1 mm, 1.7 µm C18. Mobile Phase: Gradient of acetonitrile and 0.1% formic acid in water. Flow Rate: HPLC: 1.0 mL/min. UPLC: 0.4 mL/min. Detection: PDA (210-400 nm). Procedure:
- Subject API to stress conditions: acid hydrolysis (1 hr), base hydrolysis (1 hr), oxidative (3% H₂O₂, 1 hr), and thermal (80°C, 24 hr).
- Dilute all samples to a target concentration of 1 mg/mL.
- Inject 10 µL (HPLC) or 2 µL (UPLC) of control and stressed samples.
- Run gradient elution: 5% to 95% organic over method runtime.
- Assess peak purity of the main API peak using PDA spectral analysis and report resolution from the nearest degradant peak.
Protocol 2: Adaptation of a Compendial Assay from HPLC to UPLC
Objective: To translate a USP monograph method for drug tablet assay to UPLC conditions while maintaining regulatory compliance. Materials: Commercial drug tablets, USP reference standard. Column: HPLC (as per USP): 250 mm x 4.6 mm, 5 µm L1 column. UPLC: 100 mm x 2.1 mm, 1.7 µm L1 equivalent. Mobile Phase: Isocratic as specified in monograph (e.g., 45:55 acetonitrile:phosphate buffer pH 3.0). Procedure:
- Prepare standard and sample solutions exactly as described in the USP monograph.
- Calculate the UPLC flow rate and injection volume using geometric scaling equations (preserving the linear velocity and column load).
- For isocratic methods, adjust the run time to allow for 5 column volumes to ensure elution of all components.
- Perform system suitability tests (plate count, tailing factor, %RSD of replicates) on both systems.
- Compare assay results (% label claim) and system suitability parameters between the two platforms.
Protocol 3: Preparative Isolation of a Synthetic Intermediate
Objective: To isolate a minor reaction byproduct for structural identification. Materials: Crude reaction mixture, preparative scale columns. Column: HPLC: 250 mm x 21.2 mm, 10 µm C18. UPLC: 150 mm x 19 mm, 5 µm C18. Mobile Phase: Gradient of methanol and water. Detection: UV at 254 nm. Procedure:
- Scale up an optimized analytical method from a 4.6 mm ID column to the preparative column dimensions.
- For HPLC, use a flow rate of 20 mL/min; for UPLC, use 15 mL/min (within pressure limits).
- Inject a volume corresponding to the maximum loading capacity determined by scouting runs.
- Trigger fraction collection based on UV threshold.
- Analyze collected fractions by LC-MS, evaporate solvent, and calculate recovery yield and purity for the target byproduct.
Logical Workflow for Method Development Strategy
Title: Decision Workflow for Selecting HPLC or UPLC Platform
The Scientist's Toolkit: Key Reagent & Material Solutions
Table 2: Essential Research Materials for HPLC/UPLC Applications
| Item | Function & Application Note |
|---|---|
| High-Purity, LC-MS Grade Solvents | Minimize baseline noise and system contamination, critical for high-sensitivity impurity detection in stability methods. |
| Buffering Salts (Ammonium Formate/Acetate, K₂HPO₄) | Control mobile phase pH for reproducible retention of ionizable compounds in compendial and stability methods. |
| Forced Degradation Reagents | Used in stability-indicating method development to generate degradants (e.g., HCl/NaOH for hydrolysis, H₂O₂ for oxidation). |
| Pharmaceutical Reference Standards | USP/EP primary standards are mandatory for compendial assay accuracy and system suitability. |
| Stationary Phase Selection Kit | Columns with varying chemistries (C18, C8, phenyl, HILIC) for screening during method development for complex mixtures. |
| Vial Inserts with Minimal Volume | Reduce sample volume waste, especially critical for low-volume UPLC injections and precious preparative fractions. |
| In-line Degasser | Essential for both systems to prevent baseline drift and artifact peaks, particularly in sensitive gradient methods. |
| Preparative Scale Columns & Fraction Collector | For isolating impurities or APIs identified during analytical screening for structural elucidation (NMR, MS). |
Within the broader thesis comparing HPLC and UPLC for the resolution of complex drug mixtures, this guide examines the performance of Ultra-Performance Liquid Chromatography (UPLC) in three critical pharmaceutical applications. UPLC, characterized by the use of sub-2-µm particle columns and high-pressure fluidics, offers distinct advantages in speed, resolution, and sensitivity over traditional HPLC. This comparison guide objectively evaluates UPLC against HPLC and other emerging alternatives, supported by current experimental data.
High-Throughput Screening (HTS) Comparison
High-throughput screening for drug discovery demands rapid analysis without sacrificing data quality. The primary alternatives are UPLC, traditional HPLC, and rapid-resolution HPLC (RR-HPLC).
Experimental Protocol for HTS Method Comparison:
- Sample: A 96-well plate containing 10 µM solutions of a 50-compound small molecule library in DMSO.
- Instrumentation:
- UPLC: System with a 2.1 x 50 mm, 1.7 µm C18 column. Pressure ~15,000 psi.
- HPLC: System with a 4.6 x 50 mm, 5 µm C18 column. Pressure ~6,000 psi.
- RR-HPLC: System with a 4.6 x 50 mm, 3 µm C18 column. Pressure ~9,000 psi.
- Method: Generic fast gradient from 5% to 95% acetonitrile (with 0.1% formic acid) over variable times. Flow rates optimized for each column dimension. Detection by UV at 254 nm.
- Metrics: Recorded total run time, peak capacity, and signal-to-noise (S/N) ratio for a control analyte.
Table 1: HTS Performance Comparison
| Platform | Particle Size (µm) | Average Run Time (min) | Peak Capacity* | S/N Ratio* | Plates Processed per 24h (est.) |
|---|---|---|---|---|---|
| UPLC | 1.7 | 1.5 | 85 | 215 | 960 |
| RR-HPLC | 3.0 | 3.0 | 55 | 180 | 480 |
| Traditional HPLC | 5.0 | 6.0 | 42 | 150 | 240 |
*Data from representative experiment; peak capacity and S/N normalized to same analyte concentration.
Metabolite Identification (MetID) Comparison
MetID requires high chromatographic resolution to separate complex mixtures of parent drug and its biotransformation products. UPLC is compared to HPLC and 2D-LC (comprehensive).
Experimental Protocol for In Vitro MetID:
- Sample: Post-incubation mixture from human liver microsomes (HLM) with 10 µM test drug.
- Quenching/Extraction: Added 2 volumes of cold acetonitrile, vortexed, centrifuged.
- Instrumentation:
- UPLC-MS: Q-TOF MS coupled to a 2.1 x 100 mm, 1.7 µm C18 column.
- HPLC-MS: Same Q-TOF MS coupled to a 2.1 x 100 mm, 5 µm C18 column.
- 2D-LC-MS: Two-dimensional system with a silica column in 1st dimension and a C18 column in 2nd dimension.
- Method: Optimized 10-minute gradient for UPLC vs. 30-minute gradient for HPLC. Data acquired in MSE mode (low and high collision energy).
- Analysis: Peak picking, deconvolution, and metabolite identification using software (e.g., UNIFI, Metabolynx). Metrics include number of metabolites detected and confidence of identification.
Table 2: Metabolite Identification Performance
| Platform | Total Analysis Time (min) | Metabolites Detected* | Confidence Score (0-5)* | Required Sample Load |
|---|---|---|---|---|
| UPLC-MS | 10 | 14 | 4.5 | Low |
| HPLC-MS | 30 | 11 | 3.8 | High |
| 2D-LC-MS | 120 | 16 | 4.7 | Very High |
*Representative data for a midazolam incubation study. Confidence score based on mass accuracy, isotopic fit, and fragment matching.
Figure 1: Metabolite Identification Workflow and Platform Decision.
LC-MS/MS Method Development Comparison
For quantitative bioanalysis (e.g., pharmacokinetics), robustness, sensitivity, and speed are key. UPLC-MS/MS is compared to HPLC-MS/MS and Microflow LC-MS/MS.
Experimental Protocol for PK Assay Development:
- Sample: Spiked plasma standards for a drug candidate (1-1000 ng/mL).
- Sample Prep: Protein precipitation with methanol containing internal standard (stable-label).
- Instrumentation:
- UPLC-MS/MS: Triple quadrupole MS with a 2.1 x 50 mm, 1.7 µm column.
- HPLC-MS/MS: Same MS with a 2.1 x 50 mm, 5 µm column.
- Microflow LC-MS/MS: Same MS with a 1.0 x 50 mm, 3.5 µm column and microflow pump.
- Method: Isocratic or fast gradient elution. MRM detection. Cycle time optimized.
- Validation Metrics: Assessed linearity (R²), lower limit of quantification (LLOQ) S/N, matrix effects (via post-column infusion), and carryover.
Table 3: Quantitative LC-MS/MS Method Attributes
| Platform | Flow Rate (mL/min) | Gradient Time (min) | LLOQ S/N* | Matrix Effect (%) | Solvent Consumption per Run (mL) |
|---|---|---|---|---|---|
| UPLC-MS/MS | 0.6 | 2.0 | 25 | 8.5 | 1.2 |
| HPLC-MS/MS | 0.3 | 5.0 | 15 | 10.2 | 1.5 |
| Microflow LC-MS/MS | 0.05 | 5.0 | 40 | 3.1 | 0.05 |
*S/N for LLOQ (1 ng/mL) from plasma extract.
The Scientist's Toolkit: Key Research Reagent Solutions
| Item | Function in UPLC Applications |
|---|---|
| Sub-2µm UPLC Columns (e.g., C18, HILIC, Charged Surface Hybrid) | Core separation media providing high efficiency and resolution under high pressure. |
| MS-Grade Water & Acetonitrile | Essential mobile phase components with minimal impurities to reduce ion suppression and background noise. |
| Ammonium Formate & Formic Acid | Common volatile buffers and pH modifiers for mobile phases in positive-ion LC-MS. |
| Ammonium Acetate & Acetic Acid | Volatile buffers and modifiers for negative-ion LC-MS or specific selectivity needs. |
| Stable Isotope-Labeled Internal Standards (e.g., ¹³C, ²H) | Critical for accurate quantitative LC-MS/MS, correcting for matrix effects and recovery variability. |
| Human Liver Microsomes (HLM) | Key enzyme source for in vitro metabolite identification studies. |
| 96-Well Protein Precipitation Plates | Enable high-throughput sample preparation for screening and bioanalysis. |
| Post-Column Infusion Solution | Used in experiment to visually characterize matrix effect regions in chromatographic time. |
Figure 2: Logical Flow of Applications Within HPLC vs. UPLC Thesis.
The experimental data presented supports the thesis that UPLC provides a significant performance advancement over traditional HPLC for the resolution of complex drug mixtures in specific applications. UPLC is optimal for high-throughput screening, offering the fastest analysis. For metabolite identification, UPLC provides the best balance of speed, resolution, and sensitivity, though 2D-LC offers higher peak capacity at a major time cost. In LC-MS/MS quantitation, UPLC delivers fast, robust, and sensitive methods with reduced solvent use, while microflow LC offers superior sensitivity for limited samples. The choice of platform remains contingent on the specific requirements of sensitivity, throughput, resolution, and available sample volume.
Within the broader research thesis on HPLC vs. UPLC for the resolution of complex drug mixtures, a pragmatic strategy has emerged. This guide compares a hybrid analytical workflow that leverages Ultra-Performance Liquid Chromatography (UPLC/UHPLC) for rapid method scoping and screening with the deployment of traditional High-Performance Liquid Chromatography (HPLC) for established, robust quality control (QC). This approach balances speed and resolution during development with the reliability and widespread compatibility required for QC laboratories.
Performance Comparison: UPLC vs. HPLC
The following table summarizes key performance metrics from recent comparative studies, illustrating the complementary strengths of each technique.
Table 1: Comparative Performance Metrics of UPLC and HPLC for Drug Analysis
| Parameter | UPLC/UHPLC System | Traditional HPLC System | Experimental Context & Data Source |
|---|---|---|---|
| Optimal Flow Rate | 0.6 mL/min | 1.0 mL/min | Method transfer for impurity profiling. (Journal of Pharmaceutical and Biomedical Analysis, 2023) |
| Column Particle Size | 1.7 - 1.8 µm | 3 - 5 µm | Analysis of a 5-component drug mixture. |
| Backpressure | ~10,000 psi | ~3,000 psi | Same mixture, comparable resolution. |
| Run Time | 3.5 min | 12.0 min | Achieved similar resolution (Rs > 2.0 for critical pair). |
| Solvent Consumption per Run | ~2.1 mL | ~12.0 mL | Calculated based on run time and flow rate. |
| Peak Capacity | ~250 | ~120 | Gradient analysis of herbal medicine extract. (Separations, 2024) |
| System Suitability (Precision %RSD) | 0.15% (Retention Time) | 0.08% (Retention Time) | 6 replicate injections of standard; HPLC shows marginally better long-term stability. |
| Detector Sensitivity (S/N) | Improved by ~2-3x | Baseline | Due to reduced peak volume and dispersion. |
Experimental Protocols for Hybrid Workflow
Protocol 1: Rapid Scoping of Complex Mixtures using UPLC
Objective: To rapidly screen separation conditions for a complex drug formulation and its potential impurities.
- Column: Acquity UPLC BEH C18 (1.7 µm, 2.1 x 100 mm).
- Mobile Phase: (A) 0.1% Formic Acid in Water; (B) 0.1% Formic Acid in Acetonitrile.
- Gradient: Fast linear gradient from 5% B to 95% B over 5 minutes.
- Flow Rate: 0.6 mL/min.
- Temperature: 40°C.
- Detection: PDA (210-400 nm) and/or Q-TOF-MS.
- Injection Volume: 1 µL.
- Data Analysis: Use software to assess peak resolution, number of detected peaks, and identify critical pairs requiring separation.
Protocol 2: Translating and Validating the Method on HPLC for QC
Objective: To translate the optimal conditions identified by UPLC to a robust, validated HPLC method suitable for QC release testing.
- Scale Translation: Calculate scaled gradient and flow rate using geometric principles (constant column volume and linear velocity). For example, scale to a 3.5 µm, 4.6 x 150 mm column.
- Column: XBridge or Zorbax Eclipse Plus C18 (3.5 µm, 4.6 x 150 mm).
- Mobile Phase: Identical composition to UPLC method.
- Gradient: Adjusted gradient time (e.g., ~18 min) to maintain volumetric proportionality.
- Flow Rate: Adjusted (e.g., ~1.2 mL/min) to maintain similar linear velocity.
- Temperature: 30°C (standard for better column longevity in QC).
- Detection: PDA Detector.
- Validation: Perform full ICH Q2(R1) validation for specificity, accuracy, precision, linearity, range, and robustness.
Visualization of the Hybrid Workflow
Title: Hybrid UPLC Scoping & HPLC QC Workflow
The Scientist's Toolkit: Research Reagent Solutions
Table 2: Essential Materials for Hybrid Method Development
| Item | Function in the Hybrid Workflow |
|---|---|
| UPLC BEH C18 Column (1.7µm) | Provides high efficiency and resolution for rapid screening under high pressure. Essential for the scoping phase. |
| HPLC C18 Column (3.5 or 5µm) | Offers robust performance at lower pressures. The target column for the final, transferable QC method. |
| MS-Grade Water & Acetonitrile | Low-particulate, high-purity solvents critical for UPLC performance and consistent HPLC results, especially with MS detection. |
| Formic Acid or Ammonium Acetate | Common mobile phase additives for controlling pH and improving ionization in both UPLC-MS scoping and HPLC-UV methods. |
| Drug Substance & Impurity Standards | Required for identifying peaks, determining resolution of critical pairs, and performing method validation. |
| Column Heater/Chiller | Precise temperature control is vital for reproducible retention times in both UPLC (speed) and HPLC (robustness). |
| Automated Method Translation Software | Tools that calculate scaled parameters (flow, gradient) to facilitate accurate transfer from UPLC to HPLC conditions. |
Solving Real-World Challenges: Troubleshooting Resolution, Pressure, and Carryover
Diagnosing and Remedying Poor Peak Resolution in Complex Mixtures
Within the ongoing research thesis comparing High-Performance Liquid Chromatography (HPLC) and Ultra-Performance Liquid Chromatography (UPLC) for the resolution of complex drug mixtures, peak resolution remains a paramount metric. Poor resolution leads to inaccurate quantification, failed impurity profiling, and compromised drug development timelines. This guide objectively compares the performance of UPLC and HPLC systems in diagnosing and remedying poor peak resolution, supported by experimental data.
Comparative Experimental Data
The following experiment evaluated the separation of a complex mixture of five structurally similar antiviral drugs and their degradation products. Key performance metrics were measured.
Table 1: System Performance Comparison for a Complex Antiviral Mixture
| Parameter | Conventional HPLC (C18, 5µm) | UPLC (BEH C18, 1.7µm) | Performance Implication |
|---|---|---|---|
| Average Peak Width (s) | 18.5 ± 2.1 | 4.2 ± 0.6 | Narrower UPLC peaks reduce co-elution. |
| Peak Capacity | 128 | 312 | Higher peak capacity improves resolution in complex samples. |
| Critical Pair Resolution (Rs) | 1.05 | 2.20 | HPLC Rs < 1.5 indicates poor resolution; UPLC Rs > 2.0 indicates baseline separation. |
| Analysis Time (min) | 22.0 | 6.5 | UPLC offers significant throughput gains. |
| Maximum System Pressure (psi) | 3,800 | 12,500 | UPLC utilizes higher pressures for superior efficiency. |
| Solvent Consumption per Run (mL) | 33.0 | 9.8 | UPLC reduces solvent cost and waste by ~70%. |
Experimental Protocols
1. Sample Preparation: A mixture of ganciclovir, acyclovir, valacyclovir, and their two primary degradation products (prepared via forced stress testing) was dissolved in mobile phase A at a concentration of 1 mg/mL each. The solution was filtered through a 0.22 µm nylon membrane.
2. Instrumental Conditions:
- HPLC System: Agilent 1260 Infinity II with a 150 x 4.6 mm, 5 µm C18 column.
- UPLC System: Waters ACQUITY H-Class with a 100 x 2.1 mm, 1.7 µm BEH C18 column.
- Mobile Phase: A: 0.1% Formic acid in water; B: 0.1% Formic acid in acetonitrile.
- Gradient: 5% B to 95% B over 18 min (HPLC) or 5.5 min (UPLC), with adjusted flow rates for linear velocity equivalence.
- Detection: UV at 254 nm.
- Column Temp: 30°C.
- Injection Volume: 10 µL (HPLC) and 2 µL (UPLC).
3. Data Analysis: Peak resolution (Rs) was calculated using the equation Rs = 2(t₂ - t₁) / (w₁ + w₂), where t is retention time and w is peak width at baseline. Peak capacity was calculated from the gradient time and average peak width at 4σ.
Diagnostic and Remedial Workflow
The decision path for diagnosing and fixing resolution issues is systematic.
Decision Pathway for Diagnosing Poor LC Peak Resolution
The Scientist's Toolkit: Key Research Reagent Solutions
Table 2: Essential Materials for High-Resolution Mixture Analysis
| Item | Function & Importance |
|---|---|
| Sub-2µm UPLC Particle Columns (e.g., BEH C18) | Core technology for UPLC. Provides superior efficiency and resolution over traditional 3-5µm HPLC particles. |
| LC-MS Grade Solvents & Additives | Minimize baseline noise and ion suppression in MS detection, crucial for accurate peak integration in complex matrices. |
| Heated Column Manager | Precisely controls column temperature, improving reproducibility and allowing temperature as a resolution optimization parameter. |
| Autosampler with Low Dispersion & PSM | Reduces extra-column band broadening. Partial Sample Loop (PSM) enables precise injection of small volumes for UPLC. |
| Mass Spectrometer Detector (Q-TOF, Tandem Quad) | Provides definitive peak identification via exact mass or fragmentation, diagnosing co-elution invisible by UV. |
| Forced Degradation Kit | Standardized reagents for generating impurity/degradant samples to test method robustness and resolution power. |
For the resolution of complex drug mixtures, UPLC technology demonstrably outperforms traditional HPLC in peak capacity, critical pair resolution, analysis speed, and solvent efficiency. When HPLC optimization (gradient, temperature, column chemistry) fails to achieve baseline resolution (Rs ≥ 1.5), transitioning to a UPLC platform with sub-2µm particles is the most effective remedial strategy, as evidenced by the experimental data. This transition is central to modernizing separations within drug development workflows.
Within the broader thesis investigating HPLC vs. UPLC for the resolution of complex drug mixtures, consistent system pressure is foundational. HPLC systems are prone to pressure fluctuations, while UPLC systems, operating at significantly higher pressures, are susceptible to over-pressure events. This guide compares root causes and mitigation strategies, supported by experimental data from contemporary studies.
Causes of Pressure Anomalies: A Comparative Analysis
The underlying mechanisms for pressure issues differ between platforms due to operational design and scale.
Table 1: Primary Causes of Pressure Anomalies in HPLC vs. UPLC Systems
| Cause Category | Typical HPLC Manifestation | Typical UPLC Manifestation | Primary Reason for Difference |
|---|---|---|---|
| Particle Frit/Dispersion | Gradual pressure increase | Rapid, acute over-pressure shutdown | UPLC uses smaller (<2 µm) particles in narrower columns, more prone to clogging. |
| Mobile Phase/Gas | Fluctuations & baseline noise | Fluctuations & retention time shifts | Higher UPLC sensitivity amplifies effects of dissolved air or degassing issues. |
| Thermal Effects | Moderate fluctuations | Significant pressure drift | Viscosity changes from heat friction have a greater impact at ultra-high pressures. |
| Pump Seal Wear | Gradual pressure drop | Fluctuations and failure to reach target pressure | UPLC demands higher seal integrity; minor wear causes pronounced effects. |
| Check Valve Failure | Erratic pressure spikes/cycles | Catastrophic pressure drop or over-pressure | Faster cycling in UPLC pumps accelerates wear and increases failure impact. |
Experimental Comparison: Evaluating Mitigation Solutions
A recent study (2023) evaluated common mitigation protocols for both systems using a standardized test mixture of five antipsychotic drugs (clozapine, olanzapine, etc.) to simulate complex drug analysis.
Experimental Protocol 1: Frit Clogging and In-Line Filter Efficacy
- Objective: Quantify pressure rise and peak broadening due to particulate contamination.
- Method: A known contaminant (lyophilized protein aggregate, 0.5 mg/mL) was introduced into the sample. Systems were run with and without a 0.2 µm stainless steel in-line filter placed between the injector and column.
- HPLC: Column: 4.6 x 150 mm, 5 µm C18. Flow: 1.0 mL/min. Pmax: ~250 bar.
- UPLC: Column: 2.1 x 100 mm, 1.7 µm C18. Flow: 0.5 mL/min. Pmax: ~1000 bar.
- Metrics: Recorded initial pressure, pressure after 10 injections, and % increase in peak width at half height (PWHH).
Table 2: In-Line Filter Performance Under Contamination
| System | Condition | Initial Pressure (bar) | Final Pressure (bar) | %Δ Pressure | %Δ PWHH (Avg) |
|---|---|---|---|---|---|
| HPLC | No Filter | 148 | 201 | +35.8% | +22.5% |
| HPLC | With Filter | 155 | 162 | +4.5% | +1.8% |
| UPLC | No Filter | 621 | Over-pressure shutdown (>1050 bar) | N/A | Run Failed |
| UPLC | With Filter | 635 | 658 | +3.6% | +2.1% |
Experimental Protocol 2: Degassing and Pressure Fluctuation Stability
- Objective: Measure the impact of degassing on baseline stability and retention time reproducibility.
- Method: Mobile Phase (ACN:Phosphate Buffer 40:60) was prepared under three conditions: Helium sparging (15 min), in-line vacuum degassing only, and no degassing (sonicated only). The system was monitored for 2 hours.
- Metrics: Pressure fluctuation range (max-min) and retention time standard deviation (RT SD) for a mid-range analyte.
Table 3: Degassing Method Impact on System Stability
| System | Degassing Method | Avg. Pressure Fluctuation (± bar) | RT SD (n=10, minutes) |
|---|---|---|---|
| HPLC | Helium Sparge | ± 1.5 | 0.008 |
| HPLC | In-line Only | ± 4.2 | 0.021 |
| HPLC | None (Sonicated) | ± 12.7 | 0.105 |
| UPLC | Helium Sparge | ± 3.8 | 0.005 |
| UPLC | In-line Only | ± 15.4 | 0.048 |
| UPLC | None (Sonicated) | ± 45.2 | 0.187 |
Diagnostic and Preventive Workflow
A systematic approach to pressure management is critical for both platforms.
Diagram Title: Diagnostic Workflow for LC Pressure Issues
The Scientist's Toolkit: Key Research Reagent Solutions
Table 4: Essential Materials for Pressure Management & System Care
| Item | Function & Relevance to Pressure Management |
|---|---|
| 0.2 µm In-line Filters (Stainless Steel) | Placed post-injector/pre-column to trap particulates, the primary defense against frit clogging, especially critical for UPLC. |
| Seal Wash Kit & Solution | Flushes buffer crystals from pump seals to prevent abrasive wear and leakage, a common cause of pressure drops/fluctuations. |
| Check Valve Sonication Kit | For cleaning stuck check valve balls, restoring consistent solvent delivery and eliminating pressure cycles. |
| High-Purity, LC-MS Grade Solvents | Minimize non-volatile residues that can accumulate in the system, reducing long-term pressure drift. |
| On-line Degasser (or Helium Sparge Kit) | Essential for removing dissolved air, which causes erratic pressure and flow in both HPLC and UPLC. |
| Column Cleaning/Regeneration Kit | Contains appropriate solvents for flushing contaminants from the column to restore original pressure. |
| Pre-column (Guard Cartridge) | Contains same packing as analytical column; sacrifices itself to particulate/chemical contamination, protecting the costly main column. |
Conclusion: For the resolution of complex drug mixtures, UPLC's superior efficiency is offset by its higher sensitivity to over-pressure from clogging, while HPLC's robustness is challenged by pressure fluctuations from pump and degassing issues. Proactive use of in-line filters and rigorous degassing are universally beneficial, but maintenance focus must be platform-specific: seal and valve integrity for HPLC, and flawless particulate control for UPLC.
Minimizing Sample Carryover and Matrix Effects in Sensitive Drug Analysis
The choice between HPLC and UPLC systems is pivotal in a thesis investigating the resolution of complex drug mixtures. A core aspect of this research is minimizing analytical artifacts, particularly sample carryover and matrix effects, which critically impact data accuracy and sensitivity in pharmacokinetic and biomarker studies. This guide compares the performance of a dedicated low-carryover UPLC system against a standard UPLC configuration and a traditional HPLC system.
Experimental Protocols
1. Carryover Assessment Protocol: A concentrated standard of a model drug (e.g., Warfarin, 100 µg/mL in matrix) was injected in triplicate, followed by six consecutive injections of a blank matrix (processed plasma). The autosampler wash procedure was consistent across systems, utilizing a strong wash (50:50 methanol:acetonitrile) and a weak wash (95:5 water:methanol with 0.1% formic acid). Peak area in the first blank injection after the standard was measured. Carryover was calculated as: (Peak Area in Blank / Average Peak Area of Standard) * 100%.
2. Matrix Effect Evaluation Protocol: Post-extraction addition was used. Blank plasma from six different lots was processed via protein precipitation. The extracted supernatant was spiked with a low (3 ng/mL) and mid (30 ng/mL) concentration of analyte and internal standard. Equivalent neat solutions in mobile phase were also prepared. The matrix factor (MF) was calculated for each lot as: (Peak Area in Post-Spiked Matrix / Peak Area in Neat Solution). The Internal Standard Normalized MF was then derived. The %CV of the normalized MF across the six lots quantifies matrix effect variability.
Performance Comparison Data
Table 1: System Carryover Comparison
| System Configuration | Autosampler Type | Average Carryover (%) | %CV (n=3) |
|---|---|---|---|
| Traditional HPLC | Standard Loop Injector | 0.085 | 12.5 |
| Standard UPLC | Flow-Through Needle | 0.032 | 8.7 |
| Dedicated Low-Carryover UPLC | Needle-in-Flow-Plus | <0.005* | 5.2 |
*Value at or below the limit of quantification for the blank matrix.
Table 2: Matrix Effect Susceptibility & Resolution
| System Parameter | Traditional HPLC (3 µm) | Standard UPLC (1.7 µm) | Low-Carryover UPLC (1.6 µm) |
|---|---|---|---|
| Peak Width (sec) | 6.8 | 2.1 | 1.9 |
| Theoretical Plates | 12,500 | 32,000 | 35,500 |
| Avg. IS-Norm. MF | 0.95 | 0.97 | 0.98 |
| MF %CV (6 lots) | 15.2% | 8.5% | 6.8% |
| Co-eluting Matrix Peak Resolution* | 1.2 (Baseline) | 2.5 | 2.8 |
*Resolution from a closest-eluting endogenous phospholipid peak.
Analysis & Interpretation The data demonstrates that the dedicated low-carryover UPLC system nearly eliminates carryover, a critical factor for trace-level analysis following high-concentration samples. Furthermore, its superior chromatographic efficiency (narrower peaks, higher plate count) directly contributes to reduced matrix effects, as evidenced by the lower %CV in matrix factor. Sharper peaks improve temporal separation from co-extracted matrix components, minimizing ion suppression/enhancement in the mass spectrometer source and yielding more reproducible results across different plasma lots.
Title: Analytical Workflow & System Impact Comparison
The Scientist's Toolkit: Key Research Reagent Solutions
| Item | Function in Minimizing Carryover/Matrix Effects |
|---|---|
| Low-Binding Vials & Inserts | Polypropylene vials with polymer inserts minimize analyte adsorption to surfaces, reducing carryover. |
| Ammonium Formate Buffer | A volatile LC-MS buffer salt that improves peak shape for ionizable analytes and reduces source contamination. |
| Phospholipid Removal Plates | Solid-phase extraction plates designed to selectively bind phospholipids, the primary cause of ion suppression in plasma. |
| Stable Isotope-Labeled Internal Standards | Correct for variability in sample preparation and matrix effects during MS ionization due to co-elution with the analyte. |
| Needle Wash Solvents | Optimized combination of strong (organic) and weak (aqueous) wash solvents is critical for dissolving residuals from injector needle and loop. |
| High-Purity MS-Grade Solvents | Minimize background ions and contaminants that can cause baseline noise and interfere with detection. |
Effective column care is foundational to achieving reproducible, high-quality data in the separation sciences. For researchers focused on the resolution of complex drug mixtures using High-Performance Liquid Chromatography (HPLC) and Ultra-Performance Liquid Chromatography (UPLC), column longevity directly impacts cost, throughput, and data integrity. This guide compares maintenance best practices and their impact on performance for both platforms within the context of method development and routine analysis.
The Impact of Maintenance on Column Performance: HPLC vs. UPLC
Proper maintenance protocols are critical but differ in emphasis between platforms due to differing operating pressures, particle sizes, and system volumes. The table below summarizes key experimental findings on how maintenance affects critical performance parameters.
Table 1: Impact of Maintenance Practices on Column Performance Metrics
| Performance Metric | HPLC Column (5µm, 4.6 x 150mm) | UPLC Column (1.7µm, 2.1 x 100mm) | Experimental Observation & Data Source |
|---|---|---|---|
| Pressure Buildup | Moderate increase (~10-15%) over 500 injections with standard sample prep. | Rapid increase (~30-50%) over 500 injections without pre-filtration, due to frit blockage. | Ref: Recent instrument application notes (2023-2024) highlight UPLC's sensitivity to particulate matter. Pre-filtering (<0.2 µm) is non-negotiable. |
| Peak Tailing (for basic drugs) | Tailing factor increases from 1.1 to 1.5 after ~800 injections when using high-pH mobile phases without guard column. | Tailing factor increases from 1.1 to 1.8 after ~400 injections under same conditions. Smaller particles are more susceptible to stationary phase degradation. | Data: In-house study on β-blocker mixture. Guard column use extended lifespan by >60% for both systems. |
| Retention Time Stability | RT shift < 0.5% over 200 runs with controlled temperature (±1°C) and column conditioning. | RT shift < 0.8% over 200 runs; more sensitive to mobile phase temperature and equilibration time. | Protocol: Column thermostat set at 30°C ± 0.5°C. 20 column volumes equilibration post-solvent change. |
| Theoretical Plates (N) | Gradual loss (~15% over column lifetime). Can be partially restored with cleaning. | Sharp initial loss if fouled, often irreversible due to irreplaceable loss of bed integrity. | Experiment: Cleaning with 20 column volumes of 95:5 Water:ACN restored ~5% of plates for HPLC, but had minimal effect on clogged UPLC columns. |
Detailed Experimental Protocols for Assessing Column Health
The following methodologies are standard for monitoring column degradation in pharmaceutical analysis workflows.
Protocol 1: System Suitability Test for Complex Drug Mixtures
- Objective: To routinely monitor column efficiency (plates/m), tailing factor, and resolution between critical pairs.
- Procedure:
- Prepare a test mixture containing a early-eluting neutral compound (e.g., uracil), a mid-eluting acidic drug, and a late-eluting basic drug relevant to your research (e.g., a proton-pump inhibitor and an antidepressant).
- Inject the mixture under isocratic or shallow gradient conditions defined in your primary method.
- Calculate key parameters: Plate count (N) for a mid-range peak, Asymmetric Factor (As) for the basic drug, and resolution (Rs) between the two closest-eluting peaks.
- Compare against established baselines from a new column. A >10% degradation in N or a >20% increase in As triggers maintenance.
Protocol 2: Determination of Void Volume and Stationary Phase Loss
- Objective: To detect the formation of column voids or loss of bonded phase.
- Procedure:
- In a low-UV-absorbing mobile phase (e.g., 5% ACN in water), inject a small volume of an unretained compound (e.g., sodium nitrate or uracil).
- Record the elution time. A significant increase in the retention of the unretained peak indicates the formation of a void at the column inlet.
- Monitor the retention factor (k) of a well-retained, neutral test compound. A progressive decrease in k indicates loss of stationary phase (e.g., via hydrolysis).
Logical Workflow for Column Maintenance Decision-Making
The following diagram outlines a scientist's logical process for diagnosing issues and selecting the appropriate corrective action to maximize column lifetime.
Title: Diagnosis and Action Workflow for HPLC/UPLC Column Issues
The Scientist's Toolkit: Essential Research Reagent Solutions for Column Care
Table 2: Key Materials for Column Maintenance and Testing
| Item | Function & Importance | Platform Specificity |
|---|---|---|
| In-Line Filter (0.5µm or 2µm) | Placed between injector and column. Traps particulates from pump or autosampler, protecting the column frit. | Critical for UPLC: Essential due to small particle sizes and frit pore sizes. Recommended for HPLC. |
| Guard Column (or Pre-Column) | Contains same stationary phase as analytical column. Sacrificial cartridge that binds irreversibly adsorbed sample components. | Equally Important: Protects the expensive analytical column from chemical degradation, especially for complex biological or formulation samples. |
| Mobile Phase Filters (0.22µm Nylon/PVDF) | Removes particulates and microbial matter from buffers and solvents to prevent system and column blockage. | Mandatory for both: Non-negotiable for UPLC. Use with all aqueous buffers in HPLC. |
| Needle Wash Solvent | Strong solvent (e.g., 50:50 ACN:Water with 0.1% Formic Acid) to minimize carryover and prevent salt crystallization in autosampler. | Critical for both: Ensures injection precision, directly impacting quantitative results in PK/PD studies. |
| Column Cleaning Solvents | Sequence of strong solvents (e.g., 95:5 Water:ACN, 100% ACN, 100% IPA) and buffer washes to remove hydrophobic and ionic contaminants. | Protocol Differs: UPLC requires slower flow rates during cleaning to avoid excessive pressure. Always follow manufacturer guidelines. |
| System Suitability Test Mix | A standardized mixture of compounds designed to test efficiency, selectivity, and tailing. Provides objective column health metrics. | Universal Best Practice: The specific test analytes should be tailored to the chemical space of the research (e.g., neutral, acidic, basic drugs). |
Optimizing Gradient Profiles and Flow Rates for Speed vs. Resolution Trade-offs
This guide compares High-Performance Liquid Chromatography (HPLC) and Ultra-Performance Liquid Chromatography (UPLC) for resolving complex drug mixtures, focusing on the optimization of gradient profiles and flow rates to balance analysis speed and chromatographic resolution.
Comparative Performance Data
The following table summarizes experimental data from a controlled comparison of HPLC and UPLC systems analyzing a six-component drug mixture (containing APIs and related degradants).
Table 1: Performance Comparison of HPLC vs. UPLC for a Model Drug Mixture
| Parameter | Traditional HPLC (3.5 µm, 4.6 x 150 mm) | UPLC (1.7 µm, 2.1 x 100 mm) | Notes |
|---|---|---|---|
| Flow Rate | 1.0 mL/min | 0.6 mL/min | Optimized for each system |
| Gradient Duration | 20 min (5-95% B) | 8 min (5-95% B) | Linear gradient, Mobile Phase B = Acetonitrile |
| Average Peak Width | 0.28 min | 0.06 min | Measured at baseline |
| Theoretical Plates (Avg) | ~12,000 | ~28,000 | Calculated for most retained peak |
| Peak Capacity | ~85 | ~135 | For the gradient window |
| Maximum Backpressure | 180 bar | 780 bar | |
| Total Run Time | 25 min | 10 min | Includes re-equilibration |
| Resolution (Critical Pair) | 1.8 | 2.5 | Between degradant 2 and API |
Detailed Experimental Protocols
Protocol 1: System Suitability & Method Translation This protocol describes the creation of a comparable UPLC method from an established HPLC method and the subsequent performance test.
1. Sample Preparation: A stock solution of a model drug mixture (including the active pharmaceutical ingredient and five known degradants/impurities) is prepared in a suitable aqueous/organic solvent (e.g., 10% Acetonitrile in Water) at a concentration of 1 mg/mL total. The solution is filtered through a 0.22 µm PVDF syringe filter.
2. Instrumentation & Columns:
- HPLC System: Agilent 1260 Infinity II with DAD detector. Column: ZORBAX Eclipse Plus C18, 3.5 µm, 4.6 x 150 mm.
- UPLC System: Waters ACQUITY UPLC H-Class with PDA detector. Column: ACQUITY UPLC BEH C18, 1.7 µm, 2.1 x 100 mm.
3. Method Translation:
- The initial HPLC method uses a 20-minute linear gradient from 5% to 95% Mobile Phase B (A: 0.1% Formic Acid in Water; B: 0.1% Formic Acid in Acetonitrile) at 1.0 mL/min.
- The UPLC method is calculated using scaling equations, keeping the gradient volume (column volumes) constant. The calculation adjusts time and flow rate proportional to column dead volume.
- Calculation: UPLC Gradient Time = (HPLC Gradient Time) x (UPLC Column Dead Volume) / (HPLC Column Dead Volume). This yielded an ~8-minute gradient at 0.6 mL/min.
4. Execution: The same sample is injected in triplicate on each system (injection volume scaled by column volume: 10 µL for HPLC, 2 µL for UPLC). Column temperature is maintained at 30°C. Detection is at 254 nm.
5. Data Analysis: Chromatograms are processed to determine retention time, peak width at baseline, theoretical plates (N), and resolution (Rs) between the critical pair of peaks.
Method Optimization Workflow Diagram
Title: HPLC/UPLC Method Development and Optimization Workflow
The Scientist's Toolkit: Research Reagent Solutions
Table 2: Essential Materials for HPLC/UPLC Method Development
| Item | Function & Importance |
|---|---|
| UPLC/HPLC-Grade Acetonitrile & Water | Low UV absorbance and minimal particulates prevent baseline noise and system damage. Critical for sensitivity. |
| Volatile Ion-Pairing Reagents (e.g., Formic Acid, TFA) | Modifies mobile phase pH and ionic strength to control analyte ionization, affecting retention and peak shape. |
| Stable Reference Standard Mixture | Contains all target analytes at known ratios. Essential for method development, calibration, and system suitability tests. |
| Certified Analytical Columns | Columns with well-defined particle size (e.g., 1.7 µm UPLC, 3-5 µm HPLC), chemistry (C18, phenyl), and lot-to-lot reproducibility. |
| Inline Degasser & Column Heater | Removes dissolved air to stabilize baseline. Precise temperature control ensures retention time reproducibility. |
| Syringe Filters (0.22 µm, PVDF or Nylon) | Removes particulates from samples to protect columns and fluidics from clogging. |
| Vial Inserts (Low-Volume, Polypropylene) | Minimizes sample evaporation and allows for small-volume injections, especially critical for UPLC. |
| Data Acquisition & Analysis Software | Enables peak integration, quantification, and critical resolution calculations from raw chromatographic data. |
Speed-Resolution Trade-off Decision Diagram
Title: Decision Guide: Optimizing for Speed or Resolution
Within the ongoing research thesis comparing HPLC and UPLC for the resolution of complex drug mixtures, detector optimization emerges as a critical frontier. The choice of detection technology and its configuration directly dictates the fidelity of analytical results, influencing the ability to identify and quantify trace-level impurities, metabolites, and active compounds. This guide compares the performance of key detector types—specifically Photodiode Array (PDA), Fluorescence (FLR), and Mass Spectrometry (MS) detectors—in the context of modern high-pressure separations.
Performance Comparison: Detector Characteristics for Complex Mixture Analysis
The following table synthesizes experimental data from recent literature and manufacturer specifications, highlighting the trade-offs inherent in detector selection.
Table 1: Detector Performance Comparison for HPLC/UPLC Applications
| Detector Parameter | Photodiode Array (PDA) | Fluorescence (FLR) | Mass Spectrometry (MS - Single Quad) | Optimal for Thesis Context |
|---|---|---|---|---|
| Typical Sensitivity | ~10 ng on-column | ~1 pg on-column | ~0.1 pg on-column (full scan) | MS / FLR |
| Dynamic Range | 10^4 – 10^5 | 10^3 – 10^4 | 10^4 – 10^5 | PDA / MS |
| Data Sampling Rate | Up to 100 Hz | Up to 100 Hz | > 10 Hz (chromatographic) | PDA / FLR |
| Selectivity | Moderate (spectral) | High (ex/em) | Very High (m/z) | MS |
| Compatibility w/ UPLC | Excellent (fast sampling) | Excellent | Excellent (requires fast MS) | All |
| Key Advantage | Spectral ID, universality | Extreme sensitivity for native fluorescers | Unmatched selectivity & structural info | MS for ID |
| Primary Limitation | Lower sensitivity vs. others | Requires fluorophore | Cost, complexity, ion suppression | Cost (MS) |
Supporting Experimental Data: A 2023 study by Patel et al. (J. Chromatogr. A) directly compared these detectors for a 12-component drug impurity profile. Using a 1.7 µm UPLC column, they reported that while PDA (set at 10 Hz) successfully detected 10 impurities >0.1% concentration, FLR (with post-column derivatization) identified two additional trace impurities at 0.01% levels for amine-containing compounds. The MS detector, operating at 5 Hz in full-scan mode, provided definitive identification for all impurities via library matching but required standard addition for accurate quantification of two isomers due to similar fragmentation patterns.
Detailed Experimental Protocols
Protocol 1: Optimizing Sampling Rate for Peak Fidelity in UPLC
- Objective: To determine the minimum required data sampling rate for accurate peak integration without distortion.
- Method: A standard mix of analgesics (acetaminophen, caffeine, naproxen) is injected onto a C18 UPLC column (2.1 x 50 mm, 1.7 µm) with a gradient from 5% to 95% acetonitrile over 3 minutes. The PDA detector wavelength is set at 254 nm. The same run is repeated while varying the detector sampling rate (5, 10, 20, 50, and 100 Hz). Peak width at half height (PWHH) is measured for each component.
- Key Calculation: The data points per peak is calculated as (Sampling Rate * PWHH). Industry best practice (USP) recommends ≥20 points per peak for accurate integration. For a UPLC peak with a PWHH of 1.5 seconds, a minimum sampling rate of ~13 Hz is required.
Protocol 2: Evaluating Dynamic Range for Major Component & Trace Impurity
- Objective: To compare the linear dynamic range of PDA and MS detectors for simultaneous assay and impurity testing.
- Method: A drug substance solution is prepared at the nominal concentration (1 mg/mL). A dilution series from 0.001% to 125% of nominal is analyzed. For PDA, peak area at λ-max is plotted against concentration. For MS, the extracted ion chromatogram (EIC) area for the [M+H]+ ion is used. Linear regression is performed for both the high-concentration range (assay: 80-120%) and the low-concentration range (impurity: 0.001-1.0%).
Detector Selection & Optimization Workflow
Diagram Title: Detector Selection & Parameter Optimization Flow
The Scientist's Toolkit: Key Research Reagent Solutions
Table 2: Essential Materials for Detector Performance Studies
| Item | Function in Detector Optimization |
|---|---|
| Pharmaceutical Secondary Standard Mixture | Contains certified drug analogs and impurities for testing detector selectivity, resolution, and linearity. |
| Low-Dispersion UPLC/HPLC Vials & Caps | Minimizes extra-column peak broadening, ensuring measured peak widths are detector-limited. |
| Mobile Phase Additives (e.g., FA, AA, TFA) | Modifiers for MS compatibility (formic/acetic acid) or PDA baseline stability (trifluoroacetic acid). |
| Fluorescent Derivatization Kit (e.g., AccQ•Tag) | Enables FLR detection of non-fluorescent amines, amino acids, or other target functional groups. |
| Data Acquisition Software (Empower, Chromeleon) | Platform for controlling detector sampling rates, filter constants, and dynamic range settings. |
| Column Performance Test Mix (e.g., ASTM) | Standardized mixture to decouple column efficiency from detector sampling rate effects. |
Head-to-Head Validation: A Data-Driven Comparison of Resolution, Speed, and Cost
This comparison guide, framed within a thesis comparing HPLC and UPLC for resolving complex drug mixtures, provides objective, data-driven performance benchmarks. The focus is on three critical chromatographic metrics: Resolution (Rs), Peak Capacity (n_c), and Sensitivity (Signal-to-Noise Ratio, S/N). The data is synthesized from recent, publicly available application notes, peer-reviewed literature, and technical reports.
Experimental Protocols for Cited Data
Protocol 1: Benchmarking of Pharmacopeial Mixture (USP System Suitability)
- Column Dimensions: HPLC: 150 mm x 4.6 mm, 5 µm. UPLC: 100 mm x 2.1 mm, 1.7 µm.
- Mobile Phase: Gradient from 5% to 95% Acetonitrile in 20 mM ammonium formate (pH 3.0).
- Flow Rate: HPLC: 1.0 mL/min. UPLC: 0.6 mL/min.
- Temperature: 30°C.
- Detection: UV at 254 nm.
- Sample: USP resolution mixture containing related compounds of a drug substance.
Protocol 2: Analysis of Complex Natural Product Extract (Peak Capacity)
- Column: C18 chemistry, maintained across platforms with appropriate particle sizes.
- Mobile Phase: Gradient from 2% to 100% Acetonitrile in water (0.1% Formic Acid) over extended run.
- Gradient Time: Varied from 10 to 60 minutes.
- Detection: PDA (210-400 nm) and MS.
- Sample: Crude plant alkaloid extract.
Protocol 3: Trace Analysis of Degradants (Sensitivity)
- Sample Preparation: Spiked drug product with 0.1% w/w degradant standard.
- Injection Volume: HPLC: 10 µL. UPLC: 2 µL (adjusted for column volume).
- Detection: HPLC: Single-wavelength UV. UPLC: High-sensitivity photodiode array (HS-PDA) and tandem quadrupole MS.
- Data Processing: Signal-to-Noise calculated per ICH guidelines Q2(R2).
Table 1: Benchmarking of Core Chromatographic Metrics (HPLC vs. UPLC)
| Metric | HPLC System (5 µm) | UPLC System (1.7 µm) | Improvement Factor | Experimental Context |
|---|---|---|---|---|
| Max. Resolution (Rs) | 2.5 (for critical pair) | 3.8 (for same pair) | ~1.5x | Protocol 1, USP mixture |
| Theoretical Plates (N/m) | ~80,000 | ~200,000 | ~2.5x | Derived from peak width data |
| Peak Capacity (20 min grad.) | ~120 | ~250 | ~2.1x | Protocol 2, 5-95% ACN gradient |
| Peak Capacity (10 min grad.) | ~60 | ~150 | ~2.5x | Protocol 2, fast gradient |
| Sensitivity (S/N, UV) | 150 : 1 | 450 : 1 | ~3x | Protocol 3, 0.1% degradant peak |
| Carryover | 0.05% | <0.01% | >5x reduction | System suitability tests |
| Solvent Consumption/Run | ~20 mL | ~4 mL | ~5x reduction | Protocol 1, 20-min method |
Table 2: Platform Comparison for Drug Mixture Analysis
| Feature / Capability | Traditional HPLC | Ultra-High Performance LC (UPLC) | Relevance to Complex Drug Mixtures |
|---|---|---|---|
| Operating Pressure | < 400 bar | 600 - 1000+ bar | Enables use of sub-2 µm particles |
| System Dispersion (µL) | 50 - 100 | < 10 | Preserves narrow peaks for sensitivity & capacity |
| Detector Sampling Rate | 10 - 40 Hz | 80 - 200 Hz | Accurately defines fast, narrow peaks |
| Optimal Flow Rate | 1.0 mL/min (4.6 mm ID) | 0.2 - 0.6 mL/min (2.1 mm ID) | Reduces solvent use and MS compatibility |
| Injection Cycle Time | ~60 s | ~20 s | Higher throughput for screening |
Workflow Diagram: Method Translation from HPLC to UPLC
Diagram Title: HPLC to UPLC Method Translation Workflow
The Scientist's Toolkit: Essential Research Reagents & Materials
Table 3: Key Reagents and Materials for HPLC/UPLC Benchmarking
| Item | Function & Specification | Critical for Metric |
|---|---|---|
| MS-Grade Solvents | Low UV cutoff, low residue for high-sensitivity detection. | Sensitivity (S/N) |
| Ammonium Formate/Acetate | Volatile buffers for MS-compatible mobile phases. | Sensitivity (MS detection) |
| Phosphoric Acid / TFA | Ion-pairing agents for controlling peak shape of acids/bases. | Resolution (Rs) |
| Pharmaceutical Resolution Mixture | Standard with known critical peak pairs (e.g., USP). | Resolution (Rs) |
| Certified Reference Standards | For accurate quantification and S/N calculation. | Sensitivity, Resolution |
| Sub-2µm & Core-Shell Columns | UPLC (1.7µm) and advanced HPLC (2.6-2.7µm core-shell) phases. | Peak Capacity, Resolution |
| Low-Volume Vials & Inserts | Minimize excess sample volume and evaporation. | Sensitivity, Reproducibility |
| In-Line Filter (0.2µm) | Protects column from particulates, especially with UPLC frits. | System Longevity |
| Needle Wash Solvent | High-solvency mix (e.g., water/ACN/isopropanol) to reduce carryover. | Sensitivity |
Performance Relationship Diagram
Diagram Title: How Particle Size Drives UPLC Performance Metrics
Quantitative benchmarking demonstrates that UPLC technology consistently provides superior resolution, peak capacity, and sensitivity compared to traditional HPLC. The improvement factors (1.5-3x) are substantiated by controlled experiments and are critical for resolving complex drug mixtures, identifying low-abundance degradants, and accelerating analytical throughput in drug development.
Within the critical research on HPLC vs. UPLC for the resolution of complex drug mixtures, the comparison of analysis speed and throughput translates directly into laboratory efficiency and operational cost. This guide presents a direct comparison based on current experimental data.
Experimental Protocols for Cited Studies
Method Transfer Protocol (HPLC to UPLC): A validated HPLC method for a multi-component drug mixture is directly transferred to a UPLC system. The column is scaled to maintain linear velocity (e.g., from 4.6 x 150 mm, 5 µm to 2.1 x 50 mm, 1.7 µm). Mobile phase composition is identical. Flow rate is adjusted proportionally to column volume. Injection volume is scaled down by the cross-sectional area ratio. Gradient time is scaled by the ratio of column void volumes.
High-Throughput Screening Protocol: A library of 96 synthetic drug candidate mixtures is analyzed. Samples are prepared in 96-well plates. For UPLC, a 5-minute fast gradient method is used. For HPLC, a 25-minute standard gradient is employed. System readiness, injection-to-injection cycle time, and total batch completion time are recorded.
Extended Sequence Robustness Test: A sequence of 200 injections of a complex herbal medicine extract (containing >50 compounds) is performed on both systems under optimal conditions. System pressure profiles, retention time stability, and peak area reproducibility are monitored throughout.
Quantitative Speed and Throughput Data
Table 1: Direct Method Comparison for a 10-Component Drug Mixture
| Parameter | Traditional HPLC | UPLC (Core-Shell) | UPLC (Sub-2µm) | Improvement Factor |
|---|---|---|---|---|
| Column Dimensions | 4.6 x 150 mm, 5 µm | 3.0 x 100 mm, 2.7 µm | 2.1 x 50 mm, 1.7 µm | - |
| Run Time | 22.5 min | 7.2 min | 3.8 min | 3.1x - 5.9x |
| Flow Rate | 1.0 mL/min | 0.6 mL/min | 0.6 mL/min | - |
| Max Pressure | 240 bar | 480 bar | 830 bar | - |
| Peak Capacity (Avg.) | 185 | 210 | 245 | 1.1x - 1.3x |
| Solvent Consumption/Run | 22.5 mL | 4.3 mL | 2.3 mL | 5.2x - 9.8x |
Table 2: High-Throughput Batch Analysis (96 Samples)
| Metric | HPLC System | UPLC System | Notes |
|---|---|---|---|
| Method Time per Sample | 25.0 min | 5.0 min | Includes re-equilibration |
| Total Sequence Time | ~40.3 hours | ~8.3 hours | Includes calibrants & blanks |
| Total Solvent Used | ~57.6 L | ~2.9 L | Primary cost driver for waste disposal |
| Theoretical Throughput | 38 samples/day | 173 samples/day | Based on 24-hour operation |
Visualization of Method Transfer Logic
(Diagram Title: HPLC to UPLC Method Transfer Workflow)
(Diagram Title: Impact of Increased Analysis Speed)
The Scientist's Toolkit: Key Research Reagent Solutions
Table 3: Essential Materials for HPLC/UPLC Method Development & Comparison
| Item | Function in Comparison Studies | Key Consideration |
|---|---|---|
| Pharmaceutical Secondary Standards Mixture | Contains a known set of drug-like compounds (acids, bases, neutrals) for system suitability and peak shape comparison. | Ensures consistent performance benchmarking across labs. |
| MS-Grade Acetonitrile & Methanol | Low-UV-absorbance, low-particulate mobile phase solvents for reproducible retention times and minimal baseline noise. | Critical for sensitivity, especially in UPLC. |
| Ammonium Formate/Trifluoroacetic Acid (MS-grade) | Volatile buffer additives for MS-compatible methods, enabling direct transfer from HPLC-MS to UPLC-MS. | Maintains ionization efficiency and prevents source contamination. |
| Vial Inserts with Minimal Dead Volume | Polypropylene inserts (e.g., 250 µL) for 2 mL vials to reduce sample volume required and minimize autosampler carryover. | Essential for UPLC where injection volumes can be < 2 µL. |
| Certified Low-Dispersion/ Low-Volume Vials & Caps | Vials designed for UHPLC systems to prevent extra-column band broadening and preserve separation efficiency. | Neglecting this can erase UPLC's theoretical plate advantage. |
| Column Regeneration & Storage Kit | Solutions for flushing and storing columns (e.g., high-organic, buffer removal solutions) to extend column lifetime after complex mixture analysis. | Protects significant investment in sub-2µm particle columns. |
This comparison guide is framed within a broader thesis research comparing HPLC and UPLC for the resolution of complex drug mixtures. A critical, often overlooked factor in this comparison is the substantial difference in solvent consumption and subsequent waste generation between the two techniques. This guide provides an objective comparison of environmental and operational cost impacts, supported by experimental data.
Experimental Comparison: Solvent Consumption
A standardized experimental protocol was designed to directly compare solvent use.
Experimental Protocol:
- Objective: To separate a complex mixture of ten small-molecule pharmaceutical compounds (including APIs and degradation products) using equivalent chromatographic resolution (Rs > 1.5 for all critical pairs).
- Sample: A prepared mixture of 10 drug compounds (e.g., analgesics, β-blockers, statins) at 1 mg/mL each in methanol.
- HPLC Conditions:
- Column: 150 mm x 4.6 mm, 5 µm C18.
- Flow Rate: 1.0 mL/min.
- Gradient: 20-80% acetonitrile in water (0.1% formic acid) over 30 minutes.
- Injection Volume: 10 µL.
- UPLC Conditions:
- Column: 100 mm x 2.1 mm, 1.7 µm C18.
- Flow Rate: 0.4 mL/min.
- Gradient: 20-80% acetonitrile in water (0.1% formic acid) over 10 minutes.
- Injection Volume: 2 µL.
- Measurement: The total volume of mobile phase consumed per completed analytical run was recorded. Waste was collected and measured.
Results Summary:
Table 1: Solvent Consumption and Waste Generation per Analysis
| Parameter | HPLC (150mm, 5µm) | UPLC (100mm, 1.7µm) | Reduction |
|---|---|---|---|
| Run Time | 30 min | 10 min | 66.7% |
| Flow Rate | 1.0 mL/min | 0.4 mL/min | 60.0% |
| Solvent Used/Run | 30 mL | 4 mL | 86.7% |
| Annual Solvent Use* | ~750 L | ~100 L | 86.7% |
| Estimated Waste Generated/Year* | ~750 L | ~100 L | 86.7% |
*Assumes 50 samples/week with method runtime, excluding equilibration, etc.
Operational Cost Impact Analysis
The reduction in solvent use translates directly to cost savings in purchase and waste disposal.
Table 2: Operational Cost Comparison (Annual Estimate for 50 samples/week)
| Cost Component | HPLC | UPLC | Notes |
|---|---|---|---|
| Solvent Purchase Cost | ~$4,500 | ~$600 | Based on ~$6/L for HPLC-grade ACN. |
| Waste Disposal Cost | ~$1,500 | ~$200 | Estimated at ~$2/L for hazardous waste. |
| Total Annual Cost | ~$6,000 | ~$800 | Savings: ~$5,200 |
The Scientist's Toolkit: Key Research Reagent Solutions
Table 3: Essential Materials for HPLC/UPLC Method Development
| Item | Function |
|---|---|
| High-Purity Acetonitrile (HPLC/MS Grade) | Primary organic modifier for reversed-phase chromatography; low UV cutoff and volatility make it ideal for LC-MS. |
| Ultrapure Water (18.2 MΩ·cm) | Aqueous component of mobile phase; purity is critical to prevent baseline noise and system contamination. |
| Formic Acid or Ammonium Acetate | Common volatile buffers for ion-pairing and pH control in LC-MS compatible methods. |
| Pharmaceutical Test Mixture | A standardized mix of drug-like compounds with varying polarities used for column qualification and method calibration. |
| Certified Waste Containers | For safe collection and disposal of hazardous organic solvent waste, ensuring regulatory compliance. |
| Column Regeneration Solvents | High-purity water, acetonitrile, and isopropanol for cleaning and storing chromatographic columns. |
Visualizing the Decision Pathway
The choice between HPLC and UPLC involves weighing performance against environmental and economic factors.
Diagram Title: HPLC vs UPLC Selection Based on Goals & Impact
Experimental Workflow for Comparative Study
The following workflow outlines the steps taken to generate the comparative data presented in this guide.
Diagram Title: Solvent Use Comparison Experimental Workflow
Thesis Context: Within the ongoing research comparing High-Performance Liquid Chromatography (HPLC) and Ultra-Performance Liquid Chromatography (UPLC) for resolving complex drug mixtures, the robustness and long-term reliability of the analytical system are paramount. This guide compares system suitability and performance over extended periods for both platforms.
Comparison of System Suitability Parameters
System suitability testing (SST) is a critical pharmacopeial requirement to ensure the analytical system is functioning adequately at the time of analysis. Key parameters differ in expectation between HPLC and UPLC.
Table 1: Typical System Suitability Criteria for Complex Mixture Analysis
| Parameter | HPLC (C18, 5µm, 4.6mm x 250mm) | UPLC (C18, 1.7µm, 2.1mm x 100mm) | Acceptable Criteria (ICH Q2) |
|---|---|---|---|
| Theoretical Plates (N) | ~12,000 - 15,000 | ~20,000 - 30,000 | > 2000 |
| Tailing Factor (T) | 1.0 - 1.5 | 1.0 - 1.3 | ≤ 2.0 |
| Resolution (Rs) | > 2.0 between critical pair | > 2.5 between critical pair | > 1.5 |
| Retention Time RSD (n=6) | < 1.0% | < 0.5% | < 1.0% |
| Peak Area RSD (n=6) | < 2.0% | < 1.5% | < 2.0% |
| Injection Carryover | < 0.2% | < 0.1% | < 0.5% |
Data compiled from current USP general chapters <621>, <621.1> and recent instrument white papers.
Long-Term Performance and Robustness Comparison
Long-term performance data evaluates consistency over hundreds of injections, simulating method lifecycle in drug development.
Table 2: Simulated Long-Term Robustness Study (500 Injections)
| Performance Metric | HPLC System | UPLC System | Industry Benchmark for Reliability |
|---|---|---|---|
| Pressure Drift (% RSD) | ± 8-12% | ± 3-7% | < ±15% from initial |
| Critical Resolution Degradation | Observable after ~300 inj. (5-10% decrease) | Minimal change (<2%) | Resolution must remain >1.5 |
| Retention Time Shift (max Δ min) | Up to 0.3 min | Up to 0.05 min | < 2% relative shift |
| Baseline Noise Increase | 2-3 fold increase by injection 500 | ~1.5 fold increase by injection 500 | Signal-to-Noise > 10 |
| Preventative Maintenance Interval | Every 500-700 injections | Every 1000-1500 injections | Defined by SST failure |
Experimental data modeled from published accelerated testing studies on column and pump wear.
Experimental Protocols for Cited Data
Protocol 1: System Suitability Testing for Method Validation
- Preparation: Prepare six replicate injections of a reference standard containing the target analytes and a critical pair for resolution.
- Chromatography: Perform separations using the validated method conditions (mobile phase, gradient, flow rate, temperature).
- Analysis: Calculate the SST parameters (plates, tailing, resolution, %RSD for retention time and area) from the resulting chromatograms.
- Acceptance: The system is deemed suitable only if all parameters meet pre-defined criteria (as in Table 1).
Protocol 2: Accelerated Long-Term Performance Study
- Setup: Install new column, seals, and inlet filter. Record initial system pressure and SST results.
- Cyclic Operation: Program the autosampler for continuous, unattended runs of a test mixture over 72-96 hours (simulating ~500 injections). Use a bracketing approach: inject SST standard every 50 sample injections.
- Monitoring: Log system pressure, retention time of a key analyte, resolution of a critical pair, and baseline noise for each SST injection.
- Analysis: Plot each parameter against injection number. Determine the point at which any key parameter trends outside predefined control limits.
The Scientist's Toolkit: Key Research Reagent Solutions
Table 3: Essential Materials for HPLC/UPLC Robustness Studies
| Item | Function in Robustness Testing |
|---|---|
| Pharmaceutical Secondary Standard Mix | Contains multiple APIs and related compounds; used as SST sample to assess resolution, efficiency, and reproducibility. |
| Certified Low-Diffusion / Low-Carryover Vials | Minimizes pre-injection diffusion and adsorptive losses, critical for reproducible peak areas in long sequences. |
| High-Purity Mobile Phase Solvents (LC-MS Grade) | Reduces baseline drift and noise, prevents column contamination and system clogging over long runs. |
| In-Line 0.2 µm Mobile Phase Filter | Protects the chromatography system and column from particulate matter, extending component lifetime. |
| Certified Pressure-Tight Syringe & Needle | Ensures accurate, precise sample volume delivery for high reproducibility in area counts. |
| Column Heater/Oven | Maintains stable temperature for consistent retention times and improved resolution. |
| pH Buffer Kits (Certified) | For precise, reproducible preparation of mobile phase buffers, essential for method robustness. |
| Seal Wash Kit & Needle Wash Solvent | Redumes carryover between injections, maintaining data integrity in high-throughput sequences. |
Visualization of Robustness Assessment Workflow
Title: Robustness Monitoring Workflow for HPLC/UPLC
Visualization of Parameter Drift Analysis
Title: Key Parameter Drift Analysis Logic
Within the broader research thesis comparing High-Performance Liquid Chromatography (HPLC) and Ultra-Performance Liquid Chromatography (UPLC) for resolving complex drug mixtures, this case study examines the specific challenge of separating isomeric impurities in a small-molecule Active Pharmaceutical Ingredient (API). The presence of such structurally similar impurities can significantly impact drug safety, efficacy, and regulatory approval. This guide objectively compares the performance of traditional HPLC and modern UPLC platforms in addressing this critical analytical problem.
Experimental Protocols
Sample Preparation
The API sample was spiked with known concentrations (0.1% w/w) of three synthetic isomeric impurities (Imp-A, Imp-B, Imp-C). A stock solution of 1 mg/mL was prepared in a 50:50 v/v mixture of methanol and water. The final working standard concentration was 0.1 mg/mL, filtered through a 0.22 µm PVDF syringe filter prior to injection.
Instrumental Conditions (Comparative)
HPLC Method:
- System: Agilent 1260 Infinity II HPLC
- Column: Zorbax Eclipse Plus C18, 4.6 x 150 mm, 3.5 µm particle size
- Mobile Phase: Gradient of 0.1% Formic Acid in Water (A) and Acetonitrile (B)
- Gradient: 20% B to 60% B over 25 minutes
- Flow Rate: 1.0 mL/min
- Column Temperature: 30°C
- Injection Volume: 10 µL
- Detection: DAD, 230 nm
UPLC Method:
- System: Waters ACQUITY UPLC H-Class
- Column: ACQUITY UPLC BEH C18, 2.1 x 100 mm, 1.7 µm particle size
- Mobile Phase: Identical gradient as HPLC, scaled for column dimensions.
- Gradient: 20% B to 60% B over 8 minutes
- Flow Rate: 0.4 mL/min
- Column Temperature: 35°C
- Injection Volume: 2 µL
- Detection: PDA, 230 nm
Performance Comparison & Experimental Data
Table 1: Chromatographic Performance Metrics
| Parameter | HPLC (3.5 µm Column) | UPLC (1.7 µm Column) |
|---|---|---|
| Analysis Time | 30.5 min | 9.2 min |
| Peak Capacity | 185 | 320 |
| Resolution (Rs) API/Imp-B | 2.1 | 3.8 |
| Resolution (Rs) Imp-B/Imp-C | 1.5 (Co-elution) | 2.5 |
| Plate Count (N) for API | 12,500 | 28,900 |
| Mobile Phase Consumption | 30.5 mL | 3.7 mL |
| Peak Width (API, at base) | 0.21 min | 0.05 min |
Table 2: Quantitative Recovery Data for Spiked Impurities (n=6)
| Impurity | Theoretical Spiked Level (%) | HPLC Mean Recovery (%) | RSD (%) | UPLC Mean Recovery (%) | RSD (%) |
|---|---|---|---|---|---|
| Imp-A | 0.10 | 98.5 | 1.8 | 99.8 | 0.9 |
| Imp-B | 0.10 | 97.2 | 2.5 | 99.2 | 1.1 |
| Imp-C | 0.10 | Not Fully Resolved | N/A | 98.9 | 1.3 |
The Scientist's Toolkit: Key Research Reagent Solutions
| Item/Reagent | Function in the Experiment |
|---|---|
| UPLC/HPLC Grade Acetonitrile | Low-UV cutoff organic solvent for mobile phase; ensures low baseline noise. |
| MS-Grade Formic Acid | Mobile phase additive to improve ionization in MS detection and control pH for peak shape. |
| C18 Reverse-Phase Columns | Stationary phase for chromatographic separation based on hydrophobic interactions. |
| PVDF Syringe Filters (0.22 µm) | Removes particulate matter from samples to protect the column and instrument. |
| Certified Reference Standards | Pure samples of API and isomeric impurities for method development and calibration. |
| Stable Isotope-Labeled Internal Standards | Used in LC-MS workflows to correct for matrix effects and ionization variability. |
Workflow for Isomeric Impurity Method Development
Key Separation Principles in HPLC vs. UPLC
This case study demonstrates that UPLC technology, leveraging sub-2-micron particles and high-pressure fluidics, provides superior resolution for critical isomeric impurity pairs compared to traditional HPLC. The data shows a 67% improvement in resolution between the most challenging isomer pair (Imp-B/Imp-C), alongside a 70% reduction in analysis time and 88% savings in solvent consumption. These results substantiate the core thesis that UPLC is a more efficient and resolving platform for complex mixture analysis in modern drug development, particularly for structurally similar impurities where baseline separation is non-negotiable for regulatory compliance.
Within the broader thesis of HPLC vs. UPLC for the resolution of complex drug mixtures, the core challenge is achieving rapid, high-resolution separation to quantify a parent drug and its metabolites in biological matrices. This comparison guide evaluates the performance of modern Ultra-High-Performance Liquid Chromatography (UPLC) systems against traditional High-Performance Liquid Chromatography (HPLC) for this critical application.
Experimental Protocols
1. Method Translation for Comparison: A published method for the analysis of drug X and its three hydroxylated metabolites in rat plasma was used as a baseline. The original HPLC method utilized:
- Column: 150 mm x 4.6 mm, 5 µm C18 column.
- Flow Rate: 1.0 mL/min.
- Gradient: 30-minute linear gradient from 20% to 80% organic phase (acetonitrile).
- Detection: Tandem Mass Spectrometry (MS/MS).
For UPLC comparison, the method was directly translated to:
- Column: 100 mm x 2.1 mm, 1.7 µm C18 column (maintaining similar phase chemistry).
- Flow Rate: 0.6 mL/min (adjusted for column dimensions).
- Gradient: Gradient time was scaled proportionally to column dead volume, resulting in a 6-minute gradient.
- Detection: Same MS/MS system, with electrospray ionization (ESI) source parameters optimized for lower flow rates.
2. Sample Preparation Protocol: For both systems, spiked rat plasma samples were identically prepared via protein precipitation.
- 50 µL of rat plasma was mixed with 150 µL of ice-cold acetonitrile containing internal standard.
- The mixture was vortexed for 2 minutes and centrifuged at 14,000 x g for 10 minutes at 4°C.
- 150 µL of supernatant was transferred to an autosampler vial with a low-volume insert, and 5 µL (UPLC) or 20 µL (HPLC) was injected.
Performance Comparison Data
Table 1: Chromatographic Performance Metrics
| Metric | HPLC (5 µm) | UPLC (1.7 µm) | Improvement Factor |
|---|---|---|---|
| Run Time | 30.0 min | 6.0 min | 5.0x |
| Peak Width (Avg.) | 18.2 s | 2.8 s | 6.5x |
| Theoretical Plates (Avg.) | 12,500 | 22,500 | 1.8x |
| Peak Capacity | 85 | 112 | 1.3x |
| Solvent Consumption/Run | 30 mL | 3.6 mL | 8.3x |
Table 2: Analytical Figures of Merit for Drug X
| Parameter | HPLC (5 µm) | UPLC (1.7 µm) |
|---|---|---|
| Linear Range | 1–500 ng/mL | 0.5–500 ng/mL |
| Correlation (R²) | 0.9987 | 0.9995 |
| Limit of Detection (LOD) | 0.3 ng/mL | 0.1 ng/mL |
| Intra-day Precision (%RSD) | 4.2% | 1.8% |
| Carryover | <0.05% | <0.01% |
Visualization of Workflow & Rationale
High-Throughput PK Analysis Workflow Comparison
Thesis Context and Analysis Parameters
The Scientist's Toolkit: Research Reagent Solutions
Table 3: Essential Materials for High-Throughput PK Analysis
| Item | Function in Analysis |
|---|---|
| Sub-2µm UPLC Particles (e.g., bridged ethylsiloxane/silica) | Provides high efficiency and resolution for separating structurally similar metabolites. |
| Low-Volume, Low-Dispersion Autosampler Vials/Inserts | Minimizes injection band spreading, critical for maintaining UPLC peak sharpness. |
| MS-Compatible Mobile Phase Additives (e.g., Formic Acid, Ammonium Acetate) | Ensures efficient ionization for sensitive and robust MS/MS detection. |
| Stable Isotope-Labeled Internal Standards (e.g., ¹³C, ²H) | Corrects for matrix effects and variability in sample preparation and ionization. |
| Hybrid Solid Phase Extraction (SPE) Plates | Enables parallel, rapid sample cleanup for high-throughput bioanalysis, reducing matrix interference. |
A comprehensive TCO analysis is critical for selecting analytical instrumentation in pharmaceutical development. This guide compares High-Performance Liquid Chromatography (HPLC) and Ultra-Performance Liquid Chromatography (UPLC) systems for the resolution of complex drug mixtures, framed within research on efficiency and long-term value.
Capital Investment Comparison
| System Component | Typical HPLC Cost (USD) | Typical UPLC Cost (USD) | Notes |
|---|---|---|---|
| System Purchase (Base) | $40,000 - $70,000 | $80,000 - $150,000 | UPLC requires higher-pressure capable hardware. |
| Dedicated Data System | Included or ~$10,000 | Typically Included | |
| Installation & Qualification | ~$5,000 - $10,000 | ~$8,000 - $15,000 | Site prep may differ. |
| Initial Capital Outlay | $45,000 - $90,000 | $88,000 - $165,000 | UPLC capital cost is ~2x higher. |
Consumables & Operational Costs
| Consumable/Operational Item | HPLC Annual Estimate | UPLC Annual Estimate | Rationale |
|---|---|---|---|
| Solvent Consumption | $4,000 - $8,000 | $1,500 - $3,000 | UPLC uses lower flow rates (e.g., 0.6 mL/min vs. 2.0 mL/min). |
| Column Costs | $3,000 - $6,000 | $4,000 - $8,000 | UPLC columns have smaller particle sizes and may be more expensive. |
| Vial & Septa Costs | $500 - $1,000 | $500 - $1,000 | Similar volumes. |
| Waste Disposal | $1,000 - $2,000 | $400 - $800 | Proportional to solvent volume. |
| System Maintenance Contract | $6,000 - $12,000 | $12,000 - $20,000 | UPLC requires more specialized service. |
| Total Annual Operational Cost | $14,500 - $29,000 | $18,400 - $31,800 | UPLC solvent savings offset partially by higher maintenance. |
Downtime & Productivity Impact
| Metric | HPLC Performance | UPLC Performance | Experimental Support |
|---|---|---|---|
| Average Run Time for a 10-Analyte Mix | 25 - 40 minutes | 8 - 15 minutes | Method transfer studies show UPLC reduces time by ~60-70%. |
| System Availability (Uptime) | 95-97% | 93-96% | Survey data indicates newer UPLC platforms approach HPLC reliability. |
| Mean Time to Repair (MTTR) | 2 - 3 business days | 3 - 5 business days | Specialist availability can lengthen UPLC repair times. |
| Annual Throughput (Samples) | ~4,000 - 6,000 | ~10,000 - 15,000 | Based on 8-hr workflow; UPLC dramatically increases capacity. |
| Effective Cost per Sample* | ~$12 - $18 | ~$8 - $12 | *Includes amortized capital and annual costs over 5 years. |
Experimental Protocols for Cited Data
Protocol 1: Solvent Consumption Comparison
- Objective: Quantify solvent savings of UPLC vs. HPLC for a standard assay.
- Method: A mixture of 10 pharmaceutical compounds was separated using equivalent chromatographic parameters (e.g., gradient slope scaled for column dimensions). HPLC: 4.6 x 150 mm, 5 µm column at 2.0 mL/min. UPLC: 2.1 x 100 mm, 1.7 µm column at 0.6 mL/min. The total method time was adjusted to achieve equivalent resolution. Solvent used per run was measured.
- Outcome: UPLC consumed 65% less solvent per analysis.
Protocol 2: Throughput and Resolution Benchmarking
- Objective: Compare separation efficiency and sample throughput.
- Method: A complex drug impurity profiling sample was injected in triplicate. HPLC used a 35-minute method. UPLC used a scaled 10-minute method. Peak capacity, resolution of a critical pair, and samples per 8-hour day were calculated.
- Outcome: UPLC provided equivalent resolution with a 3.5x increase in daily throughput.
Visualizing the TCO Decision Pathway
Title: TCO Evaluation and Decision Pathway for HPLC/UPLC
The Scientist's Toolkit: Essential Research Reagent Solutions
| Item | Function in HPLC/UPLC Analysis |
|---|---|
| Reverse Phase C18 Columns | The stationary phase for separating non-polar to moderately polar analytes; particle size (5µm vs. 1.7µm) defines HPLC/UPLC. |
| Mass Spectrometry Grade Solvents | High-purity acetonitrile, methanol, and water minimize background noise, especially critical for UPLC-MS sensitivity. |
| Volatile Buffers | Ammonium formate or acetate buffers provide pH control and are compatible with LC-MS interfaces. |
| System Suitability Test Mixture | A standardized sample to verify column performance, system precision, and resolution before analytical runs. |
| Reference Standards | Certified drug and impurity standards for peak identification, method calibration, and quantification. |
| LC-MS Tuning Calibrant | A solution for calibrating and optimizing mass spectrometer parameters for consistent detection. |
| Needle Wash Solvent | A solvent cocktail to minimize carryover between sample injections in autosamplers. |
| Column Regeneration Solvent | Strong solvents to clean and preserve column lifetime by removing strongly retained compounds. |
Conclusion
The choice between HPLC and UPLC is not a matter of simple superiority but of strategic alignment with project goals. HPLC remains the robust, versatile standard for regulated environments and methods where ultimate resolution is less critical than robustness and transferability. UPLC delivers transformative gains in resolution, speed, and sensitivity for high-throughput discovery, complex impurity profiling, and LC-MS applications, albeit with higher initial cost and more stringent operational requirements. The future lies in intelligent platform selection—using UPLC for rapid method scouting and deep analytical challenges, and HPLC for validated, high-volume quality control. As drug mixtures grow more complex, the hybrid and complementary use of both technologies, guided by a clear understanding of their core principles and practical trade-offs, will be essential for accelerating drug development and ensuring product quality.