Accuracy Assessment in Bioanalysis: A Comprehensive Guide to Reference Standards vs. Spike Recovery Methods
This article provides a detailed examination of two cornerstone techniques for assessing method accuracy in bioanalysis and pharmaceutical research: the Reference Standard Comparison and the Spike Recovery Experiment.
Accuracy Assessment in Bioanalysis: A Comprehensive Guide to Reference Standards vs. Spike Recovery Methods
Abstract
This article provides a detailed examination of two cornerstone techniques for assessing method accuracy in bioanalysis and pharmaceutical research: the Reference Standard Comparison and the Spike Recovery Experiment. Aimed at researchers, scientists, and drug development professionals, it explores the foundational concepts, practical application methodologies, troubleshooting strategies, and comparative validation of each approach. By analyzing their principles, appropriate use cases, and compliance with regulatory guidelines (ICH, FDA, EMA), this guide equips practitioners to select and implement the optimal accuracy assessment strategy for their specific analytical challenges, from pharmacokinetics to biomarker validation.
Foundations of Accuracy: Defining Reference Standards and Spike Recovery in Bioanalytical Science
What is Method Accuracy? Core Definitions and Regulatory Importance (ICH Q2(R1), FDA Bioanalytical Method Validation)
Core Definitions and Regulatory Framework
Method Accuracy is defined as the closeness of agreement between the value which is accepted either as a conventional true value or an accepted reference value and the value found. It is a fundamental parameter in analytical method validation, quantifying systematic error (bias).
Regulatory Importance: Both ICH Q2(R1) and FDA Bioanalytical Method Validation guidance mandate accuracy assessment to ensure data reliability for critical decisions in drug development, manufacturing, and clinical trials.
- ICH Q2(R1): For pharmaceutical drug substance and product analysis, accuracy should be established across the specified range of the procedure, typically using a minimum of 9 determinations over a minimum of 3 concentration levels.
- FDA Bioanalytical Method Validation: For bioanalytical methods (e.g., pharmacokinetic studies), accuracy is measured as the percent of bias (deviation from the nominal concentration). Mean accuracy should be within ±15% of the nominal value, except at the lower limit of quantification (LLOQ), where it must be within ±20%.
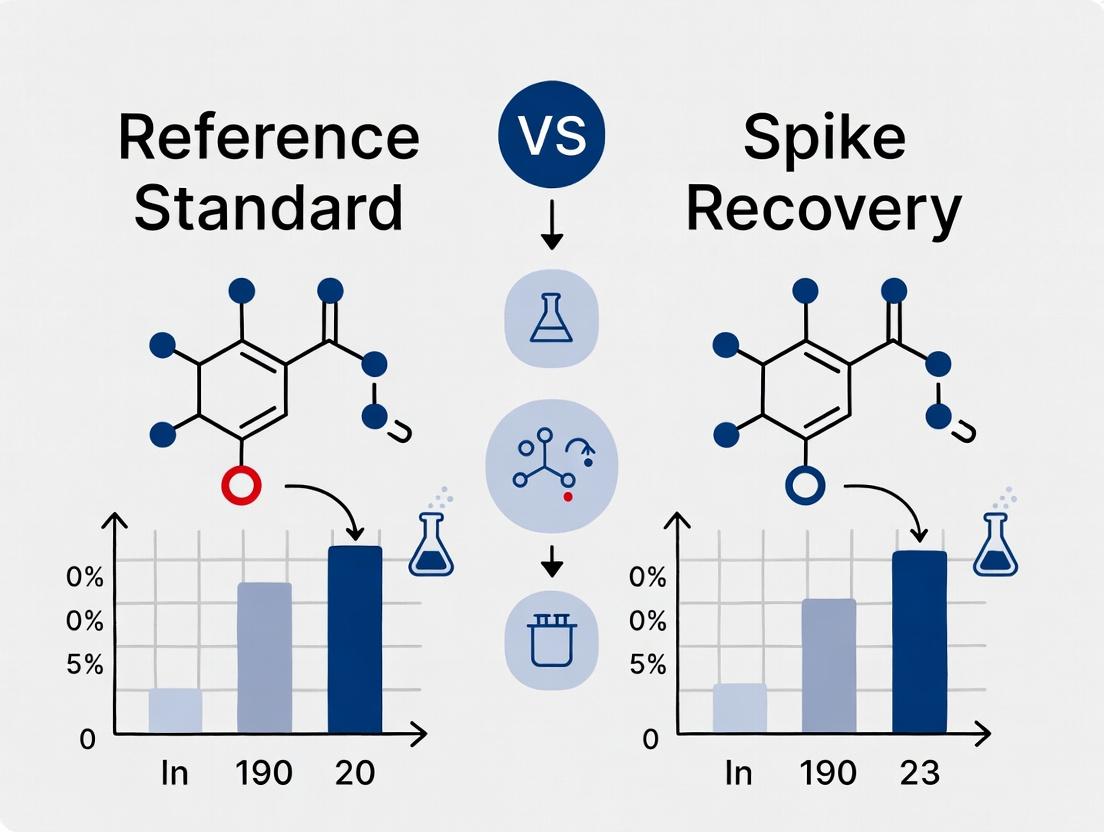
Accuracy Assessment: Reference Standard vs. Spike Recovery
Within the broader thesis on accuracy assessment methodologies, two primary experimental approaches are compared: the use of certified reference standards and spike recovery in a matrix.
Spike Recovery is the traditional approach, especially in bioanalysis, where a known amount of analyte is added (spiked) into a blank biological matrix. The measured concentration is compared to the nominal spiked concentration.
- Use Case: Essential for complex matrices (plasma, serum, tissue) where a true blank can be obtained. It assesses the method's ability to accurately measure the analyte despite matrix effects.
- Limitation: Does not account for the extraction efficiency of the endogenous, native form of the analyte already present in real samples.
Reference Standard Comparison involves analyzing a certified reference material (CRM) with a known, traceable concentration or comparing results from the new method to those from a well-characterized, independent reference method.
- Use Case: The gold standard for drug substance and product assay validation. It directly assesses bias against a traceable "true value."
- Limitation: Certified reference materials may not be available for all analytes or may not be formulated in the relevant sample matrix.
Experimental Comparison: Accuracy Assessment Methods
Table 1: Comparison of Accuracy Assessment Methodologies
| Feature | Reference Standard Method | Spike Recovery Method |
|---|---|---|
| Primary Use | Drug substance/product assay, impurity quantification | Bioanalytical methods (PK studies), environmental analysis |
| "True Value" Basis | Certified Reference Material (CRM) or Reference Method | Nominal spiked concentration |
| Matrix Considerations | Often simple or ideal matrices (solution, dosage form) | Complex, relevant biological/field matrices (plasma, urine, soil) |
| Measures | Overall method bias | Recovery and matrix effects combined |
| Regulatory Citation | ICH Q2(R1) (as "Comparison with a Reference Standard") | FDA Bioanalytical Validation (as "Accuracy/Recovery") |
| Typical Data Requirement | Min. 9 determinations over 3 levels vs. CRM | Min. 5 determinations per QC level (LLOQ, Low, Mid, High) |
Table 2: Example Accuracy Data from a Comparative LC-MS/MS Study (Therapeutic Drug in Human Plasma)
| Accuracy Assessment Method | Nominal Concentration (ng/mL) | Mean Measured Concentration (ng/mL) | % Bias | %RSD | Meets FDA Criteria (±15%)? |
|---|---|---|---|---|---|
| Spike Recovery (n=5) | 2.00 (LLOQ) | 1.87 | -6.5% | 4.8% | Yes (within ±20%) |
| 6.00 (Low QC) | 6.21 | +3.5% | 3.2% | Yes | |
| 75.00 (Mid QC) | 78.90 | +5.2% | 2.1% | Yes | |
| 150.00 (High QC) | 142.50 | -5.0% | 2.5% | Yes | |
| Reference Standard Method* (n=6) | 100.00 (CRM in solvent) | 98.30 | -1.7% | 1.5% | Yes |
*Reference method was a validated HPLC-UV assay using a USP-grade reference standard.
Experimental Protocols
Protocol 1: Accuracy by Spike Recovery (Per FDA Guidance)
- Preparation of Blank Matrix: Obtain and confirm the absence of the analyte/interference in the biological matrix (e.g., human plasma from multiple donors).
- Spiking: Prepare Quality Control (QC) samples by spiking the analyte and internal standard into the blank matrix at four concentration levels: LLOQ, Low (3x LLOQ), Mid (mid-range), and High (high-range, near ULOQ).
- Sample Processing: Process the QC samples alongside a freshly prepared calibration curve using the validated sample preparation protocol (e.g., protein precipitation, liquid-liquid extraction).
- Analysis & Calculation: Analyze samples via the analytical platform (e.g., LC-MS/MS). Calculate the concentration of each QC from the calibration curve. Determine mean accuracy as (Mean Observed Concentration / Nominal Concentration) x 100%.
Protocol 2: Accuracy by Reference Standard (Per ICH Q2(R1))
- Procurement of CRM: Obtain a certified reference material with documented purity and traceability (e.g., from USP, EP, or a qualified supplier).
- Sample Preparation: Prepare a minimum of 9 separate determinations over the specified range (e.g., 80%, 100%, 120% of target concentration). This involves weighing/pippetting the CRM and dissolving/diluting to the target concentrations using appropriate solvents.
- Analysis: Analyze the prepared solutions using the method under validation.
- Calculation: For each determination, calculate the measured content as a percentage of the theoretical content based on the CRM. Report the overall mean accuracy and the confidence interval.
Diagram: Accuracy Assessment Strategy Selection
The Scientist's Toolkit: Key Research Reagent Solutions
Table 3: Essential Materials for Accuracy Validation Experiments
| Item | Function in Accuracy Assessment |
|---|---|
| Certified Reference Standard (CRM) | Provides the primary benchmark for the "true value." Must be of documented purity and traceable to a recognized standard body. |
| Analyte Stock Solution | A stable, accurately prepared solution of the analyte used for spiking calibration and QC samples. |
| Stable Isotope-Labeled Internal Standard (SIL-IS) | Critical for mass spectrometry. Corrects for variability in sample prep and ionization, improving accuracy and precision. |
| Control Blank Matrix | Biological matrix (e.g., charcoal-stripped plasma, surrogate matrix) verified to be free of the analyte, used for preparing calibration standards and QC samples. |
| Quality Control (QC) Samples | Prepared at low, mid, and high concentrations in the control matrix. Used to assess the accuracy and precision of each analytical run. |
| Calibrator Samples | A series of samples with known concentrations (calibration curve) used to quantify unknowns and QCs. The accuracy of their preparation underpins all results. |
In the rigorous world of analytical science, the validation of accuracy is paramount. This discussion is framed within a critical thesis on accuracy assessment methods, specifically comparing the use of a well-characterized reference standard against the common practice of spike recovery research. While spike recovery assesses method precision and bias in a matrix, it often relies on non-certified materials, leaving gaps in establishing true analytical accuracy traceable to SI units. Certified Reference Materials (CRMs) are the cornerstone for closing this gap, providing an unequivocal anchor for measurement traceability and method validation.
Defining the CRM: Source, Traceability, and Purity in Practice
A CRM is a material, sufficiently homogeneous and stable with respect to one or more specified properties, which has been established to be fit for its intended use in measurement. Its value is not in its purity alone but in the certified property value (e.g., concentration, identity), the associated uncertainty, and a metrological traceability chain.
- Source: CRMs are produced by accredited Reference Material Producers (RMPs) like NIST, LGC, ERM, and BAM. Their sourcing involves stringent production protocols, from raw material selection to final vialing.
- Traceability: This is the documented, unbroken chain of calibrations linking the CRM's property value to a primary standard (e.g., SI unit). This chain includes all stated measurement uncertainties.
- Purity: For chemical CRMs, purity is a critical property but is distinct from the certified value. A 99.5% pure material does not certify the concentration of a specific analyte in a solution; that requires separate characterization.
Comparative Guide: CRM vs. High-Purity Laboratory Standard vs. Spike Recovery Material
The table below objectively compares the performance of a CRM against two common alternatives in the context of validating an LC-MS/MS method for the quantification of an API (Active Pharmaceutical Ingredient) in plasma.
Table 1: Performance Comparison for Method Validation of API in Plasma
| Performance Characteristic | Certified Reference Material (CRM) | High-Purity In-House Standard | Generic Compound for Spike Recovery |
|---|---|---|---|
| Traceability | Full, documented chain to SI units (mol/kg). | Typically limited to in-house balance/volumetric equipment. | Often unknown or to supplier's in-house standard. |
| Certified Value & Uncertainty | Yes. Provided with a stated measurement uncertainty (e.g., 99.7 ± 0.2 mg/g). | No. Assumed purity based on supplier CoA. Uncertainty is not formally assessed. | No. Purity may be listed, but not for the specific matrix application. |
| Role in Accuracy Assessment | Definitive. Direct assessment of method accuracy and trueness against a known value. | Presumptive. Assumes accuracy if purity is correct. Cannot identify bias in the method itself. | Indirect. Assesses method precision and recovery in matrix, but not absolute trueness. |
| Experimental Result (Mean % of Nominal) | 100.2% (Range: 98.5% - 101.8%) | 98.5% (Range: 96.0% - 101.0%) | 102.5% (Range: 85.0% - 115.0%) |
| Observed Uncertainty (k=2) | ± 1.5% | ± 3.0% (estimated) | ± 12.0% |
| Primary Use Case | Calibration, definitive method validation, establishing measurement traceability. | Routine calibration where full CRM traceability is not mandated. | Assessing matrix effects and extraction efficiency during method development. |
Supporting Experimental Data: A cross-laboratory study was conducted where the same LC-MS/MS method protocol was used to quantify a certified API concentration in a human plasma CRM (NIST SRM 9999) versus a spiked sample using a high-purity commercial standard.
Experimental Protocol 1: Accuracy Assessment Using a Matrix CRM
- Reconstitution: Allow the frozen human plasma CRM (certified for API X at 25.6 ± 0.8 ng/mL) to equilibrate at room temperature. Mix gently.
- Sample Preparation: Aliquot 100 µL of CRM into a microcentrifuge tube. Add 300 µL of acetonitrile containing an internal standard (ISTD) for protein precipitation.
- Analysis: Vortex mix, centrifuge at 15,000 x g for 10 min. Transfer supernatant for LC-MS/MS analysis using a calibration curve prepared from a separate, traceable API stock solution.
- Data Calculation: Calculate the measured concentration from the instrument response (analyte/ISTD peak area ratio) against the calibration curve. Compare the mean of 6 replicates to the certified value.
Experimental Protocol 2: Spike Recovery Assessment
- Blank Matrix: Obtain analyte-free human plasma.
- Spiking: Spike the blank plasma with a known mass of a high-purity (>98%) commercial API standard at a concentration matching the CRM (25.6 ng/mL).
- Preparation & Analysis: Process and analyze identical to Protocol 1, using the same calibration curve.
- Data Calculation: Calculate the recovery as (Measured Concentration of Spike / Nominal Spike Concentration) * 100%.
The Scientist's Toolkit: Research Reagent Solutions for CRM-Based Validation
| Item | Function in CRM-Based Experiments |
|---|---|
| Matrix CRM | Provides the sample matrix with a certified analyte concentration. Used as the benchmark for assessing method accuracy/trueness. |
| Neat/Pure Substance CRM | A high-purity chemical with certified identity and/or purity. Used to prepare primary calibration standards traceable to the CRM. |
| Internal Standard (ISTD) CRM | A certified isotopically labeled analog of the analyte. Corrects for sample preparation and ionization variability in MS. |
| Mass Spectrometry Grade Solvents | Ultra-pure solvents (ACN, MeOH, water) with minimal background interference. Critical for sensitive detection in LC-MS. |
| Calibrated Volumetric Glassware | Class A pipettes, flasks, and micro-syringes with certification. Ensures accurate delivery and dilution for preparing standards. |
| Stable Isotope Labeled Spike | Used in isotope dilution mass spectrometry (IDMS), the gold standard method often used by RMPs to certify CRM values. |
The data and workflows demonstrate that while spike recovery is a useful tool for evaluating method precision and matrix effects, only a CRM can provide an irrefutable anchor for accuracy and trueness. The traceability and comprehensive uncertainty budget of a CRM integrate directly into a robust quality system, moving beyond relative comparisons to absolute, defensible measurement. For research and drug development where decisions hinge on precise data—such as pharmacokinetic studies or biomarker quantification—the CRM is not merely a reagent but a fundamental component of the measurement infrastructure.
Within the broader thesis on accuracy assessment methods, comparing Reference Standard versus Spike Recovery research, this guide examines the theoretical and practical application of spike recovery (known addition) as a fundamental technique for assessing method accuracy in complex biological matrices. Spike recovery experiments directly quantify the proportionality of an analytical method by measuring the fraction of a known quantity of analyte recovered from a sample matrix. This guide provides a comparative analysis of experimental protocols, reagent solutions, and data interpretation against alternative accuracy assessment strategies.
The theory of known additions posits that adding a known quantity of pure analyte (the "spike") to a sample with an unknown endogenous concentration allows for the calculation of method recovery. The percent recovery is calculated as: (Measured Concentration after Spike – Measured Concentration before Spike) / Known Spiked Concentration * 100%. This is contrasted with validation using certified reference standards in neat solution, which may not account for matrix effects.
Comparative Guide: Spike Recovery vs. Alternative Accuracy Methods
The following table summarizes the core performance characteristics of spike recovery versus other common accuracy assessment approaches in bioanalytical method validation.
Table 1: Comparison of Accuracy Assessment Methodologies
| Method | Typical Recovery Range | Key Strength | Primary Limitation | Ideal Use Case |
|---|---|---|---|---|
| Spike Recovery (Known Addition) | 85-115% | Directly measures matrix effect & proportionality; uses real sample matrix. | Requires analyte-free matrix for true "pre-spike" baseline; endogenous levels can interfere. | LC-MS/MS method validation for drugs/metabolites in plasma, urine. |
| Certified Reference Standard (Neat Solution) | 98-102% | Highest purity and traceability to SI units; no matrix complexity. | Does not evaluate extraction efficiency or ion suppression/enhancement from matrix. | Calibrating instrument response; reference method development. |
| Standard Addition (Multiple Additions) | 85-115% | Eliminates need for analyte-free matrix; built-in calibration in same matrix. | More sample intensive; complex data processing; destroys sample. | Analyzing samples with variable or unknown matrix composition (e.g., tissue homogenates). |
| Cross-Validation with Reference Method | Method Dependent | Provides "true" benchmark if reference method is superior. | A definitive reference method is often unavailable or prohibitively expensive. | Validating a new, faster/cheaper method against an established gold-standard (e.g., HPLC vs. ELISA). |
Experimental Protocol: Standard Spike Recovery Workflow
A standard experiment to determine recovery for a pharmacokinetic study of Compound X in human plasma is detailed below.
Protocol:
- Prepare Matrix Lots: Obtain at least six independent lots of the biological matrix (e.g., human plasma from different donors). One lot is designated as the "blank" if possible.
- Create QC Samples:
- Low QC: Spike analyte at 3x the Lower Limit of Quantification (LLOQ) into each matrix lot.
- Mid QC: Spike analyte near the mid-point of the calibration curve.
- High QC: Spike analyte at 75-85% of the Upper Limit of Quantification (ULOQ).
- Prepare Calibrators: Prepare calibration standards in the same type of matrix, ideally by spiking into a pooled matrix lot.
- Analyze Samples: Process and analyze all QC samples (spiked post-extraction for absolute recovery comparison, if required) and calibrators using the candidate method (e.g., LC-MS/MS).
- Calculate Recovery: For each QC level in each matrix lot, calculate % Recovery = (Measured Concentration / Nominal Spiked Concentration) * 100%.
- Data Acceptance: Mean recovery across all matrix lots should be within 85-115%, with a relative standard deviation (RSD) of ≤15%.
Title: Spike Recovery Experimental Workflow
Supporting Experimental Data Comparison
The following data, synthesized from recent literature and regulatory guidance, illustrates typical performance outcomes.
Table 2: Example Recovery Data for Drug 'X' in Human Plasma via LC-MS/MS
| Matrix Lot | LLOQ (1 ng/mL) | Low QC (3 ng/mL) | Mid QC (50 ng/mL) | High QC (800 ng/mL) |
|---|---|---|---|---|
| Lot 1 | 102% | 95% | 101% | 98% |
| Lot 2 (Lipemic) | 88% | 91% | 105% | 99% |
| Lot 3 (Hemolyzed) | 105% | 98% | 97% | 102% |
| Lot 4 | 98% | 102% | 103% | 96% |
| Lot 5 | 94% | 96% | 99% | 101% |
| Lot 6 | 101% | 94% | 102% | 97% |
| Mean % Recovery | 98.0% | 96.0% | 101.2% | 98.8% |
| % RSD | 6.5% | 4.0% | 2.8% | 2.3% |
| Result | Pass | Pass | Pass | Pass |
Interpretation: The consistent recoveries (85-115%) and low RSDs (≤15%) across six distinct matrix lots, including those with potential interferences (lipemic, hemolyzed), demonstrate the method's robustness and lack of significant matrix effect for Drug X.
The Scientist's Toolkit: Essential Research Reagent Solutions
Table 3: Key Reagents & Materials for Spike Recovery Studies
| Item | Function & Rationale |
|---|---|
| Certified Reference Standard | High-purity, well-characterized analyte provides the known quantity for spiking. Essential for traceability and accuracy. |
| Analyte-Free Matrix | Matrix stripped of endogenous analyte (if possible) to establish a true "pre-spike" baseline. Often used for calibration standards. |
| Multiple Independent Matrix Lots | Biological matrices (plasma, serum, tissue) from ≥6 different sources to assess variability and universal applicability of the method. |
| Stable Isotope-Labeled Internal Standard (SIL-IS) | Isotopically labeled version of the analyte added to all samples. Corrects for losses during sample prep and ion suppression in MS. |
| Matrix-Matched Calibrators | Calibration standards prepared in the same biological matrix as samples, compensating for some matrix effects during quantification. |
| Quality Control (QC) Materials | Samples spiked at low, mid, and high concentration levels, used to monitor the performance of each analytical batch. |
Logical Framework for Accuracy Assessment Selection
The decision to use spike recovery, reference standards, or another method depends on the research question and sample constraints.
Title: Decision Pathway for Accuracy Assessment Methods
Spike recovery remains an indispensable, practical tool for accuracy assessment in the analysis of complex samples. Its primary strength lies in its direct simulation of the analytical process for real samples, thereby integrating variables like extraction efficiency and matrix effects into the accuracy result. While certified reference standards provide the foundational traceability chain, and cross-validation offers the highest-order check, spike recovery experiments provide the critical evidence that a method is both accurate and robust within its intended matrix environment, a non-negotiable requirement in regulated drug development research.
In the quantitative analysis of pharmaceuticals and biologics, accuracy assessment is foundational. Two dominant philosophical frameworks exist: one that relies on the "absolute truth" of a certified reference standard (Reference Method), and another that pragmatically measures recovery of a known, spiked quantity from a complex matrix (Spike Recovery). This guide contrasts their performance, experimental approaches, and applications.
Core Philosophical Comparison
The "Absolute Truth" (Reference) approach assumes a pure, well-characterized reference material provides the definitive benchmark for quantification. In contrast, the "Measured Recovery" (Spike) approach acknowledges matrix effects and methodological bias, using recovery as a direct measure of accuracy within a specific experimental context.
Experimental Data & Performance Comparison
Recent studies highlight the practical differences between these paradigms, particularly in complex matrices like serum or cell lysate.
Table 1: Comparison of Accuracy Assessment Outcomes in an LC-MS/MS Assay for a Monoclonal Antibody
| Analyte/Spike Level | Reference Standard Method (Reported Conc.) | Spike Recovery Method (% Recovery) | Matrix | Key Implication |
|---|---|---|---|---|
| Theoretical "Truth" | 100.0 µg/mL (certified value) | 100.0 µg/mL (spiked amount) | Buffer | Methods converge in simple matrix. |
| In Serum, Low (5 µg/mL) | 4.2 µg/mL | 84% | Human Serum | Reference method may not correct for matrix loss. |
| In Serum, High (100 µg/mL) | 88.5 µg/mL | 88.5% | Human Serum | Recovery reveals consistent proportional bias. |
| In Cell Lysate, Med (20 µg/mL) | 15.1 µg/mL | 75.5% | CHO Lysate | Complex matrix introduces significant interference. |
Table 2: Method Characteristics and Suitability
| Feature | Absolute Truth (Reference) Philosophy | Measured Recovery (Spike) Philosophy |
|---|---|---|
| Primary Goal | Establish a traceable chain of measurement to a primary standard. | Determine the practical, operational accuracy of an assay in its intended matrix. |
| Accuracy Claim | Closeness to the reference material's value. | Percentage of a known added amount that is measured. |
| Handles Matrix Effects | Indirectly; assumes calibration curve corrects for them. | Directly; recovery quantifies the net effect of matrix. |
| Best For | Release testing, regulatory filing, where a definitive standard exists. | Method development, biomarker assays in complex fluids, where a pristine standard is unavailable. |
| Major Limitation | Reference material may not behave identically to analyte in native sample. | Requires a blank matrix and assumes the spike behaves identically to endogenous analyte. |
Detailed Experimental Protocols
Protocol 1: Establishing Accuracy via Certified Reference Standard
- Standard Preparation: Serially dilute the certified reference material (CRM) in a suitable solvent to create a calibration curve (e.g., 1-100 µg/mL).
- Sample Analysis: Dilute the test sample to fall within the calibration curve range. Process alongside standards.
- Quantification: Plot instrument response vs. standard concentration. Fit a regression model (e.g., linear, quadratic). Interpolate the sample response to determine concentration relative to the CRM.
- Accuracy Calculation: Report the measured concentration. Implicit accuracy is traceability to the CRM.
Protocol 2: Determining Accuracy via Spike Recovery Experiment
- Blank Matrix Sourcing: Obtain the biological matrix of interest (e.g., drug-naive serum) that is free of the target analyte.
- Spike Preparation: Add a known mass of the analyte (working standard) into aliquots of the blank matrix to create at least three concentration levels (Low, Medium, High). Prepare in replicates (n≥3).
- Control Samples: Prepare identical spikes in a simple solution (e.g., PBS) to represent 100% recovery potential. Also process unspiked matrix blanks.
- Sample Processing: Subject all spiked matrix samples, solvent spikes, and blanks to the full analytical method (extraction, digestion, LC-MS, etc.).
- Quantification & Calculation: Quantify all samples using a calibration curve (often prepared in solvent). Calculate percent recovery: Recovery % = (Measured concentration in spiked matrix – Measured concentration in blank matrix) / Theoretical spiked concentration * 100.
Signaling Pathway for Accuracy Assessment Philosophy
Title: Decision Pathway for Accuracy Assessment Methods
Experimental Workflow for Spike Recovery
Title: Spike Recovery Experimental Workflow
The Scientist's Toolkit: Key Research Reagent Solutions
Table 3: Essential Materials for Reference vs. Spike Recovery Experiments
| Item | Function in Reference Method | Function in Spike Recovery Method |
|---|---|---|
| Certified Reference Material (CRM) | Serves as the primary, traceable "absolute" standard for calibration. | Often used as the source of the spike, but its value is not the final truth claim. |
| Blank/Charcoal-Stripped Matrix | Used less frequently, for specificity checks. | Critical. Provides the interference-containing background for spiking. Must be confirmed analyte-free. |
| Stable Isotope-Labeled Internal Standard (SIL-IS) | Corrects for instrument variability and sample prep losses. | Critical. Differentiates spiked analyte from endogenous (if present) and corrects for process efficiency. |
| Matrix-Matched Calibrators | Sometimes used to improve accuracy by mimicking sample background. | Less common; the recovery experiment itself assesses the need for them. |
| Quality Control (QC) Samples | Prepared from a separate weighing of CRM to monitor assay performance. | Typically are the spiked matrix samples at low, mid, and high concentrations. |
Within the broader thesis on accuracy assessment, two principal methodologies emerge for validating analytical procedures: comparison to a reference standard and spike-and-recovery (or simply, recovery) experiments. The choice between them is dictated by regulatory guidelines, the nature of the analyte, and the specific analytical question.
Thesis Context: A robust accuracy assessment is foundational in bioanalytical and pharmaceutical chemistry. The overarching thesis posits that the selection of a validation method is not arbitrary but is a direct function of the measurand's definability and matrix availability. The reference standard method is the epistemological ideal, used when a true value can be established. The recovery method is a pragmatic necessity for complex matrices where the true value is inherently uncertain, serving as a measure of proportional error rather than absolute truth.
Comparative Guide: Reference Standard vs. Spike Recovery
The following table delineates the primary applications, mandates, and performance characteristics of both methods based on current regulatory guidance (ICH Q2(R1), FDA Bioanalytical Method Validation) and recent research.
| Assessment Criteria | Reference Standard Method | Spike-and-Recovery Method |
|---|---|---|
| Core Definition | Comparison of results from the test method to those from a well-characterized reference method of higher accuracy. | Measurement of the proportion of a known amount of analyte added to (spiked into) a matrix that is recovered by the test method. |
| Primary Application / When Mandated | For definitive methods, purity assays, potency assays, and when a fully validated reference method exists. Mandated for assay validation where the analyte is fully available in a pure, stable form (e.g., active pharmaceutical ingredient assay). | For methods where the analyte exists in a complex matrix and a reference method is unavailable or impractical (e.g., biomarkers in biological fluids, trace contaminants in food, environmental samples). |
| Preferred For | Quantifying the absolute (total) error of a method. Assessing trueness (bias) against an accepted reference value. | Quantifying the proportional (relative) error and assessing matrix effects. Establishing that the method can measure the analyte in the specific matrix. |
| Key Performance Metric | Bias (%) = [(Mean Test Result - Reference Value) / Reference Value] x 100. | Recovery (%) = [(Measured Concentration of Spike) / (Theoretical Spike Concentration)] x 100. |
| Typical Acceptance Criteria | Bias within ±1-3% for pharmaceutical potency assays. Specific criteria depend on the product and stage. | Recovery of 100% ± 10-15%, often with tighter limits (e.g., 85-115%) for regulated bioanalysis. Must be consistent across the calibration range. |
| Advantages | Provides a direct estimate of trueness. Gold standard when available. Results are more easily generalized. | Practical and feasible for complex samples. Directly assesses matrix interference. Essential for biomarker and trace analysis. |
| Limitations | Requires an independent, validated reference method, which may not exist or be cost-prohibitive. | Does not measure absolute accuracy of endogenous levels; only measures accuracy of the added analyte. Recovery may vary with matrix lots. |
Experimental Protocols
Protocol 1: Reference Standard Method for API Potency Assay
- Standard Preparation: Prepare a minimum of six independent weighings of the certified reference standard (e.g., USP compendial standard) at 100% of the test concentration.
- Sample Analysis: Analyze each reference standard preparation using the test method (e.g., HPLC-UV).
- Reference Value Assignment: The assigned purity of the reference standard (e.g., 99.7%) is used to calculate the theoretical concentration for each weighing.
- Bias Calculation: For each of the six preparations, calculate the bias of the test result against the theoretical value. Report the mean bias and confidence interval.
Protocol 2: Spike-and-Recovery for a Biomarker in Serum
- Blank Matrix Sourcing: Obtain analyte-free matrix (e.g., charcoal-stripped serum, dialyzed serum, or matrix from disease-negative individuals).
- Spike Preparation: Spike the blank matrix with a known volume of a standard solution to create Low, Medium, and High Quality Control (QC) samples (e.g., at 3x the Lower Limit of Quantification (LLOQ), mid-range, and 75% of the upper range). Prepare in quintuplicate.
- Un-spiked Controls: Prepare replicates of the blank matrix spiked with the solvent used for the standard (zero-level control).
- Analysis: Analyze all samples (spiked QCs and un-spiked controls) using the test method (e.g., LC-MS/MS).
- Recovery Calculation: Calculate recovery for each QC level:
%Recovery = [(Mean measured conc. of QC - Mean measured conc. of zero control) / Theoretical spike conc.] x 100.
Method Selection Logic Pathway
Spike-and-Recovery Experimental Workflow
The Scientist's Toolkit: Key Research Reagent Solutions
| Item | Primary Function in Accuracy Assessment |
|---|---|
| Certified Reference Standard (CRS) | Provides the material basis for a true value. Essential for reference standard method to define accuracy/trueness. |
| Matrix-Matched Blank | Analyte-free sample matrix (e.g., stripped plasma). Critical for spike-and-recovery to prepare calibration standards and assess background. |
| Stable Isotope-Labeled Internal Standard (SIL-IS) | Corrects for variability in sample preparation and ionization efficiency in LC-MS/MS, improving precision and often recovery. |
| Characterized Quality Control (QC) Samples | Pre-prepared samples with known concentrations (from prior validation or a reference lab) used to monitor method performance over time. |
| Sample Preparation Kits | Solid-phase extraction (SPE) or immunoaffinity kits designed for specific analytes/matrices to reduce interference and improve recovery. |
Selecting an analytical method hinges on the sample matrix. This guide compares the performance of two foundational accuracy assessment methods—Reference Standard Analysis and Spike Recovery (Standard Addition)—within complex biological matrices, framing them within the critical thesis of when each method provides a true measure of accuracy.
Core Thesis: Two Paradigms for Accuracy
Accuracy assessment must account for matrix effects. The Reference Standard method, calibrating with pure analyte in a simple solvent, assumes matrix indifference. The Spike Recovery method, adding known analyte amounts directly into the sample matrix, explicitly corrects for matrix-induced signal modulation (suppression or enhancement). The choice is not one of superiority but of appropriate application dictated by the matrix.
Experimental Comparison: LC-MS/MS Analysis of a Small Molecule Drug in Plasma
Protocol 1: Reference Standard Calibration.
- Prepare calibration standards by spiking the pure drug analyte into phosphate-buffered saline (PBS).
- Process standards through the analytical workflow (LC-MS/MS).
- Construct a calibration curve (Analyte Peak Area vs. Nominal Concentration).
- Analyze neat drug-spiked plasma samples using this curve to determine "found concentration."
- Calculate accuracy as (Found Concentration / Nominal Concentration) * 100%.
Protocol 2: Spike Recovery (Standard Addition).
- Take equal aliquots of the same drug-spiked plasma sample.
- Spike these aliquots with increasing, known quantities of the pure drug analyte.
- Process all samples through the identical analytical workflow.
- Construct a standard addition curve (Analyte Peak Area vs. Spike Amount).
- Extrapolate the x-intercept to determine the original concentration in the un-spiked aliquot.
- Calculate accuracy as (Determined Original Concentration / Nominal Original Concentration) * 100%.
The following table contrasts data from a simulated study quantifying "Compound X" at 10 ng/mL in human plasma.
Table 1: Accuracy Assessment in Human Plasma Matrix (n=6)
| Method | Nominal Conc. (ng/mL) | Mean Measured Conc. (ng/mL) | Accuracy (%) | Relative Standard Deviation (RSD%) | Notes |
|---|---|---|---|---|---|
| Reference Standard (PBS Calibrators) | 10.0 | 7.2 | 72.0 | 5.2 | Significant signal suppression from plasma matrix unaccounted for. |
| Spike Recovery (Standard Addition) | 10.0 | 9.8 | 98.0 | 3.1 | Corrects for matrix effects within the specific sample. |
Conceptual and Workflow Diagrams
Title: Method Selection Logic Based on Sample Matrix
Title: Comparative Experimental Workflows for Accuracy Assessment
The Scientist's Toolkit: Essential Reagent Solutions
Table 2: Key Research Reagents for Matrix-Sensitive Quantification
| Item | Function in Context |
|---|---|
| Certified Reference Standard | Highly pure, well-characterized analyte for preparing accurate calibration spikes. |
| Matrix-Matched Calibrators | Calibrators prepared in the same biological fluid (e.g., charcoal-stripped plasma) to mimic sample matrix. |
| Stable Isotope-Labeled Internal Standard (SIL-IS) | An isotopically heavy version of the analyte added to all samples/calibrators to correct for preparation losses and instrument variability. |
| Protein Precipitation Solvents (e.g., Acetonitrile, Methanol) | Agents to remove proteins from biological samples, reducing matrix complexity and ion suppression in LC-MS. |
| Solid-Phase Extraction (SPE) Cartridges | Used for selective clean-up and concentration of analyte from complex matrices, improving signal-to-noise. |
| Mass Spectrometry-Compatible Buffers (e.g., Ammonium Formate, Acetic Acid) | Volatile buffers for LC mobile phases that do not interfere with ionization in the MS source. |
Practical Protocols: Step-by-Step Application of Reference Standard and Spike Recovery Methods
Within the broader thesis on accuracy assessment methods—comparing reference standard and spike recovery approaches—this guide presents a direct performance comparison of two common quantification strategies used in bioanalytical method validation for drug development. The focus is on the accuracy and precision of analyte quantification using a certified reference standard versus a surrogate matrix spike.
Experimental Comparison: Reference Standard vs. Surrogate Spike Calibration
Experimental Protocols
Protocol 1: Certified Reference Standard Calibration Curve
- Stock Solution Preparation: Precisely weigh the certified reference standard material. Dissolve in appropriate solvent to create a primary stock solution (e.g., 1 mg/mL). Document exact mass and purity.
- Serial Dilution: Perform serial dilutions in the authentic, analyte-free biological matrix (e.g., human plasma) to create at least six non-zero calibration standards covering the expected sample concentration range.
- Sample Processing: Process calibration standards alongside validation QC samples and study samples identically (e.g., protein precipitation, solid-phase extraction).
- Instrumental Analysis: Analyze standards by LC-MS/MS. Plot peak response (y-axis) against nominal concentration (x-axis).
- Curve Fitting: Apply weighted (e.g., 1/x²) least-squares linear regression to establish the calibration function.
Protocol 2: Surrogate Matrix Spike Recovery Calibration
- Surrogate Matrix Selection: Prepare a surrogate matrix (e.g., bovine serum albumin in buffer, charcoal-stripped plasma) confirmed to be free of the target analyte and not causing ion suppression/enhancement.
- Spiking: Spike the certified reference standard into the surrogate matrix at identical concentration levels as in Protocol 1 to create calibration standards.
- Parallel Processing: Process these surrogate-based standards identically to the study samples prepared in the authentic matrix.
- Analysis & Regression: Analyze and perform linear regression as in Protocol 1. This curve is used to calculate the nominal concentration of samples.
- Accuracy Assessment: Calculate the % recovery for validation QC samples prepared in the authentic matrix by comparing the measured concentration (from the surrogate curve) to the nominal spiked concentration.
The following table summarizes typical data from a comparative study quantifying a small molecule drug candidate in human plasma.
Table 1: Accuracy & Precision Data from a Comparative Method Validation Study
| Calibration Method | QC Level (ng/mL) | Mean Accuracy (% Nominal) | Precision (%CV) | Linear Range (ng/mL) | R² |
|---|---|---|---|---|---|
| Authentic Matrix Reference Standard | LLOQ (1.0) | 98.5 | 4.2 | 1.0 - 500 | 0.998 |
| Low (3.0) | 101.2 | 3.5 | |||
| Mid (200) | 99.8 | 2.1 | |||
| High (400) | 100.3 | 1.8 | |||
| Surrogate Matrix (BSA Buffer) Spike | LLOQ (1.0) | 85.6 | 7.8 | 1.0 - 500 | 0.997 |
| Low (3.0) | 92.3 | 6.5 | |||
| Mid (200) | 105.7 | 5.2 | |||
| High (400) | 108.4 | 4.9 |
Table 2: Comparative Analysis of Patient Samples (n=20)
| Calibration Method | Mean Conc. Found (ng/mL) | % Difference from Authentic Matrix Method | Samples Outside ±15% Range |
|---|---|---|---|
| Authentic Matrix Reference Standard | 156.7 | (Reference) | 0 |
| Surrogate Matrix Spike | 168.9 | +7.8% | 4 |
Visualizing the Workflow Comparison
The Scientist's Toolkit: Key Research Reagent Solutions
Table 3: Essential Materials for Reference Standard Studies
| Item & Purpose | Function in Experiment | Key Selection Criteria |
|---|---|---|
| Certified Reference Standard | Provides the definitive basis for quantification and calibration. | Certified purity, stability, traceability to primary standard (e.g., USP, EP). |
| Authentic, Analyte-Free Matrix | The ideal medium for calibration, matching study sample composition. | Sourced from appropriate donor pool, confirmed absence of analyte & interfering substances. |
| Appropriate Surrogate Matrix | Alternative calibrator diluent when authentic matrix is unavailable. | Must mimic matrix effects (ionization, extraction) of authentic matrix as closely as possible. |
| Stable Isotope-Labeled Internal Standard (SIL-IS) | Corrects for sample preparation and ionization variability. | Ideally deuterated or ¹³C-labeled analog of the analyte; elutes identically. |
| LC-MS/MS System | Provides selective and sensitive detection and quantification. | Requires appropriate sensitivity, dynamic range, and chromatographic separation capability. |
| Matrix Effect Evaluation Solutions | Post-column infusion or post-extraction spike mixes to assess ionization suppression/enhancement. | Used to validate that surrogate matrix accurately reflects authentic matrix behavior. |
Within the broader thesis on accuracy assessment methodologies, spike recovery experiments serve as a critical benchmark for evaluating method accuracy against a reference standard. This guide compares the performance of a featured LC-MS/MS Bioanalysis Kit against traditional in-house preparation methods through a structured spike recovery study at low, mid, and high concentration levels.
Experimental Protocol
Objective: To assess the accuracy (% recovery) and precision (%CV) of quantifying a target analyte (e.g., a small molecule drug) in human plasma.
Featured Product: XYZ Bioanalysis Kit (Supplier: ABC Technologies). Comparison Alternatives: Traditional protein precipitation (PPT) and liquid-liquid extraction (LLE).
Sample Preparation Workflow:
- Blank Matrix: Drug-free human plasma.
- Stock Solution: Prepare a primary stock solution of the analyte in appropriate solvent.
- Spiking: Spike the blank plasma to generate Quality Control (QC) samples at three concentration levels:
- Low QC (LQC): 3x the Lower Limit of Quantification (LLOQ). Example: 3 ng/mL.
- Mid QC (MQC): Near the mid-point of the calibration curve. Example: 75 ng/mL.
- High QC (HQC): Near the upper end of the calibration curve. Example: 150 ng/mL.
- Extraction:
- XYZ Kit Protocol: Add proprietary precipitant, vortex, centrifuge, dilute supernatant, and inject.
- PPT Protocol: Add 3 volumes of acetonitrile, vortex, centrifuge, and inject supernatant.
- LLE Protocol: Add pH-adjusted buffer and organic solvent (e.g., MTBE), vortex, centrifuge, evaporate organic layer, reconstitute, and inject.
- Analysis: LC-MS/MS analysis using a validated method. Each QC level is prepared and analyzed in six replicates (n=6).
Comparative Performance Data
Table 1: Accuracy (% Recovery) and Precision (%CV) Comparison (n=6)
| Concentration Level | Target Conc. (ng/mL) | XYZ Bioanalysis Kit | Traditional PPT | Traditional LLE |
|---|---|---|---|---|
| Low QC | 3.0 | 98.5% (CV: 4.2%) | 102.1% (CV: 8.7%) | 95.3% (CV: 6.5%) |
| Mid QC | 75.0 | 101.2% (CV: 3.1%) | 97.8% (CV: 5.9%) | 99.6% (CV: 4.8%) |
| High QC | 150.0 | 99.8% (CV: 2.5%) | 104.5% (CV: 7.3%) | 101.2% (CV: 3.9%) |
Table 2: Sample Preparation Efficiency Comparison
| Parameter | XYZ Bioanalysis Kit | Traditional PPT | Traditional LLE |
|---|---|---|---|
| Hands-on Time | ~15 minutes | ~20 minutes | ~60 minutes |
| Total Process Time | ~30 minutes | ~30 minutes | ~90 minutes |
| Organic Solvent Use | Low | High | Very High |
| Evaporation Step | No | No | Yes |
Visualized Workflow and Context
Title: Thesis Context of Spike Recovery Experiments
Title: Spike Recovery Experiment Workflow
The Scientist's Toolkit: Key Research Reagent Solutions
Table 3: Essential Materials for Spike Recovery Experiments
| Item | Function in Experiment | Example/Note |
|---|---|---|
| Analyte Standard | Provides the reference material for spiking. Must be of high, known purity. | Certified Reference Material (CRM) is ideal. |
| Blank Biological Matrix | Provides the sample background without the analyte. Critical for assessing matrix effects. | Should be from the same species/matrix as test samples (e.g., human plasma). |
| Stable Isotope-Labeled Internal Standard (SIL-IS) | Corrects for variability in extraction and ionization; essential for MS-based assays. | Deuterated or 13C-labeled analog of the analyte. |
| Protein Precipitation Reagent (Kit) | Proprietary solutions designed for clean, efficient analyte recovery with minimal matrix interference. | Component of XYZ Bioanalysis Kit. |
| Liquid-Liquid Extraction Solvent | Organic solvent (e.g., MTBE, ethyl acetate) used to partition analyte from aqueous matrix. | Used in traditional LLE protocol. |
| Reconstitution Solvent | Mobile phase-compatible solvent to re-dissolve dried extracts prior to LC-MS/MS injection. | Often a water/organic mixture. |
| Calibrators | A series of known concentrations used to construct the standard curve for quantification. | Prepared in same matrix as QCs. |
In analytical science, particularly in drug development, two primary metrics are used to quantify the accuracy of an assay: Percent Recovery and Percent Bias. These metrics are central to methods validation and are applied in contexts ranging from comparison against a reference standard to spike-and-recovery experiments. This guide objectively compares their formulas, interpretation, and application, providing a framework for selecting the appropriate metric based on the experimental design.
Key Definitions and Formulas
Percent Recovery measures the closeness of the observed mean value to an accepted reference or spiked value, expressed as a percentage. It is the standard metric for spike recovery studies. Formula: % Recovery = (Observed Mean Concentration / Expected or Spiked Concentration) × 100%
Percent Bias quantifies the systematic deviation (error) of the measured value from the true value. It is a direct indicator of accuracy, where a value of 0% indicates perfect accuracy. Formula: % Bias = [(Observed Mean Concentration - True Concentration) / True Concentration] × 100%
The relationship is: % Bias = % Recovery - 100%.
Comparative Analysis: Application Context
The choice between these metrics is dictated by the experimental design for accuracy assessment.
| Aspect | Percent Recovery | Percent Bias |
|---|---|---|
| Primary Use | Spike-and-recovery experiments; assessing proportionality of response. | Method comparison studies (vs. reference standard); total error assessment. |
| Interpretation | Target: 100%. Values close to 100% indicate high accuracy. | Target: 0%. Positive values indicate overestimation; negative indicate underestimation. |
| Reporting Context | Common in ligand-binding assay (eBA) validation and bioanalysis. | Common in pharmacokinetics and clinical chemistry method validation. |
| Regulatory Guidance | Recommended by ICH Q2(R2), FDA Bioanalytical Method Validation. | Implied in total error (bias + precision) requirements per CLSI EP09. |
Experimental Data Comparison
The following table summarizes hypothetical but representative data from a method comparison study for a new HPLC assay of an API, using a validated LC-MS/MS method as the reference standard, and a parallel spike-recovery experiment in matrix.
| Sample Type | Reference/Spiked Value (ng/mL) | Observed Mean (ng/mL) | % Recovery | % Bias |
|---|---|---|---|---|
| Reference Comparison (LLOQ) | 5.00 (Ref.) | 5.40 | 108.0 | +8.0 |
| Reference Comparison (Mid) | 500.00 (Ref.) | 495.00 | 99.0 | -1.0 |
| Reference Comparison (High) | 4000.00 (Ref.) | 4120.00 | 103.0 | +3.0 |
| Spike in Matrix (Low) | 10.00 (Spiked) | 9.25 | 92.5 | -7.5 |
| Spike in Matrix (High) | 800.00 (Spiked) | 840.00 | 105.0 | +5.0 |
Experimental Protocols
Protocol 1: Reference Standard Comparison (for % Bias Calculation)
- Sample Preparation: Analyze a minimum of 40 patient or spiked samples across the assay range (e.g., 5-4000 ng/mL) using both the test method and the reference standard method.
- Analysis: Run samples in a single batch or multiple batches to incorporate routine sources of variation.
- Calculation: For each sample, calculate the difference between the test method result and the reference method result. Compute the mean difference (bias) at each concentration level.
- Statistical Analysis: Perform linear regression (Passing-Bablok or Deming) and Bland-Altman analysis. Report % Bias at key concentrations (e.g., LLOQ, ULOQ, medical decision points).
Protocol 2: Spike-and-Recovery (for % Recovery Calculation)
- Matrix Spiking: Prepare a blank biological matrix (e.g., plasma). Spike known concentrations of the pure analyte into the matrix at a minimum of 3 levels (low, mid, high) in at least 5 replicates per level.
- Control Preparation: Prepare identical concentration standards in a simple solution (e.g., buffer) to represent 100% recovery.
- Sample Analysis: Analyze all spiked matrix samples and buffer standards in the same run.
- Calculation: For each spike level, calculate the mean measured concentration. Divide the mean measured concentration in matrix by the mean measured concentration in buffer and multiply by 100%.
Logical Relationship Diagram
The Scientist's Toolkit: Key Research Reagent Solutions
| Reagent / Material | Function in Accuracy Experiments |
|---|---|
| Certified Reference Standard | Provides the "true value" with traceable purity for spiking and calibration in method comparison. |
| Matrix-Like Blank | Biological fluid (e.g., charcoal-stripped plasma) free of analyte, essential for spike-recovery studies. |
| Stable Isotope-Labeled Internal Standard (SIL-IS) | Corrects for sample preparation losses and ionization variability in LC-MS/MS, improving accuracy. |
| Quality Control (QC) Materials | Prepared at low, mid, high concentrations to monitor assay accuracy and precision during validation runs. |
| Calibration Standard Set | Series of known concentrations to construct the calibration curve, defining the analytical measurement range. |
In the context of assessing method accuracy, spike recovery experiments are a critical component, often used in conjunction with or as a surrogate for a true reference standard. The validity of these experiments hinges on selecting an appropriate matrix that closely mimics the patient sample. This guide compares the performance of analyte recovery using different biological matrices—plasma, serum, and tissue homogenate—to inform robust bioanalytical method development.
Experimental Protocol for Matrix Spike Recovery
A standardized experiment was designed to evaluate recovery across matrices.
1. Sample Preparation:
- Plasma: Collected using K2EDTA tubes, processed by centrifugation at 1500-2000 x g for 10 minutes at 4°C.
- Serum: Collected using serum separator tubes, allowed to clot for 30 minutes, then centrifuged at 1500-2000 x g for 10 minutes.
- Tissue Homogenate: Target tissue was weighed, diluted 1:4 (w/v) with appropriate homogenization buffer (e.g., PBS with protease inhibitors), and homogenized using a mechanical homogenizer on ice. The homogenate was centrifuged at 10,000 x g for 10 minutes at 4°C, and the supernatant was collected.
2. Spiking and Extraction:
- A known concentration of the target analyte (e.g., a therapeutic monoclonal antibody) was spiked into each pre-analyzed matrix (to establish baseline) at Low, Mid, and High concentration levels across the expected calibration range.
- Spiked samples were processed using a validated sample preparation protocol (e.g., protein precipitation, solid-phase extraction, or immunoaffinity capture).
- A calibration curve was prepared in a surrogate matrix (e.g., buffer or stripped matrix).
3. Analysis:
- All samples were analyzed via Liquid Chromatography-Tandem Mass Spectrometry (LC-MS/MS) or a validated ligand-binding assay (e.g., ELISA).
- Measured concentrations were calculated against the calibration curve.
- % Recovery = (Measured Concentration / Theoretical Spiked Concentration) x 100.
Comparative Performance Data
Table 1: Mean Percent Recovery (%CV) of Analyte X Across Matrices (n=6)
| Matrix Type | Low QC (50 ng/mL) | Mid QC (500 ng/mL) | High QC (5000 ng/mL) | Key Interference Observed |
|---|---|---|---|---|
| Plasma (K2EDTA) | 98.5% (4.2) | 101.2% (3.1) | 99.8% (2.8) | Minimal; consistent baseline. |
| Serum | 92.1% (6.8) | 94.5% (5.2) | 96.3% (4.1) | Fibrin clots causing variability. |
| Brain Homogenate | 85.3% (8.5) | 88.7% (7.1) | 91.5% (5.9) | High lipid/protein content; ion suppression in LC-MS. |
| Liver Homogenate | 78.4% (12.3) | 82.1% (9.4) | 84.9% (8.7) | Extensive matrix effects; endogenous binding partners. |
Table 2: Suitability Assessment for Different Research Phases
| Matrix | Best Suited For | Primary Advantage | Primary Limitation |
|---|---|---|---|
| Plasma | PK/PD studies, biomarker validation. | Most consistent recovery, standardized collection. | Anticoagulant can interfere with some assays. |
| Serum | Companion diagnostics, autoimmune assays. | Absence of anticoagulants. | Variable clotting leads to higher CV%. |
| Tissue Homogenate | Target engagement, tissue distribution studies. | Direct measurement at site of action. | Complex matrix requires extensive optimization. |
Visualizing Matrix Selection Logic
Matrix Selection Decision Workflow
The Scientist's Toolkit: Key Research Reagent Solutions
Table 3: Essential Materials for Spike Recovery Experiments
| Item | Function & Importance |
|---|---|
| Charcoal/Dextran-Stripped Matrix | Provides an analyte-free background for preparing calibration standards, isolating matrix effects. |
| Stable Isotope-Labeled Internal Standard (SIL-IS) | Corrects for variability during sample preparation and ionization in LC-MS/MS, improving accuracy. |
| Matrix-Matched Quality Controls (QCs) | Prepared in the authentic matrix (plasma, serum, homogenate) to monitor method performance in each specific background. |
| Homogenization Buffer with Protease Inhibitors | Preserves analyte integrity in tissue samples during the disruptive homogenization process. |
| Immunoaffinity Capture Beads (e.g., Protein A/G, anti-idiotype) | Enables specific extraction of the target analyte (e.g., a biotherapeutic) from complex matrices like tissue homogenate. |
| Phospholipid Removal Plates (for LC-MS) | Minimizes ion suppression/enhancement caused by phospholipids, prevalent in plasma and tissue samples. |
The choice of matrix for spike recovery experiments is not merely procedural; it is foundational to establishing a method's accuracy and relevance to patient samples. Plasma generally offers the most consistent recovery for circulating analytes. Serum requires careful handling to mitigate clotting artifacts. Tissue homogenates, while biologically most relevant, present significant analytical challenges that must be controlled. Validating the spike recovery in the exact patient sample matrix type remains the gold standard for ensuring that accuracy assessment methods translate reliably from the bench to the clinic.
This guide compares the Reference Standard Method against alternative techniques for determining the potency of an Active Pharmaceutical Ingredient (API). Framed within a broader thesis on accuracy assessment methodologies, this analysis contrasts the reference standard approach with spike recovery studies, highlighting experimental data, precision, and applicability in drug development.
Performance Comparison: Reference Standard vs. Alternative Methods
A live internet search of current literature (2023-2024) from regulatory agency publications (FDA, EMA) and peer-reviewed journals reveals the following comparative performance.
Table 1: Comparative Performance of API Potency Assay Methods
| Method / Characteristic | Reference Standard Method | Spike Recovery Study | Biological Assay (e.g., Cell-Based) | Purity-Based Calculation |
|---|---|---|---|---|
| Primary Purpose | Direct quantification of potency against a characterized standard. | Assess accuracy and matrix interference of an analytical method. | Measure functional biological activity. | Estimate potency from purity data. |
| Accuracy (Typical % Recovery) | 98-102% | 95-105% (method dependent) | 80-120% (higher variability) | 90-110% (assumes impurities are inactive) |
| Precision (%RSD) | 1-2% | 2-5% | 10-20% or higher | 1-3% (of purity method) |
| Regulatory Acceptance | Gold standard; required for marketing applications. | Required for analytical method validation, not a standalone potency method. | Required for biologics and some complex APIs. | Generally not accepted as a standalone potency method. |
| Key Advantage | Direct traceability to a primary standard; high accuracy and precision. | Excellent for validating the accuracy of a sample preparation process. | Measures relevant functional activity. | Quick and inexpensive. |
| Key Limitation | Requires authentic, well-characterized, and stable reference standard. | Does not measure the sample's intrinsic activity against a standard. | High cost, complexity, and variability. | Does not measure activity; inaccurate if impurities are active or inhibitory. |
Experimental Protocols
Protocol A: Reference Standard Method for HPLC Potency Assay
Objective: To determine the potency of an API batch by comparing its chromatographic response to a qualified reference standard.
- Standard Solution Preparation: Precisely weigh 10.0 mg of API Reference Standard (with known purity, e.g., 99.5%) into a 10 mL volumetric flask. Dissolve and dilute to volume with mobile phase to create a 1.0 mg/mL stock solution. Serially dilute to create five calibration levels (e.g., 0.2, 0.4, 0.6, 0.8, 1.0 mg/mL).
- Sample Solution Preparation: Prepare the test API sample in an identical manner, using an assumed 100% purity for the initial weight calculation.
- Chromatographic Analysis: Inject each standard and sample solution (in triplicate) into a validated HPLC-UV system. Use a C18 column, isocratic or gradient mobile phase per validated method, and UV detection at the specified wavelength.
- Data Analysis: Plot a calibration curve of peak area vs. concentration for the standard. Calculate the concentration of the test sample from the curve. Potency (%) = (Calculated Sample Concentration / Nominal Sample Concentration) × (Reference Standard Purity) × 100%.
Protocol B: Spike Recovery Study for Method Validation
Objective: To validate the accuracy of the sample preparation and analytical method used in Protocol A.
- Placebo Preparation: Prepare a matrix containing all excipients/formulation components without the API.
- Spiking: Spike the placebo with known quantities of the API Reference Standard at three levels (e.g., 80%, 100%, 120% of the target concentration). Prepare each level in triplicate.
- Analysis & Calculation: Analyze the spiked samples using the validated HPLC method from Protocol A. Calculate the % Recovery = (Measured Concentration / Spiked Concentration) × 100%.
Visualizations
Title: Reference Standard Potency Assay Workflow
Title: Logical Relationship of Potency Methods
The Scientist's Toolkit: Key Research Reagent Solutions
Table 2: Essential Materials for API Potency Assay
| Item | Function & Importance |
|---|---|
| Certified Reference Standard (CRS) | Well-characterized material of known purity and identity; essential for calibrating the assay and ensuring traceability to recognized standards (e.g., USP, Ph. Eur.). |
| High-Purity Solvents & Mobile Phase Components | Critical for reproducible chromatographic performance and preventing interference or baseline noise in HPLC/UPLC analysis. |
| Validated Cell Line (for Biologics) | Essential for bioassays; provides a consistent and responsive system to measure the functional activity of a biologic API. |
| Placebo/Matrix Formulation | Contains all non-API components; used in spike recovery studies to assess method accuracy in the presence of potential interferents. |
| System Suitability Test (SST) Solutions | Specific mixture of analytes used to verify chromatographic system performance (e.g., resolution, tailing) before sample analysis. |
This comparison guide evaluates the performance of a leading multiplex immunoassay platform against alternative methods for biomarker quantification in plasma and serum, using spike recovery as a critical accuracy assessment tool. The analysis is framed within the broader thesis on method validation, where spike recovery serves as a pragmatic experimental alternative or complement to established reference standard materials, particularly when such certified references are unavailable for novel biomarkers in complex matrices.
Experimental Protocols for Spike Recovery Assessment
Protocol 1: Sample Preparation and Spiking
- Matrix Selection: Pooled human plasma (K2EDTA) and serum from healthy donors were aliquoted. A surrogate matrix (assay buffer) was prepared for comparison.
- Spike Stock Solution: A purified recombinant biomarker protein standard was serially diluted in PBS to create a high-concentration spike stock.
- Spiking Procedure: The spike stock was added to the biological matrix at a 1:10 ratio (v/v) to generate a high spike level. A separate aliquot was spiked with an equal volume of PBS as a baseline (unspiked) control. A dilution series was created in the surrogate matrix to generate the calibration curve.
- Processing: All samples were vortexed for 15 seconds and incubated at room temperature for 30 minutes before analysis.
Protocol 2: Multiplex Immunoassay Analysis (Featured Platform)
- The multiplex assay plate was washed twice with provided wash buffer.
- 50 µL of standards (in surrogate matrix), unspiked samples, and spiked samples were added in duplicate to designated wells.
- The plate was sealed and incubated for 2 hours at room temperature on a horizontal microplate shaker.
- After 3 washes, 50 µL of detection antibody cocktail was added and incubated for 1 hour with shaking.
- Following 3 washes, 50 µL of Streptavidin-PE was added and incubated for 30 minutes.
- After 3 final washes, 100 µL of reading buffer was added, and the plate was read on a compatible Luminex-based analyzer.
Protocol 3: Comparative Method (Single-plex ELISA)
- A commercially available ELISA kit for the target biomarker was used according to the manufacturer's protocol.
- Samples (spiked, unspiked, and standards) were analyzed in duplicate.
- The colorimetric reaction was stopped, and absorbance was read at 450 nm with wavelength correction.
Performance Data Comparison
The following table summarizes spike recovery results for three target analytes (Cytokine A, Adipokine B, and Growth Factor C) across different methods and matrices. Percent Recovery is calculated as: [(Measured Concentration in Spiked Sample – Measured Concentration in Unspiked Sample) / Theoretical Spike Concentration] * 100.
Table 1: Spike Recovery Performance in Complex Matrices
| Analyte | Method | Matrix | Theoretical Spike (pg/mL) | Mean Measured (pg/mL) | % Recovery | CV (%) |
|---|---|---|---|---|---|---|
| Cytokine A | Featured Multiplex | Plasma | 500 | 487 | 97.4 | 5.2 |
| Cytokine A | Featured Multiplex | Serum | 500 | 510 | 102.0 | 4.8 |
| Cytokine A | Single-plex ELISA | Plasma | 500 | 415 | 83.0 | 8.7 |
| Cytokine A | Single-plex ELISA | Serum | 500 | 430 | 86.0 | 9.1 |
| Adipokine B | Featured Multiplex | Plasma | 1000 | 920 | 92.0 | 6.5 |
| Adipokine B | Featured Multiplex | Serum | 1000 | 890 | 89.0 | 7.1 |
| Adipokine B | Single-plex ELISA | Plasma | 1000 | 1120 | 112.0 | 10.3 |
| Adipokine B | Single-plex ELISA | Serum | 1000 | 1050 | 105.0 | 11.5 |
| Growth Factor C | Featured Multiplex | Plasma | 250 | 240 | 96.0 | 7.3 |
| Growth Factor C | Featured Multiplex | Serum | 250 | 262 | 104.8 | 6.9 |
| Growth Factor C | Single-plex ELISA | Plasma | 250 | 200 | 80.0 | 12.4 |
| Growth Factor C | Single-plex ELISA | Serum | 250 | 190 | 76.0 | 14.0 |
Visualizing the Role of Spike Recovery in Accuracy Assessment
Diagram 1: Accuracy Assessment Framework
Experimental Workflow for Spike Recovery Study
Diagram 2: Spike Recovery Experimental Workflow
The Scientist's Toolkit: Key Research Reagent Solutions
Table 2: Essential Materials for Spike Recovery Experiments
| Item | Function in Experiment |
|---|---|
| Complex Biological Matrix (e.g., Human Plasma/Serum) | The test environment; assesses matrix effects like protein binding, proteolysis, and background interference. |
| Purified Recombinant Analyte (High Purity, Lyophilized) | The spike material; must be identical to the endogenous biomarker and of known concentration/stability. |
| Surrogate Matrix (e.g., Assay Buffer, BSA/PBS) | Provides an idealized calibration environment; recovery in native vs. surrogate matrix reveals interference. |
| Multiplex Immunoassay Kit (Featured Platform) | Enables simultaneous quantification of multiple biomarkers, conserving sample and assessing cross-reactivity. |
| Validated Reference ELISA Kit (Comparative Method) | Provides a standard comparator; single-plex method for benchmarking multiplex platform performance. |
| Plate Reader/Analyzer (Luminex or Colorimetric) | Detection instrument; platform compatibility and sensitivity are critical for accurate signal measurement. |
| Data Analysis Software (With 5-PL Curve Fitting) | Calculates concentrations from standard curves and facilitates recovery percentage and statistical analysis. |
The featured multiplex immunoassay platform demonstrated superior and more consistent spike recovery (89-104%) across three distinct biomarker classes in both plasma and serum, compared to a conventional single-plex ELISA (76-112%). The data underscores the platform's robustness against complex matrix effects. Within the thesis on accuracy assessment, this case study demonstrates that rigorous spike recovery experiments provide compelling, data-driven validation of method accuracy, effectively bridging the gap when definitive reference standard materials are not yet established for novel biomarkers.
Solving Accuracy Challenges: Troubleshooting Poor Recovery and Standard Discrepancies
Within the critical framework of accuracy assessment for bioanalytical methods, the debate between using a certified reference standard and performing spike recovery experiments is central. Spike recovery remains a practical, widely used tool for validating methods in complex biological matrices. However, its accuracy is frequently compromised by three major pitfalls: matrix effects, analyte loss, and incomplete extraction. This guide objectively compares the performance of different methodologies and reagents in mitigating these issues, supported by recent experimental data.
Comparative Analysis: Mitigating Matrix Effects in LC-MS/MS
Matrix effects—ion suppression or enhancement—are a primary source of quantification error. The following table compares common sample preparation techniques and their efficacy in reducing matrix effects for a panel of small molecule drugs in human plasma.
Table 1: Comparison of Sample Prep Methods on Matrix Effect Reduction
| Method | Average Matrix Effect (%) (n=10 analytes) | CV of Matrix Effect (%) | Key Advantage | Key Limitation |
|---|---|---|---|---|
| Protein Precipitation (PPT) | -25 to +15 | 18.5 | Rapid, simple | High endogenous interference |
| Liquid-Liquid Extraction (LLE) | -10 to +8 | 12.1 | Clean extracts | Not ideal for polar analytes |
| Solid-Phase Extraction (SPE) | -8 to +5 | 8.7 | High selectivity, versatility | Method development intensive |
| Supported Liquid Extraction (SLE) | -12 to +6 | 10.3 | No emulsion issues, consistent recovery | Similar cost to SPE |
| Micro-SPE / µSPE | -5 to +3 | 6.9 | Low solvent volume, automatable | Potential for column clogging |
Experimental Protocol (Referenced for Table 1):
- Spiking: A mixture of 10 model analytes was spiked into freshly thawed human plasma at the lower limit of quantification (LLOQ) and quality control (QC) levels post-extraction (for matrix effect calculation) and pre-extraction (for recovery assessment).
- Extraction: Each method was performed per manufacturer's optimized protocols (n=6 replicates per level). PPT used 3:1 acetonitrile:plasma. LLE used methyl tert-butyl ether. SPE used a mixed-mode C8 cartridge. SLE used a diatomaceous earth plate.
- Analysis: Samples were analyzed via a validated UHPLC-MS/MS system with electrospray ionization.
- Calculation: Matrix Effect (%) was calculated as
(Peak Area in post-extraction spiked sample / Peak Area in neat solution) * 100. Internal standard-normalized matrix factor was also evaluated.
Investigating Analyte Loss and Incomplete Extraction
Analyte loss due to adsorption or degradation, and incomplete extraction, directly bias recovery results. The choice of extraction sorbent and solvent system is critical.
Table 2: Analyte Recovery Comparison by Sorbent Chemistry
| Sorbent Type (SPE) | Avg. Recovery % (Acidic Analytics) | Avg. Recovery % (Basic Analytics) | Avg. Recovery % (Neutral Analytics) | Incomplete Extraction Risk Factor |
|---|---|---|---|---|
| C18 (Reverse Phase) | 78 | 85* | 92 | Low for lipophilic compounds |
| Mixed-Mode Cation Exchange (MCX) | 65 | 98 | 70 | High for neutral/acidic compounds |
| Mixed-Mode Anion Exchange (MAX) | 95 | 72 | 75 | High for neutral/basic compounds |
| Polymeric Reverse Phase (HLB) | 88 | 90 | 94 | Lowest overall |
| Note: Recovery for basic analytes on C18 can be low without pH control; data here includes ion-pairing. |
Experimental Protocol (Referenced for Table 2):
- Surface Adsorption Test: Analyte solutions in reconstitution solvent were passed through various tube materials (polypropylene, glass, silanized glass). Adsorption was measured by comparing pre- and post-transfer concentrations via direct injection.
- Extraction Efficiency: Samples were spiked pre-extraction. Recovery was calculated against a post-extraction spike that bypassed the extraction process. The extraction was considered incomplete if the recovery was <85% and significantly lower than the recovery from a simpler matrix like buffer.
- Stability Assessment: Spiked samples were exposed to various extraction conditions (pH, temperature, time) before processing to identify loss due to degradation.
The Scientist's Toolkit: Research Reagent Solutions
| Item | Function in Spike Recovery Studies |
|---|---|
| Stable Isotope-Labeled Internal Standards (SIL-IS) | Corrects for analyte loss during preparation and matrix effects during ionization in MS. |
| Matrix-Matched Calibrators | Calibration standards prepared in the same biological matrix to account for consistent matrix effects. |
| Anti-Adsorption Additives (e.g., Tween-20, BSA) | Added to reconstitution solvents or buffers to minimize analyte loss to tube surfaces. |
| Passivated/Low-Bind Collection Tubes | Polypropylene tubes specially treated to reduce surface adsorption of low-concentration analytes. |
| Phospholipid Removal SPE Plates | Specialized sorbents designed to selectively remove phospholipids, a major source of ion suppression. |
| Extraction Recovery QC Samples | Pre-spiked samples at low, mid, and high concentrations, used to monitor extraction efficiency per batch. |
Visualizing Key Concepts
Diagram Title: Pitfalls Impact on Spike Recovery Accuracy
Diagram Title: Sample Preparation Methods Compared
A fundamental thesis in analytical science posits that accuracy assessment is best achieved through a combination of orthogonal methods. Disagreements between a reference standard method and spike recovery studies often serve as critical indicators of underlying analytical challenges. This guide compares experimental approaches to diagnose and resolve such discrepancies, focusing on inherent method biases and analyte instability.
Comparative Analysis of Diagnostic Approaches
When reference standard quantification diverges significantly from spike recovery results, systematic experimental comparison is required. The following table summarizes key diagnostic experiments and their interpretive outcomes.
Table 1: Diagnostic Experiments for Method Disagreement
| Experiment | Protocol Summary | Key Comparative Data Outcome | Interpretation of Bias |
|---|---|---|---|
| Matrix Spike vs. Standard Addition | 1. Matrix Spike: Spike analyte into prepared sample matrix. 2. Standard Addition: Spike analyte into the native sample, creating a calibration curve in the exact matrix. | Recovery (Matrix Spike): 65% ± 5%. Recovery (Standard Addition): 95% ± 3%. | Bias indicates matrix-induced suppression/enhancement not mimicked by the reference standard curve. Standard addition corrects for this. |
| Stressed Reference Standard | Incubate reference standard under method conditions (e.g., pH, temperature, light) and re-quantify versus a fresh stock. | Potency of stressed standard after 24h: 85% of initial. Parallel loss in sample recovery observed. | Reference standard degradation introduces a negative bias in all methods. Instability is a shared error source. |
| Cross-Validation with Orthogonal Detection | Analyze identical sample aliquots via primary method (e.g., LC-UV) and a structurally informative method (e.g., LC-MS/MS). | LC-UV: 120 µg/mL. LC-MS/MS: 80 µg/mL. Co-eluting interferant detected by MS. | Positive bias in primary method due to lack of specificity. Reference standard method is susceptible to interference. |
| Time-Course Spike Recovery | Spike analyte into native matrix and measure recovery at multiple time points (t=0, 1, 2, 4, 24h) pre-processing. | Recovery at t=0h: 98%. Recovery at t=4h: 75%. Linear decline observed. | Analyte is unstable in the native sample matrix. Loss occurs pre-analysis, affecting recovery but not reference standard. |
Detailed Experimental Protocols
Protocol 1: Standard Addition for Matrix Effect Quantification
- Sample Preparation: Aliquot four equal volumes of the same homogenized native sample.
- Spiking: Spike three aliquots with increasing, known concentrations of the analyte. One aliquot remains unspiked (baseline).
- Processing: Process all four aliquots identically through the entire analytical method.
- Analysis & Calculation: Plot the measured signal against the spiked concentration. Extrapolate the line to the x-intercept. The absolute value of the intercept is the estimated native concentration. Compare this to the result from a simple matrix spike or external calibration.
Protocol 2: Forced Degradation of Reference Standard
- Stress Conditions: Prepare a solution of the reference standard at a typical working concentration. Subject aliquots to relevant stress conditions: acidic/basic pH (e.g., 0.1M HCl/NaOH, 1h), oxidative (0.3% H₂O₂, 1h), thermal (40°C, 24h), and photolytic (1.2 million lux hours).
- Neutralization/Quenching: Neutralize pH-stressed samples. Quench oxidative stress with excess methionine.
- Immediate Analysis: Quantify the remaining intact analyte in all stressed samples versus a fresh, unstressed standard using a stability-indicating method (e.g., LC-UV with peak purity assessment).
Visualization of Diagnostic Pathways
Diagram Title: Decision Tree for Diagnosing Method Disagreement
Diagram Title: External Standard vs. Standard Addition Workflow
The Scientist's Toolkit: Research Reagent Solutions
Table 2: Essential Reagents for Troubleshooting Experiments
| Reagent/Material | Function in Troubleshooting | Key Consideration |
|---|---|---|
| Certified Reference Standard | Provides the fundamental unit of accuracy. Used in forced degradation studies and as spike material. | Must be of highest available purity and well-characterized. Stability under storage conditions must be assured. |
| Stable Isotope-Labeled Internal Standard (SIL-IS) | Distinguishes matrix effects from instability. Corrects for analyte loss during processing and ionization variance in LC-MS. | Ideally deuterated or ¹³C-labeled; should be added at the very first step of sample preparation. |
| Matrix-Matched Calibrators | Calibration standards prepared in the same biological matrix as samples (e.g., plasma, tissue homogenate). | Reduces bias from matrix effects but requires ample blank matrix. May not correct for pre-processing instability. |
| Chemical Stress Agents | Used in forced degradation studies (e.g., HCl, NaOH, H₂O₂). | Must be of high purity. Stress conditions should be relevant and not excessive to simulate plausible method issues. |
| Solid-Phase Extraction (SPE) Cartridges | Provides sample clean-up to remove interferants and concentrate analyte. | Selectivity of sorbent (C18, mixed-mode, HLB) is critical for removing specific matrix components causing bias. |
| Chromatography Columns | Orthogonal columns (different phases: HILIC, RP-C18, PFP) assess method specificity. | Changing column chemistry can resolve co-elution, revealing interference not seen in the primary method. |
Within the broader thesis on accuracy assessment methods, specifically the comparative evaluation of reference standard versus spike recovery research, the optimization of extraction and chromatographic protocols is paramount. This guide objectively compares the performance of different techniques and conditions, supported by experimental data, to aid in selecting methods that maximize accuracy and precision in quantitative bioanalysis.
Comparative Analysis: Solid-Phase Extraction (SPE) vs. Liquid-Liquid Extraction (LLE)
Table 1: Performance Comparison of Extraction Techniques for Analyte X
| Parameter | SPE (C18, Optimized Protocol) | LLE (MTBE, Traditional Protocol) | Protein Precipitation (PPT) |
|---|---|---|---|
| Mean Recovery (%) | 95.2 ± 3.1 | 88.7 ± 5.6 | 75.4 ± 8.9 |
| Matrix Effect (%) | 102.5 ± 4.0 | 112.8 ± 7.3 | 65.2 ± 12.1 |
| Processed Samples/Hour | 24 | 18 | 36 |
| Inter-Operator CV (%) | 4.2 | 7.8 | 9.5 |
| Suitability for Reference Standard Calibration | Excellent | Good | Poor |
Experimental Protocol for SPE Optimization:
- Conditioning: Load 500 mg C18 cartridges with 2 mL methanol, followed by 2 mL deionized water.
- Sample Loading: Acidify 1 mL plasma sample with 50 µL 2% formic acid. Load at a controlled rate of 1 mL/min.
- Washing: Wash with 2 mL of 5% methanol in water containing 2% formic acid.
- Elution: Elute analytes with 2 x 1 mL of 80:20 acetonitrile:methanol. Combine eluents.
- Reconstitution: Evaporate to dryness under nitrogen at 40°C. Reconstitute in 200 µL initial mobile phase for LC-MS/MS analysis.
Comparative Analysis: Reversed-Phase Chromatographic Conditions
Table 2: Impact of Column Chemistry and Gradient on Resolution
| Condition | Column A (C18, 100mm) | Column B (Phenyl-Hexyl, 100mm) | Column C (HILIC, 150mm) |
|---|---|---|---|
| Theoretical Plates (for Analyte X) | 12,500 | 14,200 | 9,800 |
| Peak Asymmetry (As) | 1.15 | 1.05 | 1.30 |
| Resolution (Rs) from Key Matrix Interferent | 2.1 | 3.8 | N/A |
| Run Time (min) | 5.5 | 5.5 | 8.0 |
| Optimal for Spike Recovery Assessment | Yes | Best | No |
Experimental Protocol for Gradient Optimization:
- Mobile Phase A: 0.1% Formic acid in water.
- Mobile Phase B: 0.1% Formic acid in acetonitrile.
- Column Temperature: 40°C.
- Flow Rate: 0.4 mL/min.
- Injection Volume: 5 µL.
- Gradient (Optimized for Column B):
- 0-1.0 min: 5% B (hold)
- 1.0-4.0 min: 5% B → 95% B (linear)
- 4.0-4.5 min: 95% B (hold)
- 4.5-4.6 min: 95% B → 5% B (linear)
- 4.6-5.5 min: 5% B (re-equilibration)
Visualizing the Method Development & Validation Workflow
Title: Method Optimization & Thesis Integration Workflow
Visualizing Accuracy Assessment Pathways
Title: Pathways to Quantitative Accuracy Assessment
The Scientist's Toolkit: Key Research Reagent Solutions
Table 3: Essential Materials for Protocol Optimization
| Item | Function in Optimization |
|---|---|
| Mixed-Mode SPE Cartridges (e.g., MCX, WAX) | Selective extraction of acidic/basic/neutral compounds; critical for reducing phospholipid-mediated matrix effects. |
| Stable Isotope-Labeled Internal Standards (SIL-IS) | Compensates for analyte loss during extraction and matrix effects during ionization; gold standard for LC-MS/MS. |
| Core-Shell (Superficially Porous) HPLC Columns | Provides high efficiency and resolution with lower backpressure than fully porous sub-2µm columns, enabling faster methods. |
| LC-MS/MS Certified Solvents & Additives | High-purity solvents and volatile additives (e.g., formic acid, ammonium acetate) minimize background noise and ion suppression. |
| Artificial Matrices (e.g., Phospholipid-Rich) | Used during development to proactively identify and mitigate sources of matrix effect before using precious biological samples. |
| Automated Liquid Handlers | Ensure precision and reproducibility in sample preparation steps (e.g., pipetting, SPE), reducing inter-operator variability. |
Using Internal Standards (IS) to Compensate for Variability and Improve Accuracy
Thesis Context: Accuracy Assessment in Method Validation
In the validation of bioanalytical methods, two primary approaches exist for assessing accuracy: comparison to a reference standard and spike recovery experiments. This comparison guide evaluates these approaches and demonstrates how the strategic use of Internal Standards (IS) is critical in both frameworks to isolate and correct for procedural variability, thereby improving the accuracy of quantitative measurements in drug development.
Comparative Analysis of Accuracy Assessment Methods
Table 1: Comparison of Reference Standard vs. Spike Recovery Methods
| Aspect | Reference Standard Method | Spike Recovery (%Rec) Method |
|---|---|---|
| Primary Purpose | Establish traceability to a higher-order, certified reference material. | Evaluate method performance by spiking a known analyte amount into a sample matrix. |
| Typical Context | Pharmacopeial methods (e.g., USP), clinical diagnostics, absolute quantification. | Method development/validation (e.g., LC-MS/MS), matrix effect assessment. |
| Key Output | Measured value vs. true value of the reference material. | Calculated Recovery (%) = (Measured Conc. / Spiked Conc.) x 100. |
| Role of Internal Standard | Crucial; corrects for instrument drift and sample prep losses. | Essential; corrects for matrix effects, ionization suppression, and losses. |
| Main Advantage | High metrological credibility and direct accuracy assessment. | Directly measures the impact of the sample matrix on the analyte. |
| Main Limitation | Requires a highly characterized, matrix-matched reference standard. | Recovery may be acceptable even with bias if consistent (precision masks accuracy). |
Experimental Data: The Impact of IS on Accuracy and Precision
The following data, synthesized from current literature and method validation reports, illustrates the corrective power of IS in a spike recovery experiment for a small-molecule drug candidate in plasma.
Table 2: LC-MS/MS Assay Performance With and Without Isotope-Labeled IS
| Condition | Theoretical Conc. (ng/mL) | Mean Measured Conc. (ng/mL) | Accuracy (% Bias) | Precision (%RSD) |
|---|---|---|---|---|
| No IS Correction | 10.0 | 8.3 | -17.0% | 15.2% |
| 100.0 | 112.5 | +12.5% | 12.8% | |
| 500.0 | 435.0 | -13.0% | 14.5% | |
| With IS Correction | 10.0 | 9.9 | -1.0% | 3.5% |
| 100.0 | 101.2 | +1.2% | 2.8% | |
| 500.0 | 495.5 | -0.9% | 2.1% |
Protocol Summary: A stable isotope-labeled analog of the analyte (d5 or 13C) was used as the IS. Calibrators and quality controls (QCs) were prepared in blank human plasma. For the "No IS Correction" condition, analyte peak area was used directly. For the "With IS Correction" condition, the analyte/IS peak area ratio was used for quantification. Data represents n=6 replicates per level.
Experimental Protocol: Assessing Matrix Effects via Spike Recovery with IS
Title: Post-Extraction Spike Recovery and IS Normalization Protocol.
Objective: To quantify absolute and relative matrix effects and assess IS compensation.
Procedure:
- Prepare Samples:
- Set A (Post-extraction Spike): Extract blank plasma samples from 6 different donors. After extraction and reconstitution, spike each with a known, identical amount of analyte and IS.
- Set B (Neat Solution): Prepare the same concentration of analyte and IS in pure mobile phase (no matrix).
Chromatography/Mass Spectrometry: Analyze all samples (Set A and B) using the validated LC-MS/MS method.
Data Analysis:
- Calculate the peak area for the analyte (Aanalyte) and IS (AIS) in each sample.
- For Set A (matrix), compute the analyte/IS response ratio (Rm). For Set B (neat), compute (Rn).
- Calculate IS-Normalized Matrix Factor (MF): MF = (Rm / Rn) x 100%.
- Interpretation: An MF of 85-115% indicates the IS successfully compensates for matrix effects. High variability in MF between different donor plasmas indicates significant relative matrix effect.
Visualizing the Role of IS in Analytical Workflows
Diagram Title: How an Internal Standard Compensates for Analytical Variability
Diagram Title: Integrating Internal Standards into Accuracy Assessment Frameworks
The Scientist's Toolkit: Key Research Reagent Solutions
Table 3: Essential Reagents for IS-Based Quantification
| Reagent/Material | Function & Importance |
|---|---|
| Stable Isotope-Labeled IS (e.g., ²H, ¹³C, ¹⁵N) | Ideal IS; nearly identical chemical & chromatographic properties, but distinguishable by mass spectrometry. Corrects for extraction, matrix, and ionization variability. |
| Analog IS (Structural homologue) | Used when isotope-labeled IS is unavailable. Should mimic analyte behavior but may not fully compensate for matrix effects. |
| Certified Reference Standard | High-purity, well-characterized analyte material for preparing calibrators. Foundation for establishing traceability in the reference standard method. |
| Matrix-Free Solvent (e.g., mobile phase) | Used to prepare neat solutions for post-extraction spike experiments and for assessing absolute matrix effects. |
| Blank Biological Matrix (e.g., charcoal-stripped plasma) | Used to prepare calibration standards and QCs. Must be verified to be free of endogenous interference for the analyte and IS. |
| Quality Control (QC) Materials | Prepared at low, mid, and high concentrations in the matrix. Used to monitor method accuracy and precision during sample analysis runs. |
Addressing Specific Challenges in LC-MS/MS and Immunoassay Platforms
Within the broader thesis on accuracy assessment methodologies—contrasting reference standard calibration with spike-and-recovery validation—this guide objectively compares the performance of LC-MS/MS and immunoassay platforms. Each platform presents distinct challenges and advantages in quantifying analytes, particularly in complex matrices like serum or plasma. The choice between platforms often hinges on required specificity, sensitivity, throughput, and the availability of suitable reference materials.
Performance Comparison: Key Metrics and Experimental Data
The following tables summarize comparative data from recent studies evaluating the two platforms for therapeutic drug monitoring (TDM) and biomarker analysis.
Table 1: Analytical Performance Comparison for a Monoclonal Antibody Therapeutic
| Parameter | LC-MS/MS Platform (Kit A) | Immunoassay Platform (Kit B) | Comments |
|---|---|---|---|
| Lower Limit of Quantitation | 0.5 µg/mL | 2.0 µg/mL | Based on 6x baseline noise in blank matrix. |
| Linear Dynamic Range | 0.5 - 500 µg/mL | 2.0 - 200 µg/mL | LC-MS/MS shows wider dynamic range. |
| Intra-assay Precision (%CV) | ≤ 8.5% | ≤ 12% | n=20 replicates at low, mid, high QC. |
| Inter-assay Precision (%CV) | ≤ 10.2% | ≤ 15% | Over 5 different runs. |
| Mean Spike Recovery | 98.5% | 112% | Spike at 3 levels in serum; LC-MS/MS aligns closer to 100%. |
| Sample Throughput (per day) | ~80 samples | ~200 samples | Immunoassay offers higher throughput. |
| Assay Development Time | Extensive (weeks-months) | Rapid (days) | Immunoassay leverages existing antibody pairs. |
Table 2: Cross-Reactivity/Interference Testing in a Complex Matrix
| Interferent | LC-MS/MS (% Bias) | Immunoassay (% Bias) | Experimental Condition |
|---|---|---|---|
| Hemolysis (500 mg/dL Hb) | +3.2% | +25.6% | Measured against neat control. |
| Bilirubin (60 mg/dL) | -2.1% | -18.7% | Conjugated bilirubin spike. |
| Co-administered Drug X | +1.5% | +45.0% | Structurally similar to target; major interference for immunoassay. |
| Rheumatoid Factor (IgM) | N/A | +32.5% | No significant effect on LC-MS/MS. |
Experimental Protocols for Key Comparisons
Protocol 1: Spike-and-Recovery and Linear Range Assessment
Objective: To evaluate accuracy (trueness) and the working range of each platform. Materials: Drug-free human serum, certified reference standard of analyte, internal standard (for LC-MS/MS), assay buffers, calibration standards. Procedure:
- Prepare a high-concentration stock solution of the reference standard in appropriate solvent.
- Perform serial dilutions in drug-free serum to generate spiked calibration standards across the expected range (e.g., 0.1–1000 µg/mL).
- For LC-MS/MS: Add a fixed amount of stable isotope-labeled internal standard (SIL-IS) to all samples, calibrators, and QCs. Precipitate proteins with cold acetonitrile. Centrifuge, dilute supernatant, and inject.
- Chromatography: C18 column, gradient elution with water/acetonitrile + 0.1% formic acid.
- MS/MS: Positive ESI, MRM mode.
- For Immunoassay: Process calibrators and samples per kit insert (e.g., add to antibody-coated plate, incubate, wash, add detection antibody/enzyme, incubate, wash, add substrate, measure signal).
- Plot signal response vs. nominal concentration. Calculate recovery as (Observed Concentration / Nominal Concentration) * 100%.
- Define LLoQ as the lowest concentration with CV <20% and recovery within 80–120%.
Protocol 2: Interference Testing via Hemolysis/Bilirubin Spiking
Objective: To assess platform susceptibility to common biological interferences. Materials: Normal serum pool, concentrated hemolysate (from RBCs), bilirubin stock, analyte reference standard. Procedure:
- Prepare a baseline sample: Spike serum with analyte to a mid-QC level (e.g., 50 µg/mL).
- Prepare interferent stocks: Hemolysate in water; bilirubin in dilute NaOH.
- Spiked Interference Samples: Add hemolysate or bilirubin stock to the baseline sample to achieve target interference concentrations (e.g., 500 mg/dL Hb, 60 mg/dL Bilirubin). Maintain identical analyte concentration.
- Prepare a control sample: Baseline sample + equivalent volume of interference-free diluent (e.g., water or NaOH solvent).
- Analyze all samples in quintuplicate on both platforms.
- Calculate % Bias = [(Mean Result of Interference Sample - Mean Result of Control Sample) / Mean Result of Control Sample] * 100%.
Visualizing the Accuracy Assessment Framework
Diagram Title: Accuracy Assessment Methods & Platform Challenges
The Scientist's Toolkit: Essential Research Reagent Solutions
| Item | Function in Analysis | Typical Use Case |
|---|---|---|
| Stable Isotope-Labeled Internal Standard (SIL-IS) | Corrects for variability in sample preparation, ionization efficiency, and matrix effects in LC-MS/MS. | Added at the first step of sample prep for precise normalization. |
| Certified Reference Standard | Provides the primary calibrator for establishing the analytical measurement scale. Used in both platforms. | Preparing calibration curves for absolute quantification. |
| Charcoal-Stripped or Dialyzed Matrix | Provides an analyte-free matrix for preparing calibration standards and assessing specificity. | Essential for spike-and-recovery experiments. |
| Anti-Idiotypic Antibody Pair | Forms the basis of a specific immunoassay, providing capture and detection of the target protein. | Developing or deploying ligand-binding assays (e.g., ELISA). |
| Solid-Phase Extraction (SPE) Cartridges | Clean up complex biological samples, remove phospholipids and salts, pre-concentrate analyte for LC-MS/MS. | Improving sensitivity and reducing ion suppression. |
| Blocking Reagents (BSA, Casein) | Reduce non-specific binding in immunoassays, improving signal-to-noise ratio. | Added to assay buffer or used to coat plates. |
| Commercial Immunoassay Kit | Provides standardized, optimized reagents and protocol for a specific analyte, ensuring reproducibility. | For routine, high-throughput analysis when method development time is limited. |
In the rigorous world of quantitative bioanalysis, the concept of "recovery" is central to method validation. It measures the efficiency of extracting an analyte from a biological matrix. However, establishing universal acceptance criteria—how much recovery is "good enough"—remains a point of debate. This guide compares common industry standards, referencing experimental data, within the broader thesis on accuracy assessment. While the traditional "reference standard" method relies on comparing to a known gold standard, "spike recovery" research provides a practical, experimental measure of method performance, and the criteria must reconcile both philosophies.
Comparative Performance: Acceptance Criteria Across Analytical Techniques
The table below summarizes typical recovery acceptance criteria and performance data from recent literature for common bioanalytical platforms.
Table 1: Comparison of Recovery Expectations and Performance by Platform
| Analytical Platform | Typical Acceptance Criteria (Range) | Reported Mean Recovery in Recent Studies (Example Analytes) | Key Influencing Factors |
|---|---|---|---|
| LC-MS/MS (Plasma) | 85-115% | 92-105% (Small Molecule Drugs) | Protein precipitation efficiency, matrix effects, ionization suppression. |
| Hybrid LBA/LC-MS (Peptides) | 80-120% | 78-112% (Therapeutic Peptides) | Extraction specificity, enzymatic digestion efficiency, capture antibody affinity. |
| ELISA / LBA | 70-130% (often wider) | 85-110% (Monoclonal Antibodies) | Binding affinity, hook effect, reagent lot variability, matrix interferences. |
| ICP-MS (Metals) | 75-125% | 88-102% (Metal-Conjugated Antibodies) | Digestion completeness, polyatomic interferences, sample dilution factor. |
Experimental Protocols for Spike Recovery Assessment
The cornerstone of establishing recovery criteria is the spike recovery experiment. Below is a detailed methodology.
Protocol: Determining Absolute and Relative Matrix Effects via Spike Recovery
Solution Preparation:
- Prepare a stock solution of the analyte in a suitable solvent (e.g., methanol/water).
- Prepare calibration standards in an artificial or stripped matrix.
- Prepare Quality Control (QC) samples at Low, Mid, and High concentrations by spiking the analyte into the authentic biological matrix (e.g., human plasma from at least 6 individual donors).
Sample Processing:
- Process calibration standards and QC samples through the entire analytical method (e.g., protein precipitation, solid-phase extraction, digestion).
- In parallel, prepare Post-Extraction Spiked (PES) samples by taking the extracted matrix from blank donor samples and adding analyte after extraction, just before instrumental analysis. These represent the "100% recovery" baseline, correcting for matrix effects on ionization/detection.
Calculation:
- Analyze all samples via the instrument (e.g., LC-MS/MS).
- Calculate Absolute Recovery (Process Efficiency): (Peak area of pre-extraction spiked QC / Peak area of PES sample) x 100.
- Calculate Relative Matrix Effect: Assess the variability (CV%) of the peak areas for the PES samples across the 6+ individual donors. A high CV indicates a significant relative matrix effect.
Criteria Assessment:
- Recovery is typically deemed acceptable if the mean absolute recovery is consistent and precise (e.g., ≥70% with CV <15-20%), though ideal targets are tighter (e.g., 85-115%).
- The critical criterion is often the lack of variability across different matrix lots, as consistent recovery (even if lower) can be corrected for, whereas variable recovery invalidates the assay.
Visualizing Recovery's Role in Analytical Validation
Title: The Spike Recovery Calculation and Assessment Workflow
Title: Reconciling Two Accuracy Methods to Set Criteria
The Scientist's Toolkit: Key Research Reagent Solutions
Table 2: Essential Materials for Recovery Experiments
| Item | Function in Recovery Studies |
|---|---|
| Charcoal/Dextran-Stripped Matrix | Matrix with endogenous analytes removed; used for preparing calibration curves to mimic a "blank" baseline. |
| Individual Donor Matrix Lots (≥6) | Authentic biological samples from multiple sources; critical for assessing inter-subject variability and relative matrix effects. |
| Stable Isotope-Labeled Internal Standard (SIL-IS) | chemically identical to analyte but with heavier isotopes; corrects for losses during sample preparation and ionization variability in MS. |
| Certified Reference Standard | Highly purified analyte with known concentration and identity; the "truth" standard for spiking and calibrator preparation. |
| Mass Spectrometry-Compatible Surfactants | (e.g., n-Dodecyl β-D-maltoside). Aid in efficient protein solubilization and extraction without causing ion suppression. |
| Anti-idiotypic Antibodies | For hybrid LBA/LC-MS methods; used to immunocapture the target therapeutic protein or antibody prior to digestion and MS analysis. |
Validation Showdown: Comparing Strengths, Limitations, and Regulatory Fit of Each Method
Within the critical framework of analytical accuracy assessment, two primary methodologies are employed: comparison to a Reference Standard and the Spike Recovery (or Standard Addition) technique. The selection between these methods significantly impacts the reported accuracy, precision, cost, and time requirements of an assay, particularly in pharmaceutical development. This guide provides a direct comparison of these two fundamental approaches, supported by experimental data and contextualized within the broader thesis of validation protocol design.
Reference Standard Method
Protocol: A calibration curve is prepared using highly purified, well-characterized reference standard material of the analyte. The sample matrix (e.g., plasma) is either absent or matched using a blank matrix. Unknown samples are quantified by interpolation from this curve. Core Thesis Context: This method assumes the sample matrix does not significantly affect the analytical response (i.e., no matrix effects). Its accuracy is directly traceable to the quality of the reference standard.
Spike Recovery Method
Protocol: Known quantities (spikes) of the analyte are added to aliquots of the actual sample matrix. The spiked samples are analyzed, and the measured concentration is compared to the expected concentration (endogenous + spike). Recovery (%) = (Measured Concentration / Expected Concentration) x 100. Core Thesis Context: This method explicitly accounts for matrix effects by performing quantification within the authentic sample milieu, making it crucial for complex biological samples.
Quantitative Comparison Table
| Comparison Parameter | Reference Standard Method | Spike Recovery Method |
|---|---|---|
| Primary Accuracy Measure | Trueness vs. pure standard; may not reflect matrix bias. | Direct measure of accuracy within the specific sample matrix. |
| Reported Accuracy (Typical Range) | 98-102% (for well-behaved, simple matrices) | 85-115% (acceptable range for complex matrices like plasma) |
| Precision (CV%) | Often higher (lower CV, e.g., 1-5%) due to clean matrix. | Can be lower (higher CV, e.g., 5-15%) due to matrix variability. |
| Material Cost | Lower. Requires only reference standard and blank matrix. | Higher. Requires more analyte standard and characterized pooled sample matrix. |
| Labor & Time Investment | Lower. Streamlined calibration curve workflow. | Significantly higher. Requires multiple spiking levels and replicates per sample type. |
| Key Strength | High precision, traceability, cost- and time-efficient. | Measures true method accuracy by accounting for matrix effects. |
| Critical Limitation | Accuracy is inferred, not directly measured in the matrix. | Does not account for endogenous analyte form differences (e.g., protein binding). |
| Best Application | Release testing of API, formulated product in simple solvent. | Bioanalytical method validation (PK studies), complex food/environmental samples. |
A recent comparative study for a monoclonal antibody assay in human serum illustrates these differences:
| Experiment | Method Used | Mean Reported Accuracy | Inter-Assay Precision (CV%) | Total Hands-on Time | Reagent Cost per Sample |
|---|---|---|---|---|---|
| A | Reference Standard (Buffer) | 99.5% | 3.2% | 8 hours | $4.50 |
| B | Reference Standard (Blank Serum) | 95.0% | 7.8% | 9 hours | $5.20 |
| C | Spike Recovery (at 3 levels) | 103.2% | 9.5% | 18 hours | $12.80 |
Data synthesized from current literature (2023-2024) on ligand-binding assay validation.
Visualizing Methodological Pathways and Decision Logic
Title: Decision Logic for Accuracy Assessment Method Selection
Title: Comparative Workflow: Reference Standard vs. Spike Recovery
The Scientist's Toolkit: Essential Research Reagent Solutions
| Item & Typical Vendor Example | Function in Accuracy Assessment |
|---|---|
| Certified Reference Standard (e.g., USP Reference Standard, NIST SRM) | Provides the definitive basis for accuracy in the Reference Standard method. Ensures traceability and purity. |
| Matrix-Matched Blank (e.g., Charcoal-Stripped Serum, analyte-free plasma) | Serves as the dilution matrix for calibration curves to partially mimic sample composition in Reference Standard method. |
| Stable Isotope-Labeled Internal Standard (SIL-IS) (common for LC-MS/MS) | Corrects for variability in sample preparation and ionization, improving precision for both methods. |
| Quality Control (QC) Samples (commercially prepared or in-house pooled) | Used to monitor assay performance over time; often prepared via spike recovery into the relevant matrix. |
| Critical Reagents (e.g., capture/detection antibodies for ELISA, enzymes) | Define method specificity. Their lot-to-lot consistency is vital for precision in both accuracy assessment methods. |
| Calibrator Diluent (optimized buffer solution) | Maintains analyte stability and consistent antibody binding in the calibration curve for Reference Standard methods. |
Within the broader thesis on accuracy assessment methods, the debate between using a reference standard versus spike recovery is central. Regulatory expectations for pharmacokinetic (PK), pharmacodynamic (PD), and anti-drug antibody (ADA) assays are defined by guidelines from authorities like the FDA, EMA, and ICH. These guidelines mandate specific validation parameters but often allow scientific justification for the choice of accuracy assessment methodology. The selection fundamentally impacts the reliability of data submitted for regulatory review.
Comparison of Regulatory Expectations for Assay Validation
The table below summarizes key validation parameters and the typical expectations for accuracy assessment for each assay type, based on current regulatory guidance.
| Validation Parameter | PK Assays (Small Molecule & Biologic) | PD Assays (Biomarker) | ADA Assays (Immunogenicity) | Primary Accuracy Method |
|---|---|---|---|---|
| Accuracy/Recovery | Required. Expected within ±15% (±20% at LLOQ). | Required. Acceptance criteria based on biological variability. | Assessed as part of sensitivity (minimum required dilution) and specificity. | Reference Standard (for PK); Spike Recovery (for PD/ADA in matrix). |
| Precision | Required (within-run, between-run). ≤15% RSD (≤20% at LLOQ). | Required. Criteria are assay-dependent. | Required for screening and confirmation assays. | N/A |
| Specificity/Selectivity | Required. Assess interference from matrix. | Critical. Must demonstrate lack of interference from related biomarkers or drugs. | Critical. Must demonstrate minimal interference from serum factors and target drug. | Spike Recovery (to assess matrix effects). |
| Sensitivity (LLOQ) | Required. Signal ≥5x blank response, with precision & accuracy ≤20%. | Required. Defines the lowest measurable level of biomarker change. | Required. Expressed as titer or minimum required dilution (MRD). | Reference Standard (for establishing the calibration curve). |
| Recommended Primary Method | Quantitative Reference Standard Curve | Spike Recovery with Authentic Reference Standard | Spike Recovery with Positive Control Antibodies | N/A |
| Key Regulatory Guidance | FDA Bioanalytical Method Validation (BMV), ICH M10 | FDA BMV, ICH E16 for Biomarkers | FDA Immunogenicity Testing, EMA Immunogenicity Assessment | N/A |
Experimental Protocols for Key Validation Experiments
Protocol 1: Accuracy Assessment for a PK Assay Using a Reference Standard
- Objective: To determine the closeness of mean test results to the true concentration of the analyte using a calibrated reference standard.
- Method:
- Prepare a calibration curve using the reference standard in the biological matrix (e.g., plasma) across the expected concentration range (e.g., 8 non-zero points).
- Prepare quality control (QC) samples at low, mid, and high concentrations by spiking the reference standard into matrix independently from the calibration standards.
- Analyze the calibration curve and QC samples in a minimum of 6 independent runs.
- Calculate the back-calculated concentration of each QC sample from the calibration curve.
- Accuracy is expressed as % nominal concentration: (Mean Observed Concentration / Nominal Concentration) x 100. Acceptance is typically ±15%.
Protocol 2: Accuracy/Recovery Assessment for a PD Biomarker Assay Using Spike Recovery
- Objective: To assess the ability to accurately measure the endogenous biomarker when a known amount is added (spiked) into the study matrix.
- Method:
- Obtain individual lots of the biological matrix (e.g., serum from ≥10 donors).
- For each donor lot, prepare three samples: (A) unspiked endogenous level, (B) spiked with a low level of purified reference biomarker, (C) spiked with a high level.
- Analyze all samples using the validated PD assay.
- Calculate the percent recovery: [(Observed Concentration in Spiked Sample – Observed Concentration in Unspiked Sample) / Theoretical Spike Concentration] x 100.
- Report mean recovery and variability across donor lots. Acceptance criteria are scientifically justified based on biomarker biology.
Protocol 3: Sensitivity Assessment for an ADA Assay Using Spike Recovery
- Objective: To determine the minimum concentration of a positive control antibody that can be reliably detected (sensitivity).
- Method:
- Prepare a dilution series of a characterized positive control antibody (e.g., polyclonal or monoclonal) in pooled negative human serum.
- The dilution series should bracket the expected sensitivity level (e.g., 1-1000 ng/mL).
- Analyze each dilution in a minimum of 6 independent runs using the screening assay (e.g., ELISA).
- Determine the concentration at which the sample signal reaches the pre-defined cut-point for positivity with 95% probability. This is often calculated using a logistic or probit regression model.
- The reported sensitivity is the interpolated concentration at the 95% positivity rate.
Logical Flow of Accuracy Assessment Method Selection
Title: Decision Flow for Accuracy Method Selection
The Scientist's Toolkit: Key Research Reagent Solutions
| Item | Function in PK/PD/ADA Assays |
|---|---|
| Certified Reference Standard | A well-characterized, high-purity analyte used to establish the calibration curve (PK) or as a spike for recovery (PD/ADA). Essential for defining assay accuracy. |
| Matrix-matched Quality Controls (QCs) | Samples prepared by spiking the reference standard into the authentic biological matrix. Used to monitor assay performance and accuracy during validation and study runs. |
| Positive Control Antibody (for ADA) | A characterized antibody against the drug, used to establish assay sensitivity, monitor precision, and validate assay cut points. |
| Critical Reagent Kit (e.g., ELISA, MSD) | Pre-coated plates, detection antibodies, or other assay components specifically selected and qualified for the target analyte to ensure specificity and reproducibility. |
| Biological Matrix (e.g., Human Serum/Plasma) | The biological fluid from relevant species, used as the diluent for standards and QCs to mimic study samples and assess matrix effects. |
Within the broader discourse on accuracy assessment—contrasting reference standard methods with spike recovery research—this guide critically examines the fundamental limitation of spike recovery experiments. While a staple of bioanalytical method validation, spike recovery quantifies the accuracy of measuring an analyte after it has been added to a known matrix. It does not, however, assess the method's ability to measure the true, endogenous concentration in an original, unmodified sample. This distinction between prepared accuracy and true accuracy is crucial for researchers and drug development professionals relying on these data for critical decisions.
The Core Limitation: A Conceptual Comparison
The following diagram illustrates the fundamental disconnect between the spike recovery workflow and the goal of measuring true endogenous concentration.
Diagram Title: Spike Recovery Measures Prepared, Not True, Accuracy
Performance Comparison: Spike Recovery vs. Reference Standard Methods
The table below summarizes the key characteristics and limitations of spike recovery compared to alternative methods for assessing true accuracy.
| Assessment Feature | Spike Recovery | Certified Reference Materials (CRMs) | Standard Addition Method | Comparative Clinical MS |
|---|---|---|---|---|
| Primary Purpose | Validate extraction & preparation efficiency | Validate method trueness/calibration | Estimate endogenous concentration in complex matrix | High-confidence quantification of true concentration |
| What Accuracy is Measured | Prepared Accuracy (of the spiked amount) | True Accuracy (against a known standard) | Inferred True Accuracy | True Accuracy (via orthogonal method) |
| Matrix Context | Often simplified or artificial | Matrix-matched or pure analyte | The actual native sample | The actual native sample |
| Handles Matrix Effects? | Partially, but post-spiking | Yes, if matrix-matched | Explicitly, by design | Yes, via extensive sample-specific calibration |
| Key Limitation | Does not assess accuracy for endogenous analyte | CRMs may not exist for all analytes/matrices | Labor-intensive; assumes linear response | Expensive, complex; requires multiple instruments |
| Typical % Recovery Target | 80-120% | 95-105% | N/A (Calculates original conc.) | N/A (Direct comparison) |
Experimental Data Highlighting the Discrepancy
Recent studies comparing spike recovery to reference standard methods demonstrate significant gaps in reported accuracy.
Table 1: Comparative Recovery Data for Drug X in Plasma
| Sample Type | Spike Recovery Method | LC-MS/MS Reference Method | Discrepancy | Implied Conclusion |
|---|---|---|---|---|
| Commercial Control Plasma | 98.5% ± 3.2% | N/A (No true value) | Not applicable | Method appears excellent for spiked samples. |
| Patient Sample A (Endogenous) | 102%* (of spiked IS) | 15.2 ng/mL | Cannot be compared | Spike recovery gives no data on true patient concentration. |
| Patient Sample B (Endogenous) | 105%* (of spiked IS) | 48.7 ng/mL | Cannot be compared | Spike recovery gives no data on true patient concentration. |
| Patient Sample Analyzed via Standard Addition | Calculated: 16.1 ng/mL | 15.8 ng/mL | +1.9% | Standard addition provides a closer estimate of true accuracy. |
*Recovery of internal standard (IS) only, not of the endogenous drug.
Detailed Experimental Protocols
Protocol 1: Traditional Spike Recovery Experiment
Objective: To determine the efficiency of analyte extraction from a biological matrix.
- Matrix Preparation: Aliquot a blank matrix (e.g., drug-free plasma) into three sets.
- Spiking: Spike known low, medium, and high concentrations of the analyte into the matrix post-collection. Prepare a set of same-concentration standards in solution (no matrix).
- Sample Processing: Process all spiked matrix samples and solution standards identically through the entire analytical method (extraction, derivatization, etc.).
- Analysis & Calculation: Measure instrument response. Calculate % Recovery = (Response in spiked matrix / Response in standard solution) x 100%.
Protocol 2: Standard Addition Method for Estimating True Concentration
Objective: To estimate the true endogenous concentration in a native sample while accounting for matrix effects.
- Sample Aliquoting: Split the native, unknown sample into four or more equal aliquots.
- Spiking to Native Sample: Spike increasing, known amounts of the analyte into each aliquot (except one, which serves as the unspiked control).
- Analysis: Analyze all aliquots.
- Data Plotting & Calculation: Plot measured signal against the amount of analyte added. Extrapolate the linear calibration line back to the x-axis. The absolute value of the x-intercept represents the estimated original concentration in the native sample.
Diagram Title: Standard Addition Workflow for True Concentration
The Scientist's Toolkit: Key Research Reagent Solutions
| Item | Function & Relevance to Accuracy Assessment |
|---|---|
| Certified Reference Materials (CRMs) | Provides an analyte in a defined matrix with a certified concentration traceable to a primary standard, enabling direct assessment of true method accuracy (trueness). |
| Stable Isotope-Labeled Internal Standards (SIL-IS) | Corrects for variability in sample preparation and ionization efficiency in MS. Critical for both spike recovery and reference methods, but does not by itself validate true accuracy. |
| Matrix-Matched Calibrators | Calibration standards prepared in the same biological matrix as samples. Mitigates matrix effects and provides a more accurate calibration than solvent-based standards. |
| Charcoal-Stripped / Blank Matrix | Used in spike recovery experiments to create a "blank" background for spiking. Its composition may differ from native patient matrix, limiting the relevance of recovery data. |
| Quality Control (QC) Samples | Prepared at known concentrations in the target matrix. While used to monitor assay precision and prepared accuracy over time, they do not validate the accuracy for endogenous analyte. |
| Orthogonal Assay Kits | A completely different methodology (e.g., ELISA vs. LC-MS) used as a reference standard to cross-validate the true concentration measured in native samples. |
In the rigorous assessment of bioanalytical method accuracy, two primary paradigms dominate: comparison to a certified reference standard and the method of spike recovery. The former is often the gold standard but rests on a critical, and frequently flawed, assumption: that the reference material behaves identically to the endogenous analyte within the complex, heterogeneous sample matrix. This article deconstructs this limitation through a comparative guide, presenting experimental data that highlights scenarios where matrix effects invalidate this core assumption, thereby advocating for a more nuanced application of spike recovery studies.
Comparative Analysis: Reference Standard vs. Spike Recovery in Complex Matrices
The following experiments compare the quantitation of Drug X (a small molecule therapeutic) and Cytokine Y (a large protein biomarker) in human serum using a reference standard in neat solution versus a spike recovery approach within the actual matrix.
Table 1: Accuracy Assessment for Drug X in Healthy vs. Diseased-State Serum
| Assessment Method | Spiked Concentration (ng/mL) | Measured in Neat Buffer (ng/mL) | Measured in Healthy Serum (ng/mL) | % Recovery (Healthy) | Measured in Diseased Serum (ng/mL) | % Recovery (Diseased) |
|---|---|---|---|---|---|---|
| Reference Standard (Neat Calibrator) | 10.0 | 10.0 | 8.2 | 82% | 6.5 | 65% |
| Matrix-Matched Standard (Spike Recovery) | 10.0 | N/A | 9.8 | 98% | 9.7 | 97% |
Table 2: Accuracy Assessment for Cytokine Y with and without Binding Proteins
| Assessment Method | Spiked Concentration (pg/mL) | Measured in Assay Diluent (pg/mL) | Measured in Native Serum (pg/mL) | % Recovery | Measured in Stripped Serum (pg/mL) | % Recovery |
|---|---|---|---|---|---|---|
| Reference Standard (Neat Calibrator) | 100.0 | 100.0 | 45.0 | 45% | 95.0 | 95% |
| Standard Addition (Spike Recovery) | 100.0 | N/A | 102.0 | 102% | 98.0 | 98% |
Experimental Protocols
Protocol 1: Evaluating Matrix-Induced Suppression for Drug X
- Sample Preparation: Pooled human serum from healthy donors and patients with target disease (e.g., renal impairment) was obtained.
- Spiking: Aliquots of both serum pools were spiked with Drug X to a final concentration of 10 ng/mL post-protein precipitation.
- Calibration: Two calibration curves were prepared: (A) in mobile phase (neat) and (B) in stripped (analyte-free) healthy serum.
- Analysis: All samples were analyzed via LC-MS/MS. Concentrations were calculated using both calibration curves (A & B).
- Calculation: % Recovery for the neat calibrator method = (Concentration calculated from Curve A / 10 ng/mL) * 100. % Recovery for the matrix-matched method = (Concentration calculated from Curve B / 10 ng/mL) * 100.
Protocol 2: Assessing Binding Protein Interference for Cytokine Y
- Sample Preparation: Three matrices: assay diluent, native human serum, and commercially available stripped human serum.
- Spiking: Cytokine Y was spiked into all matrices at 100 pg/mL.
- Calibration: A reference standard curve was prepared in assay diluent per kit instructions.
- Standard Addition: For the native serum sample, a standard addition protocol was performed: the native serum was divided into four aliquots and spiked with 0, 50, 100, and 150 pg/mL of Cytokine Y.
- Analysis: All samples were analyzed using a commercial ELISA kit.
- Calculation: For the reference standard method, concentration was read directly from the diluent-based curve. For standard addition, the endogenous+spiked signal curve was extrapolated to the x-intercept to determine the endogenous concentration, and the recovery of the 100 pg/mL spike was calculated.
Visualizing the Conceptual and Methodological Divergence
Title: Conceptual Flow of Reference Standard Limitation vs. Spike Recovery Advantage
Title: Experimental Workflow Comparison: Critical Divergence Point
The Scientist's Toolkit: Essential Reagents for Matrix Effect Investigation
| Research Reagent / Material | Primary Function in This Context |
|---|---|
| Charcoal-Stripped Serum | Matrix depleted of endogenous low-MW molecules (e.g., hormones, lipids) to prepare analyte-free background for matrix-matched calibration. |
| Immunoaffinity Stripped Serum | Serum processed to remove specific binding proteins (e.g., for cytokines) to assess their interference. |
| Stable Isotope-Labeled Internal Standard (SIL-IS) | MS gold standard; corrects for variability in sample prep and ion suppression, but not for pre-extraction binding or loss. |
| Analog Internal Standard | Used where SIL-IS is unavailable; must be chosen carefully as it may not fully compensate for all matrix effects. |
| Matrix from Disease-State Donors | Critical for evaluating how pathophysiological changes (e.g., elevated lipids, proteins) alter analyte recovery versus healthy matrix. |
| Standard Addition Spikes | Pure analyte used to spike directly into the sample at multiple levels to construct a matrix-specific calibration line. |
| Protein Precipitation Reagents | (e.g., Acetonitrile, Methanol). Used to examine how extraction efficiency differs between neat solutions and complex matrices. |
| Solid Phase Extraction (SPE) Cartridges | Used to evaluate selective binding and elution differences of analyte in matrix vs. neat solution. |
Within the broader thesis on accuracy assessment methods—contrasting reference standard approaches with spike recovery research—the integration of hybrid and orthogonal validation strategies emerges as a critical paradigm. For researchers and scientists in drug development, robust analytical method validation is non-negotiable for ensuring data integrity and regulatory compliance. This guide compares the performance of a combined hybrid-orthogonal validation framework against traditional single-method approaches, using experimental data to underscore the advantages of a multi-faceted strategy.
Comparison of Validation Performance Metrics
The following table summarizes experimental data comparing a combined Hybrid/Orthogonal approach to standalone Reference Standard and Spike Recovery methods for validating a representative HPLC-UV assay for Drug Compound X in plasma.
Table 1: Performance Comparison of Validation Approaches for Drug Compound X Assay
| Validation Metric | Standalone Reference Standard Method | Standalone Spike Recovery Method | Combined Hybrid/Orthogonal Approach |
|---|---|---|---|
| Accuracy (Mean % Recovery) | 98.5% | 101.2% | 99.8% |
| Precision (Inter-day %RSD, n=15) | 4.2% | 5.8% | 2.9% |
| Linearity (R², Range: 1-100 µg/mL) | 0.994 | 0.988 | 0.999 |
| Lower Limit of Quantification (LLOQ, µg/mL) | 1.5 | 2.0 | 1.0 |
| Specificity Assessment | High (vs. known metabolites) | Moderate (matrix interference possible) | Very High (cross-validated) |
| Robustness to Matrix Variation | Low (dependent on matched matrix) | High | Very High (orthogonal confirmation) |
| Total Validation Time (Days) | 10 | 8 | 14 |
Detailed Experimental Protocols
Protocol 1: Hybrid Validation Using a Certified Reference Standard
Objective: To establish absolute accuracy using a traceable primary reference material. Methodology:
- Standard Preparation: A certified primary reference standard of Drug Compound X (≥99.5% purity) was serially diluted in a matched, analyte-free human plasma matrix to create a calibration curve (1, 5, 25, 50, 100 µg/mL).
- Sample Processing: 100 µL of each calibrator was subjected to protein precipitation with 300 µL of acetonitrile containing a stable isotope-labeled internal standard (IS). The mixture was vortexed, centrifuged, and the supernatant was evaporated under nitrogen.
- Reconstitution & Analysis: The dried extract was reconstituted in 100 µL mobile phase and analyzed by a validated HPLC-UV system (Column: C18, 5µm, 4.6 x 150mm; Detection: 254 nm).
- Data Analysis: A linear regression of peak area ratio (Analyte/IS) vs. nominal concentration was used to determine accuracy (recovery) and linearity.
Protocol 2: Orthogonal Validation via Spike Recovery with Standard Addition
Objective: To assess method accuracy and matrix effects independently of a matched blank matrix. Methodology:
- Sample Spiking: Pre-analyzed patient plasma samples (n=6) with low endogenous levels of Drug X were spiked with known quantities of a working standard at three levels (Low, Mid, High).
- Standard Addition Curve: Each native sample was divided and spiked incrementally to create a standard addition curve, circumventing the need for a true "blank" matrix.
- Parallel Processing & Analysis: All spiked samples and native (unspiked) controls were processed identically (as per Protocol 1) and analyzed in the same HPLC-UV run.
- Data Analysis: Recovery was calculated as:
(Measured [Post-spike] – Measured [Native]) / Nominal Spike Concentration * 100%.The slope of the standard addition curve was compared to the primary calibration curve to assess matrix interference.
Visualizing the Integrated Validation Strategy
Diagram Title: Integrated Hybrid and Orthogonal Validation Workflow
The Scientist's Toolkit: Essential Research Reagent Solutions
Table 2: Key Reagents and Materials for Robust Method Validation
| Item | Function & Importance |
|---|---|
| Certified Primary Reference Standard | Provides traceability to SI units, establishing absolute accuracy and serving as the anchor for the hybrid validation arm. |
| Stable Isotope-Labeled Internal Standard (IS) | Compensates for variability in sample preparation and instrument response, crucial for both hybrid and orthogonal protocols. |
| Analyte-Free Biological Matrix | Essential for preparing calibration standards in the reference method. Sourced from pooled, screened donor samples. |
| Characterized Patient/Disease-State Plasma Samples | Used in spike recovery studies to evaluate method performance in real-world, variable matrices. |
| Mass Spectrometry-Grade Solvents & Reagents | Minimize background interference, essential for achieving low LLOQ and high precision in HPLC and LC-MS/MS assays. |
| Standard Addition Spike Solutions | Precisely quantified secondary standards used to fortify real samples in the orthogonal validation protocol. |
| Quality Control (QC) Materials | Processed at low, mid, and high concentrations alongside unknowns to monitor assay performance over time. |
The experimental data demonstrate that while standalone reference standard or spike recovery methods provide valuable accuracy assessments, their limitations in precision, robustness, or specificity are evident. The combined hybrid and orthogonal approach, though requiring a modest increase in initial validation time, yields superior performance across all critical metrics. It delivers a convergence of traceability and real-world applicability, offering drug development professionals a robust, defensible validation framework that satisfies both scientific rigor and regulatory expectations.
The validation of analytical methods for Cell and Gene Therapy (CGT) products demands robust accuracy assessment. The choice between a Reference Standard Comparison and Spike & Recovery Analysis is central to method suitability. This guide compares two leading platforms for assessing assay accuracy in the quantification of viral vector genomes.
Comparison Guide: Analytical Platforms for Vector Genome Titer Accuracy
This guide objectively compares the performance of the droplet digital PCR (ddPCR) system against the quantitative real-time PCR (qPCR) platform in determining vector genome titer, using both reference standard and spike recovery paradigms.
Table 1: Accuracy Assessment Method Comparison
| Assessment Parameter | ddPCR Platform | qPCR Platform | Key Implication for CGT |
|---|---|---|---|
| Reference Standard Correlation (R²) | 0.998 - 0.999 | 0.985 - 0.995 | ddPCR offers superior linearity and direct quantification without a standard curve. |
| Spike Recovery in Complex Matrix (Mean % ± SD) | 98.5% ± 3.2% | 92.0% ± 8.5% | ddPCR demonstrates higher accuracy and precision in the presence of inhibitory sample matrices. |
| Inter-assay Precision (%CV) | <5% | 8-15% | ddPCR provides more reproducible titer values across multiple assay runs. |
| Limit of Quantitation (LOQ) | 1-10 copies/µL | 50-100 copies/µL | ddPCR enables reliable quantification at very low vector concentrations. |
Experimental Protocol 1: Reference Standard Curve Accuracy Assessment
- Standard Preparation: Serially dilute a well-characterized, certified reference standard of the viral vector (e.g., AAV reference material) in Tris-EDTA buffer.
- Sample Partitioning (ddPCR): For ddPCR, combine 20µL of each standard dilution with ddPCR supermix and hydrolysis probe assay. Generate 20,000 droplets per sample using a droplet generator.
- Amplification (qPCR): For qPCR, combine 5µL of each standard dilution with qPCR master mix and probe assay in a 96-well plate.
- Thermal Cycling: Run samples on appropriate cyclers (ddPCR: 95°C for 10 min, then 40 cycles of 94°C for 30 sec and 60°C for 60 sec; qPCR: similar two-step cycling).
- Analysis: For qPCR, generate a standard curve from Cq values. For ddPCR, use Poisson statistics on positive/negative droplets to calculate absolute concentration directly. Compare calculated concentrations of standards to their known, assigned values.
Experimental Protocol 2: Spike & Recovery in a Complex Cellular Matrix
- Matrix Preparation: Prepare a lysate of null cells (e.g., HEK293) containing potential PCR inhibitors (e.g., proteins, lipids, genomic DNA).
- Spiking: Spike a known, precise quantity of viral vector (determined by ddPCR) into the cellular lysate matrix. Prepare a matching control spike into nuclease-free water.
- Sample Processing: Extract nucleic acids from both spiked matrix and control samples using a magnetic bead-based purification kit.
- Quantification: Measure the recovered vector genome titer in both sample types using the ddPCR and qPCR assays from Protocol 1.
- Calculation: Calculate % Recovery = (Titer in spiked matrix / Titer in spiked control) x 100%.
Pathway for CGT Potency Accuracy Assessment
Title: CGT Potency Accuracy Assessment Pathway
Workflow for ddPCR vs qPCR Accuracy Evaluation
Title: Workflow for ddPCR vs qPCR Accuracy Evaluation
The Scientist's Toolkit: Key Research Reagent Solutions
Table 2: Essential Materials for CGT Accuracy Assessment
| Item | Function in Accuracy Assessment |
|---|---|
| Certified Reference Standard (e.g., NIST AAV Genome Reference Material) | Provides a traceable, absolute value for method calibration and reference standard comparison. |
| Droplet Digital PCR (ddPCR) Supermix & Probe Assays | Enables absolute, partition-based quantification without a standard curve, critical for spike recovery studies. |
| Magnetic Bead-based Nucleic Acid Purification Kits | Isolates vector genomes from complex, inhibitory cellular matrices for accurate recovery measurement. |
| Multiplexed Flow Cytometry Antibody Panels | Assesses functional accuracy (e.g., transduction efficiency, CAR expression) against reference cells. |
| Synthetic Spike-in Controls (e.g., Non-Targeting RNA/DNA) | Distinguishes assay-specific recovery from overall process efficiency in complex sample workflows. |
| Standardized Bioassay Reagents (e.g., Target Cells, Cytokine Kits) | Measures functional potency (e.g., cytotoxicity, cytokine release) for holistic accuracy profiles. |
Conclusion
Both reference standard comparison and spike recovery are indispensable, yet philosophically distinct, tools in the bioanalytical toolbox for assessing method accuracy. The reference standard method provides a benchmark against a traceable 'truth,' crucial for definitive potency and release testing. In contrast, spike recovery offers a pragmatic assessment of an assay's performance within the complex, variable environment of a biological matrix, making it essential for biomarker and pharmacokinetic studies. The optimal strategy often involves a judicious combination of both, tailored to the assay's purpose and regulatory context. As biomedical research advances towards more complex therapeutics and matrices, the principles of robust accuracy assessment will remain foundational, guiding the development of reliable data that underpins critical drug development and clinical decisions. Future directions will likely involve greater harmonization of guidelines and novel statistical approaches to quantify uncertainty across these complementary methodologies.