Drug Discovery and Development 2025: From Foundational Principles to AI-Driven Breakthroughs
This article provides a comprehensive overview of the modern drug discovery and development process, tailored for researchers, scientists, and development professionals.
Drug Discovery and Development 2025: From Foundational Principles to AI-Driven Breakthroughs
Abstract
This article provides a comprehensive overview of the modern drug discovery and development process, tailored for researchers, scientists, and development professionals. It begins by exploring the foundational principles of the multi-stage pipeline, from target identification to post-market surveillance. The content then delves into the methodological applications that are transforming the field, with a sharp focus on the integration of Artificial Intelligence (AI), machine learning, and novel therapeutic modalities like PROTACs and radiopharmaceutical conjugates. A dedicated section addresses critical troubleshooting and optimization strategies to mitigate high attrition rates and manage costs. Finally, the article examines advanced validation techniques and comparative frameworks essential for ensuring translational success and regulatory approval, synthesizing the latest 2025 trends to offer a forward-looking perspective on the industry.
Laying the Groundwork: Core Stages and Historical Context of Drug Development
The drug development pipeline represents a complex, high-stakes journey from initial concept to marketed therapeutic, requiring on average over a decade and a $2.6 billion investment per approved drug [1]. This end-to-end process integrates diverse scientific disciplines, regulatory frameworks, and technological innovations to address the fundamental challenge articulated by Sir Archibald Garrod over a century ago: "Every active drug is a poison, when taken in large enough doses; and in some subjects, a dose which is innocuous to the majority of people has toxic effects, whereas others show exceptional tolerance of the same drug" [1]. Despite technological advances, the industry faces Eroom's Law (Moore's Law backward), where drug development costs have paradoxically doubled approximately every nine years, highlighting an urgent need for more integrated, efficient approaches [1].
The contemporary pipeline is experiencing substantial growth, with over 12,000 drugs in various development phases globally in 2024, representing a 19% annual growth rate since 2019 [2]. By 2025, the pipeline includes approximately 12,700 drugs in the pre-clinical phase alone, demonstrating continued expansion of therapeutic research [3]. This growth coincides with a transformative shift toward artificial intelligence (AI)-driven approaches, with estimates suggesting 30% of new drugs will be discovered using AI, potentially reducing discovery timelines and costs by 25-50% in preclinical stages [4]. This technical guide deconstructs the core principles, methodologies, and evolving frameworks of the modern drug development process for research professionals.
Phase 1: Discovery and Preclinical Research
The discovery phase initiates the pipeline through identification and validation of therapeutic targets, employing increasingly sophisticated computational and experimental methods to select promising candidate molecules.
Target Identification and Validation
Target identification has evolved from traditional biochemical approaches to integrated systems biology methods. Modern target discovery leverages multi-omics data (genomics, proteomics, transcriptomics) to identify disease-associated proteins or pathways with high therapeutic potential [1]. AI-powered platforms can explore chemical spaces spanning 10³³ drug-like compounds, predicting molecular properties with unprecedented accuracy and enabling autonomous experimental decision-making [1]. Validation methodologies employ genetic techniques (CRISPR, RNAi), biochemical assays, and computational models to establish the target's role in disease pathology and its "druggability" – the likelihood of effectively modulating its activity with a drug-like molecule.
Lead Compound Identification and Optimization
Once targets are validated, researchers identify and optimize lead compounds through structured experimental protocols:
- High-Throughput Screening (HTS): Automated screening of compound libraries against biological targets using microplate-based assays. Typical HTS campaigns test 100,000-1,000,000+ compounds in concentration-response formats to identify "hits" with desired activity [1].
Virtual Screening Computational Protocol: As an alternative to physical HTS, this methodology employs molecular docking simulations:
- Prepare compound library database (ZINC, ChEMBL) in appropriate 3D formats
- Generate target protein structure through X-ray crystallography, cryo-EM, or homology modeling
- Define binding site coordinates using known ligand information or pocket detection algorithms
- Perform molecular docking using software (AutoDock Vina, Glide, GOLD) with scoring functions
- Select top-ranking compounds for experimental validation based on binding affinity and pose analysis
Hit-to-Lead Chemistry: Medicinal chemistry optimization cycles employ structure-activity relationship (SAR) analysis to improve potency, selectivity, and early ADMET (Absorption, Distribution, Metabolism, Excretion, Toxicity) properties. This includes synthetic chemistry, analytical characterization (NMR, LC-MS), and in vitro pharmacological profiling.
Preclinical Development Protocol
Promising lead compounds advance through rigorous preclinical testing to evaluate safety and biological activity:
- In Vitro Pharmacology Profiling: Dose-response assays (IC50/EC50 determination), selectivity panels (including off-target screening), and mechanistic studies in disease-relevant cell cultures. Biomarker identification often occurs at this stage, with 27% of active Alzheimer's trials in 2025 incorporating biomarkers as primary outcomes [5].
- In Vivo Efficacy Studies: Animal models (typically rodents) employing disease-relevant endpoints. The FDA's Animal Model Qualification Program currently has 5 projects in development to establish standardized models [6].
- Toxicology and Safety Pharmacology: Good Laboratory Practice (GLP)-compliant studies assessing:
- Maximum tolerated dose (MTD) and no-observed-adverse-effect level (NOAEL)
- Organ-specific toxicity (hematology, clinical chemistry, histopathology)
- Cardiovascular, central nervous system, and respiratory safety pharmacology
- Genetic toxicology (Ames test, micronucleus assay)
Table 1: Key Research Reagent Solutions for Discovery and Preclinical Research
| Reagent/Category | Specific Examples | Research Function |
|---|---|---|
| Cell-Based Assay Systems | Primary cells, iPSCs, immortalized lines | Target validation, compound screening, mechanism of action studies |
| Animal Models | Genetically engineered mice, PDX models, disease-specific models (e.g., AD transgenic) | In vivo efficacy assessment, toxicology, biomarker identification |
| Antibodies & Proteomics | Phospho-specific antibodies, ELISA kits, multiplex immunoassays | Target engagement quantification, signaling pathway analysis, biomarker measurement |
| Chemical Libraries | Diversity sets, fragment libraries, targeted chemotypes | Hit identification, SAR exploration, lead optimization |
| AI/Computational Tools | Molecular docking software, ADMET predictors, generative chemistry platforms | Virtual screening, compound design, property prediction, de novo molecule generation |
Diagram 1: Discovery and Preclinical Workflow
Phase 2: Clinical Development
Clinical development represents the most resource-intensive phase, evaluating candidate drugs in human subjects through sequentially rigorous trial phases with distinct objectives and methodologies.
Clinical Trial Design and Phases
The clinical development pathway progresses through defined phases with specific objectives, methodologies, and success rates:
Table 2: Global Drug Pipeline by Development Phase (2024-2025)
| Development Phase | Number of Drugs (2024) | Number of Drugs (2025) | Primary Objectives | Typical Duration | Success Rate |
|---|---|---|---|---|---|
| Phase I | 5,319 | 4,504 | Safety, tolerability, pharmacokinetics | 1-2 years | ~63% [1] |
| Phase II | 4,979 | 4,231 | Therapeutic efficacy, dose-ranging | 2-3 years | ~30% [1] |
| Phase III | 1,671 | 1,197 | Confirmatory efficacy, safety monitoring | 3-4 years | ~58% [1] |
| Pre-registration | 234 | 202 | Regulatory review and approval | 1-2 years | ~90% [7] |
Protocol Development and Implementation
Robust clinical trial protocols incorporate several critical elements:
- Inclusion/Exclusion Criteria: Precise patient population definition using clinical biomarkers and diagnostic criteria. For example, 73% of Alzheimer's trials in 2025 require biomarkers for participant eligibility [5].
- Endpoint Selection: Composite endpoints incorporating clinical outcome assessments (COA), with 67 projects in development within the FDA's Clinical Outcome Assessment Qualification Program [6].
- Randomization and Blinding: Block randomization, stratification by prognostic factors, and double-blind designs to minimize bias.
- Statistical Analysis Plan: Pre-specified analysis methods, sample size justification with power calculations, and interim analysis plans.
Biomarker Implementation and Validation
Biomarkers play increasingly critical roles throughout clinical development:
- Patient Stratification Biomarkers: Enrichment designs targeting specific subpopulations, particularly in oncology where 38% of pipeline drugs target cancer indications [7].
- Pharmacodynamic Biomarkers: Demonstrating target engagement and biological activity, with 8 biomarkers qualified through the FDA's Biomarker Qualification Program [6].
- Predictive Biomarkers: Identifying patients most likely to respond, with the FDA's Biomarker Qualification Program currently developing 59 projects to establish validated biomarkers [6].
Diagram 2: Clinical Development Pathway
Phase 3: Regulatory Review and Approval
The regulatory review phase represents the critical gateway between clinical development and market availability, with evolving frameworks to address therapeutic innovation.
Regulatory Submission Components
A complete regulatory submission integrates evidence from the entire development continuum:
- Chemistry, Manufacturing, and Controls (CMC): Comprehensive documentation of drug substance and product characterization, manufacturing processes, and quality control specifications.
- Nonclinical Pharmacology/Toxicology: Integrated summaries of all in vitro and in vivo studies, with emphasis on predictive toxicology using AI models to forecast potential safety issues [1].
- Clinical Data Integration: Patient-level data from all clinical trials, with clinical outcome assessments playing an increasingly important role in demonstrating patient benefit [6].
- Risk-Benefit Analysis: Quantitative and qualitative assessment of therapeutic value relative to identified risks, often requiring post-market surveillance commitments [8].
Drug Development Tool Qualification
Regulatory agencies have established qualification programs for drug development tools (DDTs) to enhance development efficiency:
Table 3: FDA Drug Development Tool Qualification Programs (as of June 2025)
| Qualification Program | Projects in Development | Letters of Intent Accepted | Qualification Plans Accepted | Total Qualified DDTs |
|---|---|---|---|---|
| All DDT Qualification Programs | 141 | 121 | 20 | 17 [6] |
| Biomarker Qualification Program | 59 | 49 | 10 | 8 [6] |
| Clinical Outcome Assessment Program | 67 | 58 | 9 | 8 [6] |
| Animal Model Qualification Program | 5 | 5 | 0 | 1 [6] |
| ISTAND Program | 10 | 9 | 1 | 0 [6] |
Therapeutic Area-Specific Considerations
Regulatory pathways continue to evolve for specific therapeutic areas:
- Alzheimer's Disease: The 2025 Alzheimer's disease pipeline includes 182 trials testing 138 drugs, with biological disease-targeted therapies comprising 30% and small molecule DTTs accounting for 43% of the pipeline [5].
- Oncology: Continues to dominate the development pipeline, representing 38% of new medicines in development and 25% of drugs in pre-registration [7].
- Metabolic Disorders: Represent 15% of medicines in pre-registration, with multiple drugs for type 2 diabetes and hyperlipidemia in this late development phase [7].
- Rare Diseases: Orphan medicines comprise a growing share of later pipeline stages, representing 25% of pre-registration drugs in 2025 [7].
Phase 4: Post-Marketing Surveillance and Monitoring
Post-marketing surveillance (PMS) represents the crucial final phase of the drug development lifecycle, providing ongoing safety monitoring in real-world populations far larger and more diverse than clinical trial cohorts.
Post-Marketing Surveillance Frameworks
Modern PMS has evolved from passive reporting systems to active surveillance frameworks:
- Spontaneous Reporting Systems: The FDA Adverse Event Reporting System (FAERS) collects voluntary reports from healthcare professionals, patients, and manufacturers, serving as an early warning system for potential safety concerns [8].
- Active Surveillance Initiatives: The FDA's Sentinel Initiative leverages real-world data for active surveillance and safety signal detection using distributed data networks [9].
- Risk Evaluation and Mitigation Strategies (REMS): Required risk management programs for medications with serious safety concerns, incorporating elements to assure safe use [8].
- Aggregated Outcome Data Registries: Emerging frameworks for AI-based medical devices enable performance monitoring through federated health data networks that comply with privacy guidelines [10].
Comprehensive PMS integrates multiple data sources with distinct strengths and limitations:
Table 4: Post-Marketing Surveillance Data Sources and Applications
| Data Source | Key Strengths | Principal Limitations | Common Applications |
|---|---|---|---|
| Spontaneous Reporting | Early signal detection, global coverage, detailed narratives | Underreporting, reporting bias, limited denominator data | Initial signal identification, rare event detection |
| Electronic Health Records | Comprehensive clinical data, large populations, real-world context | Data quality variability, limited standardization, privacy concerns | Signal confirmation, risk quantification, utilization studies |
| Claims Databases | Population coverage, long-term follow-up, economic data | Limited clinical detail, coding accuracy, administrative focus | Utilization patterns, health economics, outcome trends |
| Patient Registries | Longitudinal follow-up, detailed clinical data, specific populations | Limited generalizability, resource intensive, potential selection bias | Long-term safety, disease-specific outcomes, comparative effectiveness |
| Digital Health Technologies | Continuous monitoring, objective measures, patient engagement | Data validation challenges, technology barriers, privacy concerns | Real-world adherence, digital biomarkers, patient-reported outcomes |
Advanced Analytics in Pharmacovigilance
Artificial intelligence and machine learning are transforming pharmacovigilance capabilities:
- Natural Language Processing (NLP): Transforms unstructured narrative text from case reports, clinical notes, and social media into structured, analyzable information, enabling extraction of safety information from previously inaccessible data sources [9].
- Machine Learning for Signal Detection: Advanced algorithms identify potential safety signals from complex datasets by analyzing patterns across multiple data sources simultaneously, detecting subtle associations traditional methods might miss [9].
- Predictive Analytics: Forecasting potential safety issues based on historical patterns and emerging data trends, supporting proactive risk mitigation and resource allocation decisions [9].
- Real-Time Dashboards: Continuous monitoring capabilities and early warning systems for emerging safety concerns, enabling proactive risk management and rapid response to safety signals [9].
Regulatory Intelligence and Compliance
Global regulatory expectations for PMS continue to evolve and expand:
- FDA Requirements: Center on FAERS and REMS programs, with expectations for robust adverse event reporting systems, required post-marketing studies, and effective risk mitigation measures [9].
- EMA and EudraVigilance: Requires comprehensive adverse event reporting to the European pharmacovigilance database and implementation of risk management plans for all marketed products [9].
- ICH Standards: Provides harmonized guidelines for post-marketing surveillance activities, including case report formatting, periodic safety reporting, and signal detection methodologies [9].
- Recent Regulatory Updates: Include strengthened Sentinel Initiative capabilities, enhanced EudraVigilance for advanced signal detection, and ICH guideline updates addressing digital health technologies and AI applications [9].
Diagram 3: Post-Market Surveillance Cycle
Emerging Technologies and Future Directions
The drug development pipeline is undergoing fundamental transformation through technological innovation, with several disruptive trends reshaping traditional approaches.
Artificial Intelligence and Machine Learning
AI/ML integration across the development continuum represents the most significant technological shift:
- Target Discovery and Validation: AI processes genomics, proteomics, and patient data to identify novel disease-causing proteins and measurable indicators of drug response, identifying targets overlooked by conventional research [1].
- Generative Chemistry: AI designs entirely new molecules from scratch using sophisticated architectures like Variational Autoencoders (VAEs), Generative Adversarial Networks (GANs), and Transformers, exploring chemical spaces inaccessible to human intuition [1].
- Clinical Trial Optimization: AI algorithms scan electronic health records to identify patients matching complex trial criteria, predict site enrollment rates, and enable digital biomarkers from wearables for continuous patient monitoring [1].
- True End-to-End Systems: Integrated AI platforms ensure tools communicate across all stages, create continuous feedback loops where clinical findings inform molecule design, and enable holistic pipeline optimization considering manufacturability and clinical feasibility from inception [1].
Real-World Evidence and Digital Integration
The expanding role of real-world evidence (RWE) is transforming traditional development paradigms:
- RWE in Regulatory Decision-Making: Regulatory authorities increasingly rely on real-world evidence to support post-marketing safety decisions, including label updates, risk mitigation requirements, and market withdrawal determinations [9].
- Digital Health Technologies: Wearable devices, mobile applications, and remote monitoring systems generate continuous health data streams that support safety monitoring and signal detection, capturing patient experiences beyond clinical settings [9].
- Patient-Centric Approaches: Future PMS systems will increasingly incorporate patient-reported outcomes, digital biomarkers, and personalized safety assessments, engaging patients as active participants in safety monitoring [9].
- Continuous Safety Learning: Evolving frameworks will enable real-time adaptation of safety knowledge and risk management strategies based on emerging evidence throughout the product lifecycle [9].
Therapeutic Innovation Trends
Several therapeutic area developments are reshaping the development landscape:
- Diabetes and Obesity Therapeutics: GLP-1 receptor agonists (semaglutide, tirzepatide) show expanding applications beyond diabetes and obesity to chronic kidney disease, cardiovascular risk reduction, and neurodegenerative conditions [2].
- Alzheimer's Disease Pipeline: The 2025 Alzheimer's pipeline shows diversification beyond amyloid-targeting approaches, with agents addressing 15 basic disease processes including inflammation, synaptic function, and tau pathology [5].
- Women's Health Innovations: New drug classes like neurokinin-3 (NK3) receptor antagonists (fezolinetant) offer non-hormonal alternatives for menopause symptom relief, addressing significant unmet needs [2].
- Rare Disease Focus: Orphan drugs represent growing proportions of late-stage pipelines, with 25% of pre-registration drugs in 2025 having orphan designations, reflecting focus on underserved patient populations [7].
The modern drug development pipeline represents an increasingly sophisticated, technology-enabled continuum from discovery through post-market monitoring. While the fundamental framework remains sequential progression through discovery, preclinical, clinical, regulatory, and post-market phases, each stage is being transformed by AI integration, biomarker advancement, and real-world evidence generation. The persistent challenges of high costs, extended timelines, and late-stage failures are being addressed through more integrated, data-driven approaches that create feedback loops across traditional development silos. For research professionals, success in this evolving landscape requires both deep expertise in specific development domains and systems-level understanding of how innovations in one phase impact subsequent stages. As drug development continues its transformation toward more predictive, patient-centered, and efficient models, the organizations and researchers who master these interconnected processes will lead the next generation of therapeutic innovation.
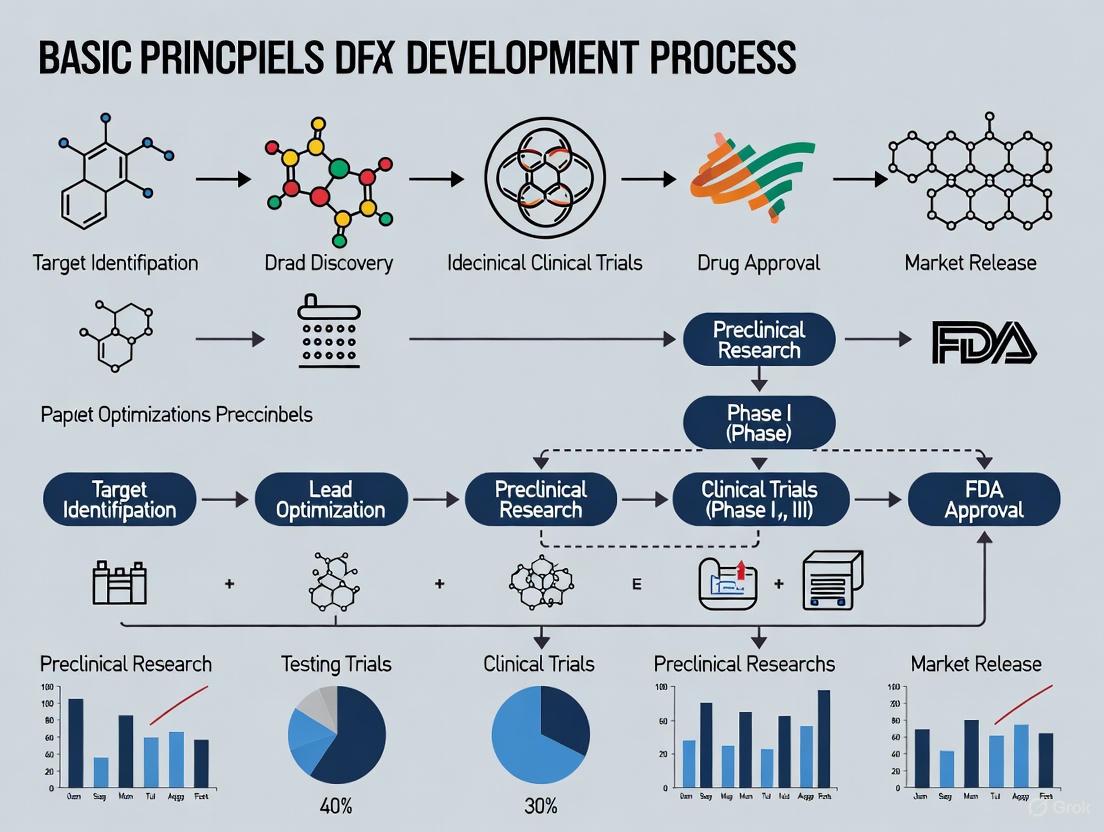
The journey from a theoretical therapeutic concept to a market-approved medicine is a monumental feat of scientific and clinical endeavor. For researchers and drug development professionals, this path is characterized by a rigorous, multi-stage process designed to ensure safety and efficacy, but which also inherently creates immense challenges in time, financial investment, and resource allocation. The industry standard for bringing a new drug to market is 10 to 15 years, with costs reaching $2.6 billion per approved compound when accounting for failures [11] [12]. This whitepaper deconstructs the core principles of the drug discovery and development process, providing a detailed technical analysis of the chronology, costs, and methodologies that define this lengthy and expensive undertaking. The following workflow diagram (Figure 1) maps the entire process, from initial discovery to post-market surveillance, illustrating the progressive stages and their associated outputs.
Quantitative Analysis of Timelines and Costs
The protracted timeline and immense cost of drug development are driven by the sequential nature of the process and the high probability of failure at each stage. The following tables provide a consolidated quantitative overview of these factors, synthesizing data from recent industry analyses and economic evaluations.
Table 1: Drug Development Stage Timeline and Attrition Analysis [13] [11] [14]
| Development Stage | Average Duration (Years) | Probability of Transition to Next Stage | Primary Reason for Failure |
|---|---|---|---|
| Discovery & Preclinical | 3 - 6 | ~0.01% (to final approval) | Toxicity, lack of effectiveness in models |
| Phase I Clinical | 1 - 2 | 52% - 70% | Unmanageable toxicity/safety in humans |
| Phase II Clinical | 1 - 3 | 29% - 40% | Lack of clinical efficacy |
| Phase III Clinical | 2 - 4 | 58% - 65% | Insufficient efficacy, safety in large population |
| Regulatory Review | 1 - 1.5 | ~91% | Insufficient evidence, safety/efficacy concerns |
Table 2: Comprehensive Cost Analysis of Drug Development [15] [11] [16]
| Cost Category | Amount (USD Millions) | Context and Inclusions |
|---|---|---|
| Mean Out-of-Pocket Cost | $172.7 million | Direct cash outlay for a single approved drug, nonclinical through postmarketing. |
| Mean Expected Cost | $515.8 million | Out-of-pocket cost inclusive of expenditures on failed drugs. |
| Mean Expected Capitalized Cost | $879.3 million - $2.6 billion | Expected cost including cost of capital (time value of money); varies by study and therapeutic area. |
| Clinical Trial Proportion | 60% - 70% | Percentage of total R&D expenditure consumed by clinical trials (Phases I-III). |
Stage 1: Discovery and Preclinical Research
Experimental Aims and Methodologies
The initial phase aims to identify a viable therapeutic target and a compound that can safely and effectively modulate it.
- Target Identification and Validation: Researchers use bioinformatics, genetic screening (e.g., CRISPR), and molecular biology techniques to identify and confirm the role of a specific biological target (e.g., a protein, gene, or pathway) in a disease mechanism [16].
- Lead Compound Identification: High-Throughput Screening (HTS) of thousands to tens of thousands of compounds (5,000–10,000 is common) is conducted against the validated target using automated, miniaturized assays to identify "hits" [13] [16].
- Lead Optimization: Medicinal chemistry and computer-aided drug design (CADD) are used to iteratively improve the chemical structure of "hit" compounds to become "leads" with enhanced potency, selectivity, and drug-like properties (ADME: Absorption, Distribution, Metabolism, Excretion) [16].
- Preclinical Safety & Efficacy: Optimized lead compounds undergo rigorous in vitro (cell-based) and in vivo (animal model) testing. This includes repeated-dose toxicity studies in at least two animal species, genotoxicity assessment, safety pharmacology (cardiac, respiratory, CNS), and pharmacokinetic/pharmacodynamic (PK/PD) profiling, all conducted under Good Laboratory Practice (GLP) standards [13] [12].
The Scientist's Toolkit: Key Research Reagents and Materials
Table 3: Essential Reagents and Materials for Discovery and Preclinical Research
| Reagent/Material | Primary Function |
|---|---|
| Cell Lines | In vitro models for initial target validation, HTS, and efficacy/toxicity testing. |
| Animal Models (e.g., Rodents, Zebrafish) | In vivo systems to study complex pharmacology, toxicity, and disease phenotypes in a whole organism. |
| High-Throughput Screening Assay Kits | Reagent systems enabling rapid, automated testing of thousands of compounds for activity against a target. |
| Analytical Standards & Reagents | Pure compounds and biochemicals for assay development, calibration, and validation (e.g., HPLC, MS). |
| GLP-Compliant Toxicology Assays | Standardized test kits for assessing organ toxicity, genotoxicity, and safety pharmacology in regulated studies. |
Stage 2: Clinical Research – The Human Trials
Clinical research is the most time-consuming and costly part of development, designed to establish safety and efficacy in humans. The following diagram (Figure 2) details the sequential phases, key objectives, and the steep attrition rate that characterizes this stage.
Clinical Trial Experimental Protocols
- Phase I Protocol: First-in-human studies focus on safety and tolerability. A typical protocol involves sequential dose escalation cohorts to determine the Maximum Tolerated Dose (MTD) and characterize the pharmacokinetic (PK) profile. Primary endpoints are the incidence and severity of adverse events. Studies enroll 20-100 subjects, either healthy volunteers or patients, over several months to a year [13] [11] [14].
- Phase II Protocol: These are the first controlled studies in patients with the target disease, designed to assess efficacy and further evaluate safety. Protocols are typically randomized and may be placebo-controlled or compared to a standard of care. Key endpoints are often clinical or biomarker-based measures of efficacy (e.g., tumor shrinkage, symptom score reduction). Dose-finding (IIa) and efficacy confirmation (IIb) studies involve 100-300 patients and last 1-3 years [13] [11].
- Phase III Protocol: These are large, randomized, controlled, multi-center "pivotal" trials intended to provide definitive evidence of efficacy and safety for regulatory approval. Protocols are complex, often involving long-term follow-up, multiple sub-studies, and diverse patient populations. They are powered to detect statistically significant differences in primary efficacy endpoints (e.g., overall survival, progression-free survival) and to characterize rare adverse events. These trials enroll 300 to over 3,000 patients and can take 2-4 years to complete [13] [14] [12].
The Converging Forces of Time and Cost
The timelines and costs detailed in previous sections are not independent; they are synergistic factors that create the "staggering" final figure. The relationship is driven by three core principles:
- The Cost of Failure: The financial model is built on the reality that over 90% of drug candidates that enter clinical trials fail [11] [17]. The profits from the rare successful drug must subsidize the sunk costs of all the failures. A study breaking down development costs found that the mean out-of-pocket cost per approved drug was $172.7 million, but this ballooned to $515.8 million when the cost of failed programs was included [15].
- The Cost of Capital (Time Value of Money): Drug development requires investing hundreds of millions of dollars over a decade or more before any revenue is generated. This "time value of money" or opportunity cost is quantified as the cost of capital. When this factor is incorporated, the $515.8 million expected cost inflates to a capitalized cost of $879.3 million to over $2.6 billion per approved drug [15] [11]. A single day's delay in a late-stage trial, where investment is highest, has a massive impact on the final capitalized cost.
- Clinical Trials as the Primary Cost Driver: The clinical phase accounts for 60-70% of total R&D expenditure [16]. This is due to the enormous logistical scale, lengthy duration, and high per-patient costs associated with running GCP-compliant trials across multiple global sites, including expenses for patient recruitment, site management, and regulatory compliance [11] [16].
Emerging Trends and Future Outlook
The industry is actively pursuing strategies to mitigate these timeline and cost challenges. Key trends shaping the future of drug development include:
- Artificial Intelligence and Machine Learning: AI is projected to drive 30% of new drug discoveries by 2025 [4]. AI platforms are being used to identify drug candidates, design optimal clinical trials by predicting patient profiles and success factors, and analyze patent landscapes to de-risk R&D strategy, potentially reducing discovery timelines and costs by 25-50% in preclinical stages [4] [11].
- Alternative Preclinical Models: To address the high failure rate in translation, researchers are shifting from traditional models to more predictive systems. These include organ-on-a-chip systems, humanized models, and the use of zebrafish for high-throughput in vivo screening. These models aim to generate more human-relevant functional data earlier, improving go/no-go decisions and reducing dependency on slower, costlier mammalian models [18].
- Adaptive Trial Designs and Operational Efficiencies: To control soaring clinical trial costs, sponsors are adopting adaptive trial designs that allow for modification based on interim data, dropping ineffective arms earlier [17]. There is also a push for decentralized clinical trials (DCTs), which use telemedicine and local providers to improve patient recruitment and retention while reducing costs [16].
- Navigating the Patent Cliff and R&D Productivity Crisis: The industry faces a significant "patent cliff" where $350 billion in revenue is at risk from 2025-2029 due to drugs losing exclusivity [17]. Concurrently, R&D productivity is under strain, with the success rate for Phase I drugs falling to 6.7% in 2024 and the internal rate of return on R&D investment dropping to 4.1%, well below the cost of capital [17]. This pressures companies to adopt more data-driven, efficient R&D strategies to remain viable.
In the modern pharmaceutical research and development landscape, target identification and validation represent the critical foundational steps that initiate the entire drug discovery process. This phase focuses on pinpointing a biological molecule, typically a protein or nucleic acid, whose activity can be modulated by a therapeutic agent to produce a beneficial effect against a specific disease [19]. The strategic importance of this stage cannot be overstated; the selection of a poorly validated target is a primary contributor to the high failure rates in later, more costly clinical phases [19]. Consequently, the application of rigorous, multi-faceted methodologies for target identification and subsequent validation is essential for de-risking pipelines and enhancing the probability of translational success. This guide outlines the core principles, current methodologies, and strategic frameworks for target identification and validation, positioning them within the broader context of the drug discovery and development process.
The overarching goal is to establish a causal link between the target and the disease pathophysiology. This involves demonstrating that the target is biologically relevant, is accessible to a drug molecule, and that modulating its activity will lead to a therapeutic outcome with an acceptable safety margin. The contemporary approach to this challenge is increasingly integrated and system-based, moving beyond the traditional "one drug, one target" hypothesis to a more holistic understanding of poly-pharmacology and network biology [20]. This paradigm acknowledges that drugs often interact with multiple targets, and that efficacy—as well as side effects—can arise from complex interactions within biological networks.
Target Identification Strategies
Target identification is the process of discovering potential biological targets that play a key role in a disease pathway. This initial stage leverages a diverse toolkit of experimental and computational approaches to generate a list of candidate targets for further investigation.
Genomic and Proteomic Approaches
Genome-Wide Association Studies (GWAS) and functional genomics screens are powerful tools for uncovering novel target associations. GWAS analyses large cohorts of patient genomic data to identify genetic variants, such as Single Nucleotide Polymorphisms (SNPs), that are statistically associated with a disease. Genes located near or at these susceptibility loci become high-priority candidates for further functional validation. Complementarily, functional genomics utilizes tools like CRISPR-Cas9 screens to systematically knock out or knock down every gene in the genome within a disease-relevant cellular model. Genes whose perturbation significantly alters the disease phenotype—such as inhibiting cancer cell proliferation—are identified as potential therapeutic targets [21].
Proteomic analyses, including mass spectrometry-based methods, are used to profile protein expression, post-translational modifications, and protein-protein interactions in diseased versus healthy tissues. Proteins that are differentially expressed or activated (e.g., phosphorylated) in the disease state can indicate potential targets. Advanced mass spectrometry techniques are also being applied in novel validation assays, such as the Cellular Thermal Shift Assay (CETSA), to confirm direct drug-target engagement within a complex cellular environment [22].
Computational and Bioinformatic Approaches
Artificial Intelligence (AI) and machine learning (ML) have evolved from promising concepts to foundational capabilities in modern R&D [22]. In target identification, AI models can integrate vast and disparate datasets—including genomic, transcriptomic, proteomic, and clinical data—to identify and prioritize novel disease targets. These models can uncover complex, non-obvious patterns that are difficult to discern through traditional methods. For instance, AI can be used to deconvolute phenotypic screening hits to predict the protein target responsible for the observed phenotypic effect [22] [19].
Network pharmacology is a system-based approach that analyzes the complex interactions between drugs and multiple targets within a biological network. Instead of examining targets in isolation, it constructs a drug-target network or a chemical similarity network to understand the broader context of a target's function and its relationship to other proteins in the cell [20]. This approach is particularly valuable for understanding poly-pharmacology and predicting potential on-target and off-target effects early in the discovery process. By considering the network properties of a target, researchers can make more informed decisions about which candidates are likely to have a therapeutic effect with minimal side effects.
Table 1: Comparison of Major Target Identification Methods
| Method Category | Specific Techniques | Key Output | Relative Resource Requirement |
|---|---|---|---|
| Genomic/Genetic | GWAS, CRISPR-Cas9 Screens | Genetically validated candidate genes | High |
| Proteomic | Mass Spectrometry, Protein Arrays | Differentially expressed proteins and complexes | High |
| Computational/Bioinformatic | AI/ML, Network Analysis, In-silico Profiling | Prioritized target lists with poly-pharmacology assessment | Low to Medium |
| Ligand-Based | Chemical Similarity Search, Affinity Purification | Protein targets of bioactive small molecules | Medium |
Ligand-Based Identification
When a biologically active small molecule is known but its target is unknown, ligand-based approaches can be employed for target deconvolution. The chemical similarity principle, which states that structurally similar molecules often have similar biological activities, is a cornerstone of this approach [20]. Techniques such as similarity searching in chemical databases using molecular "fingerprints" can help identify known ligands with annotated targets, suggesting a potential target for the query molecule. More direct experimental methods include affinity chromatography, where the bioactive molecule is immobilized on a resin and used to "pull down" its binding partners from a complex protein mixture like a cell lysate. The bound proteins are then identified through mass spectrometry, revealing the direct physical interactors and potential molecular targets [21] [20].
Target Validation Strategies
Once candidate targets are identified, they must be rigorously validated to confirm their therapeutic relevance. Validation provides evidence that modulation of the target has a direct and desired impact on the disease phenotype.
Genetic Validation
Genetic manipulation is a direct method for establishing a causal relationship between a target and a disease.
- Gene Knockdown (RNAi) and Knockout (CRISPR-Cas9): These techniques reduce or eliminate the expression of the target gene in a disease-relevant cellular or animal model. If the loss of the target protein ameliorates the disease phenotype, it provides strong evidence for the target's validity. For example, knocking out an oncogene and observing inhibited tumor growth supports its role in cancer progression.
- Transgenic Overexpression: Conversely, overexpressing the target protein in a model system and observing whether it induces or exacerbates a disease-like phenotype provides another line of validation. This is particularly relevant for dominant-negative mutations or gain-of-function scenarios.
Pharmacological and Functional Validation
This approach uses pharmacological tools, such as small-molecule inhibitors or biologic agents, to modulate the target's activity.
- Tool Compounds: Using a known, high-quality chemical inhibitor or an antibody to block the target's function in a disease model can demonstrate therapeutic potential. The effects on disease-relevant biomarkers and phenotypic endpoints are measured. A key advancement in this area is the use of CETSA to confirm that the tool compound engages the intended target in a physiologically relevant cellular or tissue context, bridging the gap between biochemical potency and cellular efficacy [22].
- Biological Models: The use of physiologically relevant models is crucial. While simple in vitro cell lines are useful, more complex models like 3D organoids or in vivo models such as zebrafish offer whole-organism insights. Zebrafish, with their genetic similarity to humans and scalability, are especially valuable for high-content screening and early-stage efficacy and toxicity testing during validation [19].
Clinical and Biomarker Validation
Linking a target to human disease is a powerful form of validation. This involves:
- Analysis of Clinical Samples: Examining human tissue biopsies, blood samples, or other biofluids from patients to confirm that the target is dysregulated (e.g., overexpressed, mutated, or activated) in the disease state compared to healthy controls.
- Biomarker Development: Identifying and measuring a pharmacodynamic biomarker that reflects the target's activity. During validation, demonstrating that modulation of the target leads to a predictable change in the biomarker strengthens the biological rationale and can provide an early readout of target engagement for future clinical trials [21].
Table 2: Core Target Validation Techniques
| Validation Method | Experimental Approach | Evidence Generated | Key Advantage |
|---|---|---|---|
| Genetic Validation | CRISPR-Cas9 Knockout/Knockin, RNAi, Transgenic Models | Causal link between target and disease phenotype | High mechanistic clarity |
| Pharmacological Validation | Tool Compounds (Inhibitors/Antibodies), CETSA for binding confirmation | Functional relevance with pharmacologically relevant modulation | Directly tests drug-like intervention |
| Biomarker & Clinical Correlation | Analysis of patient tissues/samples, Biomarker quantification | Relevance of target to human disease pathophysiology | Strongest translational relevance |
| Animal Disease Models | Rodent, zebrafish models of human disease | Efficacy and phenotypic effect in a whole organism | Provides systemic, in vivo context |
Experimental Workflows and Protocols
This section details specific methodologies for key validation experiments, providing a technical reference for researchers.
Workflow for Genetic Validation Using CRISPR-Cas9
The following diagram illustrates the key steps in a CRISPR-Cas9 knockout workflow for target validation.
Detailed Protocol: CRISPR-Cas9 Mediated Gene Knockout
- gRNA Design and Cloning: Design a single-guide RNA (sgRNA) sequence (typically 20 nt) targeting an early exon of the target gene. Clone the sgRNA sequence into a CRISPR plasmid vector that also expresses the Cas9 nuclease and a selectable marker (e.g., puromycin resistance).
- Cell Transfection: Transfect the constructed plasmid into a disease-relevant cell line using an appropriate method (e.g., lipofection, electroporation).
- Selection and Cloning: 48 hours post-transfection, add puromycin to the culture medium to select for successfully transfected cells. Maintain selection for 3-5 days. After selection, dissociate the cells and seed them at a very low density to allow for the growth of single-cell-derived colonies.
- Screening for Knockout: Pick individual colonies and expand them. Extract genomic DNA from each clone and perform a surveyor nuclease assay or T7 Endonuclease I assay to detect indel mutations at the target site. Confirm the knockout in positive clones by Sanger sequencing of the PCR-amplified genomic region and by western blot to check for loss of protein expression.
- Functional Assay: Compare the phenotypic behavior of the knockout clones with that of the control (non-targeting gRNA) cells in disease-relevant functional assays. These may include:
- Cell Proliferation Assay (e.g., MTT or CellTiter-Glo)
- Cell Migration/Invasion Assay (e.g., Transwell assay)
- Apoptosis Assay (e.g., Annexin V staining by flow cytometry)
- Transcriptomic or Proteomic Analysis to observe downstream effects.
Workflow for Pharmacological Validation with CETSA
The following diagram outlines the process of using CETSA to confirm target engagement of a tool compound in cells.
Detailed Protocol: Cellular Thermal Shift Assay (CETSA)
- Compound Treatment: Aliquot two sets of intact cells (e.g., in suspension or culture). Treat one set with the tool compound and the other with vehicle control (e.g., DMSO). Incubate for a predetermined time (e.g., 1 hour) to allow for compound-target engagement.
- Heating: Divide each aliquot into smaller tubes and heat each at different temperatures (e.g., a gradient from 40°C to 65°C) for a fixed time (e.g., 3 minutes) in a thermal cycler.
- Cell Lysis and Separation: Immediately after heating, lyse the cells using freeze-thaw cycles or a detergent-based lysis buffer. Centrifuge the lysates at high speed (e.g., 20,000 x g) to separate the soluble (non-denatured) protein from the insoluble (aggregated) protein.
- Protein Quantification: Collect the soluble protein fraction from each temperature point. Quantify the amount of the target protein remaining in the soluble fraction using a specific detection method. Western Blotting is common for individual proteins, while high-resolution mass spectrometry can be used for proteome-wide studies of engagement [22].
- Data Analysis: Plot the fraction of soluble target protein remaining against the temperature. A rightward shift in the melting curve (increased thermal stability) for the compound-treated sample compared to the control indicates stabilization of the target protein due to direct ligand binding, thus confirming target engagement.
The Scientist's Toolkit: Key Research Reagents
The following table details essential materials and reagents used in the featured target validation experiments.
Table 3: Research Reagent Solutions for Target Validation
| Reagent / Material | Function in Experiment | Specific Example |
|---|---|---|
| CRISPR-Cas9 Plasmid | Delivers the gene-editing machinery (gRNA and Cas9 nuclease) into the cell. | lentiCRISPR v2 vector |
| Cell Culture Media & Reagents | Supports the growth and maintenance of the cellular models used for validation. | DMEM, Fetal Bovine Serum (FBS), Trypsin-EDTA |
| Selection Antibiotic | Selects for cells that have successfully incorporated the CRISPR plasmid or other genetic constructs. | Puromycin, Geneticin (G418) |
| Tool Compound / Inhibitor | A high-quality chemical probe used to pharmacologically modulate the target's activity. | A well-characterized, potent, and selective small-molecule inhibitor. |
| CETSA Lysis Buffer | Lyses cells after heat treatment while preserving the stability of non-aggregated proteins. | Buffer containing PBS, protease inhibitors, and 0.4% NP-40 detergent. |
| Antibodies for Detection | Specifically detects the target protein in validation assays such as Western Blot or immunofluorescence. | Validated primary antibody against the target; HRP-conjugated secondary antibody. |
| qPCR Assays | Quantifies changes in gene expression levels of the target or downstream genes. | TaqMan Gene Expression Assays. |
| Zebrafish Model | Provides a whole-organism, in vivo system for high-content efficacy and toxicity testing. | Wild-type or transgenic zebrafish embryos. |
Target identification and validation are the cornerstones of a successful drug discovery campaign. A strategic, multi-pronged approach that integrates genetic, pharmacological, and clinical evidence is paramount for building confidence in a target's therapeutic potential before committing significant resources to lead compound development. The field is being transformed by the adoption of system-based approaches like network pharmacology and the integration of advanced AI/ML models for target prediction and prioritization [22] [20]. Furthermore, the routine deployment of functionally relevant assays, such as CETSA for direct target engagement, is closing the critical gap between biochemical activity and physiological effect [22]. By adhering to these rigorous principles and leveraging the latest technologies, researchers can effectively initiate the drug discovery journey, laying a robust foundation for developing the innovative medicines of tomorrow.
The journey from identifying a potential drug candidate to developing a viable lead compound is a critical, multi-stage process in pharmaceutical research. This pathway, foundational to the basic principles of drug discovery and development, typically follows a structured sequence: Target Validation (TV) → Assay Development → High-Throughput Screening (HTS) → Hit to Lead (H2L) → Lead Optimization (LO) → Preclinical Development → Clinical Development [23]. The "hit-to-lead" phase serves as the essential bridge, where small molecule hits discovered from an initial broad screen are evaluated and undergo limited optimization to identify promising lead compounds worthy of further investment [24] [23]. This stage is crucial for de-risking projects early, as only one in about 5,000 compounds that enter preclinical development ever becomes an approved drug [23].
The Hit-to-Lead (H2L) Stage: Objectives and Workflow
Core Objectives of Hit-to-Lead
The primary objective of the hit-to-lead phase is to rapidly assess several hit clusters to identify the two or three hit series with the best potential to develop into drug-like leads [25]. This involves confirming a true structure-activity relationship (SAR) and conducting an early assessment of in-vitro ADMET (Absorption, Distribution, Metabolism, Excretion, and Toxicity) properties to select the most promising candidates for full-scale optimization [25]. A typical hit-to-lead project spans six to nine months [25].
The process starts with initial "hits" – compounds identified from a High-Throughput Screen (HTS) that show activity against a biological target. These hits typically display binding affinities in the micromolar range (10⁻⁶ M). Through the H2L process, the affinities of the most promising hits are often improved by several orders of magnitude to the nanomolar range (10⁻⁹ M) [23].
The Hit-to-Lead Workflow
The transition from hit to lead is a systematic workflow involving hit confirmation, expansion, and early profiling. The following diagram illustrates the key stages and decision points.
Experimental Protocols for Hit Confirmation and Validation
After identifying hits from an HTS, the first critical step is hit confirmation to ensure that the initial activity is reproducible and not an artifact of the screening process [23]. The following table summarizes the quantitative criteria and objectives for this phase.
Table 1: Key Experiments in Hit Confirmation and Characterization
| Experiment Type | Key Measured Parameters | Primary Objective | Typical Assay Formats/Technologies |
|---|---|---|---|
| Confirmatory Testing | Percent inhibition/activation at a single concentration [23] | Confirm reproducibility of primary HTS activity using the same assay conditions [23] | Biochemical assays (e.g., fluorescence polarization, TR-FRET) [24] |
| Dose-Response Curve | IC₅₀ (half-maximal inhibitory concentration) or EC₅₀ (half-maximal effective concentration) [23] | Determine compound potency over a range of concentrations [23] | Cell-free enzymatic assays; cell-based functional assays [24] [23] |
| Orthogonal Testing | Activity/affinity using a different readout [23] | Validate activity using a different assay technology or one closer to physiological conditions [23] | Binding assays (SPR, ITC), cellular reporter gene assays [24] [23] |
| Secondary Screening | Efficacy in a functional cellular assay [23] | Determine if compound activity translates to a cellular environment [23] | Cell proliferation, cytotoxicity, signal transduction modulation [24] |
| Biophysical Testing | Binding affinity (Kd), kinetics, stoichiometry, conformational change [23] | Confirm direct target binding and rule out promiscuous or non-specific binding [23] | NMR, SPR, ITC, DLS, MST [23] |
Detailed Protocol: Biochemical Potency and Selectivity Assay
This protocol is typical for characterizing hits against an enzyme target, such as a kinase.
- Objective: Determine the potency (IC₅₀) and selectivity of confirmed hits.
- Assay Principle: A homogeneous, mix-and-read biochemical assay measuring enzyme activity, often using a detection method like fluorescence polarization (FP) or time-resolved FRET (TR-FRET) to monitor substrate conversion [24].
- Reagents:
- Purified recombinant target enzyme.
- Test compounds (hits) in DMSO.
- Enzyme substrate and any co-factors (e.g., ATP for kinases).
- Detection reagent (e.g., antibody-coupled fluorophore for TR-FRET).
- Assay buffer.
- Procedure: a. Compound Dilution: Prepare a 3-fold serial dilution of the test compound in DMSO, typically starting from 10 µM. Include a control compound and a DMSO-only vehicle control. b. Assay Plate Setup: In a low-volume 384-well plate, transfer 50 nL of each compound dilution (in duplicate) to the assay wells using an acoustic dispenser or pin tool. c. Reaction Mixture Addition: Add the enzyme and substrate in assay buffer to each well. The final reaction volume is 10 µL, and the final DMSO concentration is 0.5%. d. Incubation: Seal the plate and incubate at room temperature for 60 minutes to allow the enzymatic reaction to proceed. e. Detection: Add the detection reagent (e.g., EDTA and detection antibodies for a TR-FRET kinase assay) and incubate for a further 30 minutes. f. Readout: Measure the signal (e.g., TR-FRET ratio) using a compatible plate reader.
- Data Analysis:
- Calculate percent inhibition for each well relative to positive (100% inhibition) and negative (0% inhibition) controls.
- Plot percent inhibition versus the log₁₀ of compound concentration.
- Fit the data to a 4-parameter logistic model to calculate the IC₅₀ value.
Detailed Protocol: Cellular Efficacy Assay
- Objective: Evaluate the functional activity and cytotoxicity of hits in a relevant cell line.
- Assay Principle: A cell-based assay measuring a downstream phenotypic effect, such as reporter gene expression, pathway modulation (e.g., phosphorylation via ELISA), or cell viability [24].
- Reagents:
- Cell line expressing the target of interest (native or engineered).
- Test compounds.
- Cell culture media and reagents.
- Assay detection kits (e.g., luciferase for reporter gene, CellTiter-Glo for viability).
- Procedure: a. Cell Seeding: Seed cells into a 96-well cell culture plate at an optimized density and culture for 24 hours. b. Compound Treatment: Treat cells with the test compounds across a concentration range (e.g., 0.1 nM to 10 µM) for a predetermined time (e.g., 6-24 hours). c. Cell Lysis and Detection: Lyse cells and add the assay detection reagent according to the manufacturer's instructions. d. Readout: Measure luminescence or fluorescence on a plate reader.
- Data Analysis:
- Normalize signals to vehicle control (0% effect) and a control inhibitor (100% effect).
- Calculate EC₅₀ or IC₅₀ values from the dose-response curve.
Hit Expansion and Early Lead Profiling
Following confirmation, several hit clusters are selected for hit expansion. The goal is to explore the structure-activity relationship (SAR) and assess developability by profiling a wider set of analogs against key criteria [23]. An ideal compound cluster at this stage possesses the properties outlined in the table below.
Table 2: Key Profiling Criteria During Hit Expansion
| Property Category | Specific Parameter | Ideal or Target Profile |
|---|---|---|
| Potency & Efficacy | Target Affinity | < 1 µM [23] |
| Cellular Efficacy | Significant activity in a cellular assay [23] | |
| Selectivity & Safety | Selectivity vs. other targets | Demonstrated specificity [23] |
| Cytotoxicity | Low [23] | |
| Interference with CYP450s & P-gp | Low to moderate binding [23] | |
| Drug-Like Properties | Lipophilicity (ClogP) | Moderate [23] |
| Metabolic Stability | Sufficient stability for in vivo testing [23] | |
| Permeability | High cell membrane permeability [23] | |
| Solubility | > 10 µM [23] | |
| Developability | Synthetic Tractability | Feasible synthesis and potential for up-scaling [23] |
| Patentability | Freedom to operate [23] |
Project teams typically select between three and six compound series for further exploration [23]. Analogs for testing are sourced from internal libraries, purchased commercially ("SAR by catalog"), or synthesized de novo by medicinal chemists [23].
The Scientist's Toolkit: Key Research Reagent Solutions
The following table details essential reagents, tools, and technologies used throughout the hit-to-lead process.
Table 3: Essential Research Reagents and Tools for Hit-to-Lead
| Tool / Reagent Category | Specific Examples | Primary Function in H2L |
|---|---|---|
| Biochemical Assay Technologies | Transcreener Assays [24], Fluorescence Polarization (FP), TR-FRET, AlphaScreen/AlphaLISA | Measure direct interaction with and modulation of the molecular target in a cell-free system [24]. |
| Cell-Based Assay Systems | Reporter gene assays, primary cell models, engineered cell lines. | Evaluate compound effects in a physiologically relevant cellular environment, measuring functional efficacy [24] [23]. |
| Biophysical Characterization Instruments | Surface Plasmon Resonance (SPR), Isothermal Titration Calorimetry (ITC), Nuclear Magnetic Resonance (NMR) [23]. | Confirm binding stoichiometry, affinity (Kd), and kinetics; rule out non-specific aggregation [23]. |
| In-vitro ADME/PK Assays | Metabolic stability (e.g., liver microsomes), Caco-2 permeability, plasma protein binding, cytochrome P450 inhibition [25]. | Early assessment of absorption, distribution, and metabolism properties to predict in vivo pharmacokinetics [25] [23]. |
| Chemical Informatics & AI Tools | In-silico profiling software [25], Machine Learning Potentials (MLPs) like QDπ dataset [26], Generative AI models [27]. | Predict molecular properties, guide synthetic strategy, design novel compounds, and analyze SAR [25] [26] [27]. |
| Compound Libraries | Internal HTS libraries, commercially available compound sets. | Source of analogs for "SAR by catalog" to rapidly explore structure-activity relationships during hit expansion [23]. |
The Screening Cascade: An Integrated View
A successful hit-to-lead campaign relies on an efficient screening cascade that integrates various assay types to triage and prioritize compounds. The following diagram visualizes this multi-tiered filtering process.
The hit-to-lead phase is a cornerstone of modern drug discovery, serving as a critical filter and foundation for all subsequent development stages [24]. By employing a rigorous, multi-parametric approach that balances potency, selectivity, and developability, researchers can de-risk programs and select the most promising lead series for the resource-intensive lead optimization stage. The integration of advanced technologies, including high-throughput chemistry, predictive in-silico tools, and sophisticated biochemical and cellular profiling, continues to enhance the efficiency and success of this pivotal transition from candidate to viable compound [24] [25] [27].
Preclinical research serves as the critical foundation of the entire drug discovery and development pipeline, providing the initial assessment of a compound's safety and biological activity before human testing can commence. This stage employs a combination of in vitro (in glass) and in vivo (within the living) studies to evaluate promising drug candidates, ensuring that only the safest and most effective compounds advance to clinical trials [28]. The primary objectives of preclinical research include identifying a lead drug candidate, establishing its pharmacological profile, determining initial safety parameters, and developing a suitable formulation for administration [28]. These studies must comply with strict regulatory guidelines dictated by Good Laboratory Practice (GLP) to ensure reliable and reproducible results that regulatory bodies like the FDA and EMA will accept [28].
The strategic importance of preclinical development continues to evolve with the integration of Model-informed Drug Development (MIDD) approaches. MIDD provides a quantitative framework that uses modeling and simulation to support various drug development decisions, including predicting human pharmacokinetics, optimizing study designs, and interpreting complex exposure-response relationships [29]. By implementing a "fit-for-purpose" strategy that aligns modeling tools with specific development questions, researchers can significantly enhance the efficiency and success rate of the preclinical to clinical transition [29].
Phases of Preclinical Research
Preclinical research is a multi-stage process that systematically transitions from basic scientific discovery to comprehensive safety assessment. The following table outlines the four primary phases of preclinical research, their key activities, and primary outputs [28]:
| Phase | Primary Focus | Key Activities | Output/Deliverable |
|---|---|---|---|
| Phase 1: Basic Research | Understanding disease biology and identifying intervention points. | - Disease mechanism studies- Identification of drug targets (e.g., proteins, genes)- Target validation via genetic studies and biochemical assays. | A validated biological target implicated in a disease process. |
| Phase 2: Drug Discovery & Candidate Nomination | Finding/designing molecules that effectively interact with the validated target. | - High-throughput screening of compound libraries- Testing in cellular disease models (in vitro)- Initial assessment of potency and selectivity. | A "hit" compound with desired biological activity against the target. |
| Phase 3: Lead Optimization | Refining the chemical structure of "hit" compounds to improve drug-like properties. | - Chemical modification of leads- In vivo testing in animal models- Gathering data on safe/effective dosing.- Preliminary ADME (Absorption, Distribution, Metabolism, Excretion) and toxicity studies. | An optimized "lead" drug candidate with supporting efficacy and preliminary safety data. |
| Phase 4: IND-Enabling Studies | Conducting advanced safety and manufacturing studies required for regulatory approval to test in humans. | - Formal GLP safety and toxicology studies- Genetic toxicology assessment- Safety pharmacology- GMP manufacture of drug substance and product. | An Investigational New Drug (IND) application submitted to regulators. |
The entire preclinical process can take several months to a few years to complete, depending on the complexity of the drug candidate and the specific requirements of regulatory authorities [28]. The culmination of this rigorous process is the submission of an Investigational New Drug (IND) application to regulatory bodies such as the U.S. Food and Drug Administration (FDA). The IND application includes all data generated from the preclinical studies, along with details on drug manufacturing and proposed plans for clinical trials in humans [28].
Methodological Approaches: In Vitro vs. In Vivo
Preclinical research relies on two complementary methodological paradigms: in vitro and in vivo studies. Each approach offers distinct advantages and addresses different research questions throughout the drug development pipeline. The following table provides a detailed comparison of these core methodologies [30]:
| Aspect | In Vitro | In Vivo |
|---|---|---|
| Definition | Experiments performed in a controlled laboratory environment outside of a living organism (e.g., in glass test tubes or petri dishes). | Experiments conducted inside a living body, such as in animal models (e.g., rodents) or humans. |
| Environment | Controlled and simplified, allowing for the isolation of specific biological components. | Complex and natural, involving the entire living system with all its inherent biological interactions. |
| Primary Advantages | - Faster and more cost-effective- High precision; allows manipulation of single variables- Enables detailed study of cells and mechanisms- Avoids ethical concerns of animal testing. | - Shows real-life interactions within a whole organism- Reveals systemic effects (e.g., on different organs)- Provides data on complex processes like ADME. |
| Key Limitations | - Cannot replicate the full complexity of a living system- Results may not fully predict effects in a whole organism. | - More expensive and time-consuming- Raises ethical considerations for animal use- Can be riskier due to the use of live subjects. |
| Common Applications | - Initial drug screening on cell lines- Mechanism of Action (MoA) studies- Cellular toxicity and efficacy assays.- In vitro fertilization (IVF). | - Animal studies (e.g., in rats) to understand drug effects in a living system- Clinical trials in humans- Testing complex drug effects and toxicity profiles. |
| Data Output Examples | - IC50/EC50 values (potency)- Cell viability and proliferation rates- Target engagement and binding affinity. | - Maximum Tolerated Dose (MTD)- Pharmacokinetic parameters (e.g., half-life, bioavailability)- Overall survival or disease progression in a model organism. |
Experimental Protocols and Key Assays
Essential In Vitro Assays
- Target Identification and Validation: This initial protocol involves using genetic studies (e.g., CRISPR, RNAi), biochemical assays, and animal models to gather evidence confirming that modulating a specific biological target (e.g., a protein or gene) produces a desired therapeutic effect [28].
- High-Throughput Screening (HTS): An automated process where libraries of thousands to millions of compounds are tested for activity against a validated target in cellular or biochemical assays. "Hits" are compounds that show the desired biological activity [28].
- Cell-Based Efficacy and Toxicity Assays: These protocols determine a compound's biological effect (pharmacodynamics) and potential for harm. Examples include:
- MTT/XTT Assay: Measures cell metabolic activity as a proxy for viability and proliferation.
- Flow Cytometry Apoptosis Assay: Quantifies programmed cell death using Annexin V/propidium iodide staining.
- High-Content Imaging: Uses automated microscopy to analyze complex phenotypic changes in cells.
Essential In Vivo Studies
- Pharmacokinetic (PK) Studies: These studies describe how the body affects a drug over time, focusing on ADME. A single dose of the drug is administered to animal models (e.g., rodents), and blood samples are collected at multiple time points. Analysis of drug concentration in plasma determines key PK parameters like half-life (t½), maximum concentration (Cmax), and area under the curve (AUC) [28].
- Safety and Toxicology Studies: These IND-enabling studies are conducted under GLP guidelines to identify potential adverse effects. They involve:
- Repeat-Dose Toxicity Studies: Administering the drug daily for a set duration (e.g., 14 days, 28 days) to determine target organ toxicity and establish a No Observed Adverse Effect Level (NOAEL).
- Safety Pharmacology Core Battery: Assessing effects on vital organ systems, including cardiovascular (e.g., telemetry in dogs), central nervous (e.g., Irwin test), and respiratory systems.
- Genetic Toxicology Studies: Evaluating the drug's potential to cause DNA damage (e.g., Ames test, in vitro micronucleus test).
The Scientist's Toolkit: Key Research Reagent Solutions
Successful preclinical research relies on a suite of specialized reagents and tools. The table below details essential materials and their critical functions in the preclinical workflow [28]:
| Tool/Category | Specific Examples | Function in Preclinical Research |
|---|---|---|
| Cell-Based Assays | Immortalized cell lines, Primary cells, Co-culture systems, 3D organoids. | Provide a controlled in vitro system for initial compound screening, mechanistic studies, and preliminary toxicity assessment. |
| Animal Models | Rodents (mice, rats), Non-human primates, Canines, Genetically engineered models (GEM). | Serve as in vivo systems to study complex pharmacology, efficacy in a whole organism, and systemic toxicity before human trials. |
| Bioanalytical Methodologies | Liquid Chromatography-Mass Spectrometry (LC-MS), Enzyme-Linked Immunosorbent Assay (ELISA). | Used for quantifying drug concentrations (PK studies) and biomarkers in biological samples (e.g., plasma, tissue). |
| Imaging & Visualization | High-Content Screening (HCS) systems, Confocal microscopy, In vivo imaging (e.g., IVIS). | Enables visualization and quantification of cellular responses, target engagement, and disease progression in live animals. |
| Computational Models | Quantitative Structure-Activity Relationship (QSAR), PBPK (Physiologically Based PK) modeling. | In silico tools used to predict compound properties, optimize chemical structures, and simulate human pharmacokinetics. |
Integrated Workflows and Visual Guide
The transition from a biological target to an IND candidate is a logical, sequential process that integrates both in vitro and in vivo data. The following workflow diagrams illustrate this critical path.
Preclinical Drug Development Workflow
In Vitro and In Vivo Interaction
Preclinical research, with its strategic integration of in vitro and in vivo methodologies, remains the indispensable gateway to clinical trials and the development of new therapeutics. The rigorous, phase-appropriate application of these studies—from basic target validation to comprehensive IND-enabling packages—ensures that drug candidates entering human testing have a scientifically sound basis for both expected efficacy and manageable risk [28] [30]. The continued evolution of this field, particularly through the adoption of MIDD approaches and sophisticated in silico tools, promises to enhance the predictive power of preclinical models, further de-risking drug development and accelerating the delivery of innovative treatments to patients in need [29].
Methodological Revolution: How AI and Novel Technologies are Reshaping R&D
The traditional drug discovery paradigm faces formidable challenges characterized by lengthy development cycles, prohibitive costs, and high preclinical trial failure rates. The process from lead compound identification to regulatory approval typically spans over 12 years with cumulative expenditures exceeding $2.5 billion, while clinical trial success probabilities decline precipitously from Phase I (52%) to Phase II (28.9%), culminating in an overall success rate of merely 8.1% [31]. Artificial intelligence (AI) has been extensively incorporated into various phases of drug discovery and development to address these persistent inefficiencies. AI enables researchers to effectively extract molecular structural features, perform in-depth analysis of drug-target interactions, and systematically model the relationships among drugs, targets, and diseases [31]. These approaches improve prediction accuracy, accelerate discovery timelines, reduce costs from trial and-error methods, and enhance success probabilities, establishing AI as a foundational platform in modern pharmaceutical research and development.
AI-Driven Target Prediction and Identification
Selecting the correct biological target is arguably the most critical decision in drug discovery, as an incorrect target early on often leads to failure in late-stage trials [32]. AI enhances target discovery by integrating diverse data sources to uncover hidden patterns and novel therapeutic hypotheses that would be missed by traditional approaches.
Methodologies and Experimental Protocols
Data Integration and Multi-Omics Analysis: AI-driven target identification platforms mine genomic, proteomic, transcriptomic, and literature data to identify novel druggable targets [32]. For example, Insilico Medicine's PandaOmics platform combines patient multi-omics data (genomic and transcriptomic), network analysis, and natural-language mining of scientific literature to rank potential drug targets [32]. The experimental protocol involves:
- Data Collection: Aggregate multi-omics data from public repositories (e.g., TCGA, GEO), proprietary datasets, and real-world evidence.
- Natural Language Processing: Implement bidirectional encoder representations from transformers (BERT) models to mine scientific literature, clinical trial records, and patent databases for target-disease associations.
- Network Analysis: Construct protein-protein interaction networks and disease association networks using graph neural networks (GNNs) to identify central nodes representing potential targets.
- Target Prioritization: Apply ensemble machine learning models to generate composite scores based on novelty, druggability, safety, and biological evidence to rank potential targets [32].
Phenotypic Screening Integration: Companies like Recursion Pharmaceuticals fuse high-content cell imaging with single-cell genomics, generating and analyzing cellular and genetic data at massive scale to build maps of human biology that reveal new druggable pathways [32]. Their "Operating System" uses massive image-and-omics datasets to continuously train machine learning models, creating an iterative loop of experiment and design [32].
Case Study: TNIK Discovery for Idiopathic Pulmonary Fibrosis
A representative example of AI-driven target identification is the discovery of TNIK as a novel target for idiopathic pulmonary fibrosis (IPF). Insilico Medicine's AI platform identified TNIK—a kinase not previously studied in IPF—as the top prediction through its multi-omics and literature mining pipeline [32]. This novel target is now being explored further, demonstrating how AI can spotlight therapeutic hypotheses that would have been missed by traditional approaches [32].
Figure 1: AI-driven target identification integrates diverse data sources to prioritize novel therapeutic targets.
AI-Enhanced Virtual Screening
Virtual screening represents one of the most established applications of AI in drug discovery, enabling researchers to efficiently explore ultra-large chemical libraries that would be infeasible to screen experimentally [32].
Technical Approaches and Implementation
Deep Learning for Molecular Property Prediction: Modern AI-based virtual screening employs deep learning architectures to forecast molecular properties including target binding affinity, selectivity, and preliminary ADMET (absorption, distribution, metabolism, excretion, toxicity) characteristics [31]. Key methodological approaches include:
- Molecular Representation: Convert chemical structures into machine-readable formats using extended-connectivity fingerprints (ECFPs), SMILES-based representations, or graph-based representations where atoms are nodes and bonds are edges.
- Model Architecture: Implement convolutional neural networks (CNNs) for spatial feature extraction, graph neural networks (GNNs) for molecular graph analysis, or transformer-based architectures for sequence-based molecular representations.
- Training Protocol: Utilize transfer learning from large-scale molecular databases (e.g., ChEMBL, ZINC) followed by fine-tuning on target-specific data. Apply multi-task learning to simultaneously predict multiple properties including binding affinity, solubility, and toxicity.
- Screening Execution: Deploy trained models to score and rank compounds from ultra-large virtual libraries (containing 10^8-10^12 compounds), prioritizing the top candidates for experimental validation [32].
Generative Molecular Design: Advanced generative algorithms including transformers, generative adversarial networks (GANs), and reinforcement learning can propose entirely new chemical structures optimized against a desired target [31]. For example, Insilico Medicine's Chemistry42 engine employs 500 machine learning models to generate and score millions of compounds [32].
Performance Metrics and Comparative Analysis
AI-driven virtual screening has demonstrated significant improvements over traditional methods. Deep-learning virtual screening and machine learning-enhanced scoring often outperform classical QSAR and molecular docking approaches [32]. Neural network models can incorporate predicted 3D structures (e.g., AlphaFold predictions) to refine binding site analysis, further enhancing prediction accuracy [32].
Table 1: AI-Enhanced Virtual Screening Approaches and Applications
| Screening Approach | AI Methodology | Library Size | Reported Efficiency Gains | Key Applications |
|---|---|---|---|---|
| Deep Learning QSAR | Convolutional Neural Networks (CNNs) | 10^6-10^9 compounds | >30% hit rate improvement | Kinase inhibitors, GPCR targets |
| Graph-Based Screening | Graph Neural Networks (GNNs) | 10^8-10^10 compounds | 50-100% enrichment over docking | Protein-protein interaction inhibitors |
| Generative Screening | Transformer Models, GANs | De novo design | 70% faster design cycles [33] | Novel scaffold discovery, difficult targets |
| Structure-Based DL | 3D Convolutional Networks | 10^7-10^11 compounds | Superior to classical scoring functions | Utilizing AlphaFold structures |
AI-Optimized Lead Optimization
After initial hit identification, AI significantly streamlines the lead optimization phase by predicting how chemical modifications will affect multiple properties simultaneously, enabling more informed decision-making and reducing the number of synthetic cycles required.
Multi-Objective Optimization Framework
Lead optimization requires balancing multiple, often competing, objectives including potency, selectivity, pharmacokinetics, and safety profiles. AI approaches this challenge through:
Predictive ADMET Modeling: Machine learning models trained on large chemical and biological datasets can predict absorption, distribution, metabolism, excretion, and toxicity (ADMET) properties in silico, flagging likely issues before costly animal studies [31]. Key protocol steps include:
- Data Curation: Collect high-quality experimental data for key ADMET endpoints (e.g., hepatic clearance, plasma protein binding, hERG inhibition, metabolic stability).
- Feature Engineering: Calculate molecular descriptors (e.g., molecular weight, logP, topological surface area) or use learned representations from deep learning models.
- Model Training: Implement ensemble methods (random forests, gradient boosting) or deep neural networks to predict ADMET properties from chemical structure.
- Validation: Use temporal validation or external test sets to evaluate model performance and ensure generalizability [31].
Reinforcement Learning for Molecular Optimization: Reinforcement learning optimizes molecular design via Markov decision processes, where agents iteratively refine policies to generate inhibitors and balance pharmacokinetic properties through reward-driven strategies [31]. The molecular structure is modified through a series of chemically valid actions, with rewards based on predicted improvements in multiple properties.
Case Study: AI-Accelerated Lead Optimization
Industry leaders have demonstrated significant efficiency gains through AI-driven lead optimization. Exscientia reports in silico design cycles approximately 70% faster and requiring 10× fewer synthesized compounds than industry norms [33]. In one program examining a CDK7 inhibitor, the company achieved a clinical candidate after synthesizing only 136 compounds, whereas traditional programs often require thousands [33]. Similarly, Recursion claims "significant improvements in speed, efficiency, and reduced costs from hit identification to IND-enabling studies" compared to industry norms [32].
Figure 2: The iterative AI-driven lead optimization cycle integrates design, synthesis, testing, and machine learning.
Table 2: AI Models for Lead Optimization and Their Applications
| Optimization Parameter | AI Model Type | Key Features | Impact on Development |
|---|---|---|---|
| Potency & Selectivity | Multi-task Neural Networks | Simultaneous prediction of multiple targets | Reduces off-target effects early |
| Metabolic Stability | Gradient Boosting Machines (XGBoost) | Interpretable feature importance | Decreases late-stage attrition due to PK issues |
| Toxicity Prediction | Graph Neural Networks (GNNs) | Structure-based toxicity alerts | Identifies toxicophores before synthesis |
| Solubility & Permeability | Support Vector Regression (SVR) | Non-linear relationships with descriptors | Improves biopharmaceutical properties |
| Synthetic Accessibility | Reinforcement Learning | Reward function based on synthetic complexity | Ensures proposed compounds are makeable |
Successful implementation of AI in drug discovery requires both computational tools and experimental systems for validation. Below are key resources constituting the modern AI-driven drug discovery toolkit.
Table 3: Research Reagent Solutions for AI-Driven Drug Discovery
| Resource Category | Specific Tools/Platforms | Function | Representative Examples |
|---|---|---|---|
| AI Software Platforms | Chemistry42, PandaOmics | de novo molecule design, target identification | Insilico Medicine [31] [32] |
| Data Resources | Public molecular databases, proprietary datasets | Model training and validation | ChEMBL, ZINC, corporate data lakes |
| Computational Infrastructure | Cloud-based SaaS platforms, HPC | Running resource-intensive AI models | Axtria DataMAX [34] |
| Validation Assays | High-throughput screening, phenotypic assays | Experimental confirmation of AI predictions | Recursion's phenomics platform [33] |
| ADMET Prediction Tools | In silico prediction suites | Early property optimization | Deep-learning ADMET models [31] |
AI has evolved from a theoretical promise to a tangible force in drug discovery, driving dozens of new drug candidates into clinical trials by 2025 [33]. The technology demonstrates concrete value in compressing development timelines, with multiple AI-derived small-molecule drug candidates reaching Phase I trials in a fraction of the typical 5+ years needed for traditional discovery and preclinical work [33]. As the field progresses, the integration of predictive, generative, and interpretable models represents the next frontier—creating AI systems that can not only predict whether a molecule will reach a target and generate a molecule to bind that target, but also explain how they interact [32]. This integrated approach promises to recast hit-finding and lead optimization as continuous, data-driven processes rather than lengthy trial-and-error campaigns, firmly establishing AI as a foundational platform that will continue to transform pharmaceutical research and development.
The integration of in silico screening and deep learning represents a paradigm shift in pharmaceutical research, directly addressing the unsustainable costs and high failure rates of traditional drug discovery. This whitepaper provides a technical examination of how these computational approaches are revolutionizing two critical phases: initial hit identification and the prediction of absorption, distribution, metabolism, excretion, and toxicity (ADMET) properties. By enabling a "predict-then-make" framework, these technologies mitigate the reliance on serendipity and brute-force screening, offering a more rational, data-driven path to clinical success. This document details core methodologies, presents quantitative performance data, outlines experimental protocols, and visualizes key workflows, serving as a guide for researchers aiming to implement these transformative tools.
The traditional drug development pipeline is characterized by a stark economic and temporal burden, often requiring over 12 years and more than $2.23 billion to bring a single new medicine to market [35] [31]. This crisis, known as Eroom's Law (the inverse of Moore's Law), describes the decades-long decline in R&D efficiency despite technological advances [35]. A primary contributor to this inefficiency is the staggering attrition rate, with poor pharmacokinetics and unforeseen toxicity accounting for a significant proportion of clinical-stage failures [36]. Historically, ADMET properties were assessed late in the process through labor-intensive experimental assays, leading to the costly termination of candidates that were optimized primarily for potency [36].
The fusion of artificial intelligence (AI) with computational chemistry is rewriting this narrative [37]. Machine learning (ML) and deep learning (DL) are catalyzing a shift from a linear, physical screening-based process to an iterative, predictive, and intelligent cycle. This in silico paradigm allows for the high-throughput virtual screening of vast chemical libraries and the de novo design of molecules with optimized drug-like properties before synthesis [35]. By front-loading ADMET prediction and enhancing hit identification, these approaches significantly de-risk development and accelerate timelines, offering a sustainable path forward for pharmaceutical innovation [37] [36].
Core AI Technologies in Drug Discovery
A range of AI methodologies underpins modern in silico discovery platforms. Their application is tailored to the specific nature of the data and the prediction task at hand.
- Supervised Learning: The workhorse for predictive modeling, it uses labeled datasets to train algorithms for classification (e.g., active vs. inactive) and regression (e.g., predicting binding affinity values). Key algorithms include Support Vector Machines (SVMs) and Random Forests (RFs) [31].
- Unsupervised Learning: This approach identifies hidden patterns and structures within unlabeled data, useful for clustering compounds and reducing the dimensionality of complex chemical descriptor spaces [31].
- Deep Learning (DL): Utilizing multi-layered neural networks, DL excels at automatically extracting relevant features from raw, high-dimensional data like molecular structures.
- Graph Neural Networks (GNNs): Particularly powerful for chemistry, as they represent molecules as graphs (atoms as nodes, bonds as edges), enabling a native understanding of molecular structure [37] [36].
- Generative Models: Including Generative Adversarial Networks (GANs) and Variational Autoencoders (VAEs), these can design novel molecular structures from scratch based on desired properties [37].
- Reinforcement Learning: This method trains an agent to make a sequence of decisions (e.g., modifying a molecular structure) to maximize a cumulative reward (e.g., a score balancing potency and solubility) [31].
Accelerating Hit Identification through In Silico Screening
Hit identification is the critical first step of the discovery pipeline, aiming to find initial promising compounds that modulate a target. In silico screening uses computational power to prioritize candidates from millions of compounds with minimal laboratory effort.
Methodologies and Workflows
1. Structure-Based Virtual Screening (Molecular Docking) This approach requires a 3D structure of the target protein, which can be obtained from experimental methods (X-ray crystallography, cryo-EM) or predicted by AI tools like AlphaFold [38]. Small molecules from virtual libraries are computationally "docked" into the target's binding site, and scoring functions rank them based on predicted binding affinity and pose [37] [39]. AI-enhanced scoring functions are now outperforming classical physics-based approaches [37].
2. Ligand-Based Virtual Screening When a target structure is unavailable, ligand-based methods are used. These rely on known active compounds to identify new hits with similar properties. Techniques include:
- Quantitative Structure-Activity Relationship (QSAR) Modeling: Correlates molecular descriptors or fingerprints with biological activity using ML models [31] [40].
- Similarity Searching: Identifies compounds structurally similar to known actives.
3. De Novo Molecular Design Generative AI models can bypass existing chemical libraries entirely, creating novel molecular structures optimized for specific target binding and drug-like properties from the outset [37] [38].
Table 1: Key In Silico Screening Platforms and Applications
| Platform/Method | Type | Primary Application | Case Study/Example |
|---|---|---|---|
| Molecular Docking [37] [39] | Structure-Based | Binding affinity and pose prediction | AI-enhanced scoring improves hit rates over classical methods. |
| Generative AI (GANs/VAEs) [37] | De Novo Design | Novel molecule generation | Designing novel inhibitors for specific protein targets. |
| AlphaFold [38] | Structure Prediction | Protein 3D structure generation | Provides targets for docking when experimental structures are lacking. |
| streaMLine (Gubra) [38] | ML-guided Optimization | Peptide optimization | Developed a GLP-1R agonist with improved selectivity and stability. |
| Retrosynthetic Analysis [39] | Synthesis Planning | Synthetic pathway design | Decomposes complex molecules to plan feasible laboratory synthesis. |
The following diagram illustrates a typical integrated workflow for AI-driven hit identification.
Diagram 1: Integrated AI-driven hit identification workflow, combining structure-based, ligand-based, and generative approaches with experimental feedback.
Experimental Protocol: A Representative Virtual Screening Workflow
The following protocol is adapted from a study that identified novel HDAC11 inhibitors [40].
Objective: To identify novel alkyl hydrazides as potent and selective HDAC11 inhibitors from a designed focused chemical space.
Materials & Software:
- Target Protein: HDAC11 structure (from PDB or AlphaFold).
- Chemical Library: A focused virtual library of compounds designed with alkyl hydrazide as a Zinc-Binding Group (ZBG).
- Software: Molecular docking suite (e.g., AutoDock Vina, Glide); ML library (e.g., scikit-learn) for QSAR; molecular dynamics (MD) simulation software (e.g., GROMACS).
Procedure:
- Library Preparation: Generate 3D structures of all compounds in the library. Optimize their geometry using a molecular mechanics force field and assign appropriate charges.
- Protein Preparation: Obtain the 3D structure of HDAC11. Remove native ligands and water molecules, add hydrogen atoms, and assign partial charges in a ready-to-dock format.
- Molecular Docking: Define the binding site coordinates on HDAC11. Dock each compound from the library into the site. Generate multiple poses per compound and score them using the docking software's scoring function.
- AI-Powered Classification: Train a categorical classification model (e.g., a Random Forest classifier) on known HDAC11 inhibitors and inactives. Use this model to score and classify the docked compounds based on their chemical features and docking scores.
- Hit Prioritization: Select top-ranking compounds based on a consensus of favorable docking scores and high ML classification probability.
- Synthesis & Experimental Validation: Synthesize the top 2-3 virtual hits. Evaluate their biological activity through in vitro enzyme inhibition assays (e.g., measure IC50 values) and selectivity profiling against other HDAC subtypes.
- Binding Mode Validation: For confirmed active hits, perform molecular dynamics simulations and metadynamics studies to understand the stability of the ligand-protein complex and the key interactions driving binding.
Revolutionizing ADMET Prediction with Deep Learning
Predicting ADMET properties early in the discovery process is crucial for reducing late-stage attrition. ML models, particularly DL, have demonstrated remarkable capabilities in modeling these complex, high-dimensional structure-property relationships [36].
Key ADMET Endpoints and Modeling Approaches
- Absorption: ML models predict parameters like Caco-2 cell permeability and solubility, which influence oral bioavailability. Graph Neural Networks can decipher structural features that promote or hinder absorption [36].
- Distribution: Models predict volume of distribution and blood-brain barrier (BBB) permeability. For CNS drugs, predicting BBB penetration is a critical application [31].
- Metabolism: A key challenge is predicting the site of metabolism and interaction with cytochrome P450 enzymes (e.g., CYP3A4). Multitask learning models, which learn shared representations across related tasks, have improved prediction accuracy for complex metabolic outcomes [36].
- Excretion: Models are built to predict clearance rates, helping to optimize a drug's half-life and dosing regimen.
- Toxicity: DL models like DeepTox can predict various forms of toxicity, from general organ toxicity to specific endpoints like genotoxicity, directly from chemical structure [37] [39].
Table 2: Performance of ML Models in ADMET Prediction
| ADMET Property | Traditional Method | ML/DL Approach | Reported Advantage/Performance |
|---|---|---|---|
| Toxicity (DeepTox) [37] | In vivo animal testing | Deep Learning (Graph-based) | Outperformed previous methods in large-scale toxicity prediction challenges. |
| Pharmacokinetics (Deep-PK) [37] | In vitro assays & QSAR | Deep Learning (Multitask) | Uses graph-based descriptors and multitask learning for improved prediction. |
| BBB Permeability [31] | In vivo models | 2D-QSAR & ML | Enabled design of BACE-1 inhibitors with good BBB permeability for Alzheimer's. |
| CYP450 Metabolism [36] | In vitro microsomal assays | Graph Neural Networks (GNNs) | Provides higher accuracy in predicting drug-drug interaction potential. |
| General ADMET [36] | Single-assay experiments | Ensemble Methods & MTL | Integrates multimodal data, improving model robustness and generalizability. |
Workflow for Building a Robust ADMET Prediction Model
The development of a reliable ADMET model involves a meticulous process of data curation, model selection, and validation.
Diagram 2: Workflow for developing machine learning models for ADMET property prediction.
The Scientist's Toolkit: Essential Research Reagents and Computational Solutions
Table 3: Key Research Reagent Solutions for AI-Driven Drug Discovery
| Tool/Reagent | Type | Function in Workflow | Example Use Case |
|---|---|---|---|
| AlphaFold [38] [40] | Software | Predicts 3D structures of proteins from amino acid sequences. | Provides high-quality protein models for molecular docking when experimental structures are unavailable. |
| ProteinMPNN [38] | Software | Designs amino acid sequences that fold into a desired protein backbone structure. | Used in de novo protein and peptide drug design to generate stable binders. |
| Molecular Docking Suite (e.g., AutoDock Vina) [40] | Software | Predicts the binding orientation and affinity of a small molecule to a protein target. | Core engine for structure-based virtual screening. |
| Graph Neural Network (GNN) Library (e.g., PyTorch Geometric) [37] [36] | Software Library | Implements neural networks that operate directly on graph-structured data. | The preferred architecture for learning from molecular graphs for activity and ADMET prediction. |
| Categorized Chemical Library [40] | Chemical Reagents | A curated collection of compounds with known properties, used for training and validation. | Serves as the training data for ligand-based models and the source for virtual screening hits. |
| HDAC Enzyme Assay Kit [40] | Biochemical Assay | Measures the inhibitory activity of candidate compounds against histone deacetylase enzymes. | Experimental validation of virtual screening hits, e.g., determining IC50 values. |
The synergistic application of in silico screening and deep learning is fundamentally recoding the drug discovery process. By enabling the rapid identification of novel hit compounds and providing early, accurate insights into their ADMET profiles, these technologies directly confront the core drivers of Eroom's Law: time, cost, and attrition. The transition from a linear "make-then-test" pipeline to an integrated "predict-then-make" cycle is underway, as evidenced by the growing number of AI-discovered candidates entering clinical trials [31]. While challenges in data quality, model interpretability, and generalizability remain active areas of research, the trajectory is clear. The continued integration of these powerful computational tools promises to enhance the efficiency, success rate, and cost-effectiveness of pharmaceutical R&D, ultimately accelerating the delivery of safer and more effective therapeutics to patients.
The hit-to-lead (H2L) phase represents a critical bottleneck in the traditional drug discovery pipeline, a process historically characterized by lengthy timelines and high attrition rates. The primary objective of this phase is to transform initial "hit" compounds, which show activity against a therapeutic target, into promising "lead" candidates with validated potency, selectivity, and developability profiles. Conventional methodologies, often reliant on iterative, low-throughput synthetic chemistry and screening, frequently extend this process to several months or even years. However, the integration of two transformative technologies—AI-guided retrosynthesis and high-throughput experimentation (HTE)—is fundamentally restructuring this workflow. By enabling the rapid, data-driven design and synthesis of novel compounds, this synergistic combination is compressing H2L timelines from months to weeks, thereby accelerating the delivery of novel therapeutics to patients [22] [41]. This whitepaper details the core principles, methodologies, and practical implementations of these technologies within the established framework of drug discovery and development.
Core Technological Pillars
AI-Guided Retrosynthesis
Retrosynthesis planning, the process of deconstructing a target molecule into commercially available starting materials, is a foundational task in organic synthesis. Artificial intelligence, particularly deep learning, has dramatically enhanced this process.
- Template-Free Models and Large Language Models (LLMs): Modern approaches have moved beyond template-based methods, which are limited by predefined reaction rules. Instead, template-free models, such as RSGPT (Retro Synthesis Generative Pre-Trained Transformer), treat retrosynthesis as a sequence-to-sequence translation task. These models, inspired by LLMs, are pre-trained on massive, algorithmically generated datasets (e.g., 10 billion+ reaction datapoints) to autonomously acquire chemical knowledge. This allows them to predict reactants for a wide array of target products with high accuracy, achieving state-of-the-art Top-1 accuracy of 63.4% on standard benchmarks [42].
- Reinforcement Learning from AI Feedback (RLAIF): To further refine predictions, advanced models incorporate reinforcement learning. The model generates potential reactants and reaction templates, which are then validated for chemical rationality by algorithms like RDChiral. This "AI feedback" creates a reward signal that fine-tunes the model to more accurately capture the relationships between products, reactants, and templates [42].
- Addressing Prediction Errors: A critical advancement in the field is the move beyond simple Top-1 accuracy. New evaluation frameworks like the Retro-Synth Score (R-SS) provide a more granular assessment of model performance by accounting for stereochemical errors, partial correctness, and molecular similarity. This offers medicinal chemists a nuanced view of prediction quality, helping them identify "better mistakes" and prioritize viable synthetic routes even when predictions are not perfectly identical to a single ground truth [43].
High-Throughput Experimentation (HTE)
HTE involves the miniaturization, parallelization, and automation of chemical reactions to rapidly empirical test hypotheses and generate robust data.
- Automation and Miniaturization: At its core, HTE replaces traditional round-bottom flask synthesis with automated workstations conducting reactions in parallel arrays (e.g., 96-well plates). This allows for the execution of hundreds of reactions at microgram to milligram scales, drastically reducing reagent consumption, waste, and time [41] [44].
- Automated Powder and Liquid Dosing: A key enabling technology is automated solid and liquid handling. Systems like the CHRONECT XPR workstation can precisely dispense a wide range of powders—from free-flowing to electrostatically charged solids—with high accuracy (e.g., <10% deviation at sub-milligram masses). This eliminates a significant manual bottleneck and reduces human error in weighing, which is especially pronounced at small scales [41].
- Integrated and Multidisciplinary Workflows: Successful HTE implementation requires collocating HTE specialists with medicinal chemists in a cooperative model. This fosters seamless integration between computational design and empirical testing, accelerating the crucial Design-Make-Test-Analyze (DMTA) cycles [22] [41].
Table 1: Performance Metrics of Key Enabling Technologies in Hit-to-Lead
| Technology | Key Metric | Reported Performance | Impact on H2L |
|---|---|---|---|
| AI Retrosynthesis (RSGPT) | Top-1 Accuracy | 63.4% [42] | Increases success rate of viable synthetic route planning |
| AI Molecular Optimization | Potency Improvement | Sub-nanomolar inhibitors from micromolar hits (>4,500-fold improvement) [22] | Dramatically accelerates lead compound potency |
| Automated HTE (AstraZeneca) | Throughput Increase | Screen size increased from ~20-30 to ~50-85 per quarter; conditions evaluated from <500 to ~2000 [41] | Enables rapid exploration of chemical and reaction space |
| Automated Powder Dosing | Weighing Accuracy & Time | <10% deviation (sub-mg); <1% deviation (>50 mg); time reduced from 5-10 min/vial to <30 min for a full experiment [41] | Eliminates manual bottleneck and reduces errors |
Integrated Workflow: A Synergistic Approach
The true power of AI and HTE is realized when they are integrated into a closed-loop, iterative workflow.
- AI-Driven Design: Generative AI models propose novel compound structures based on multi-parameter optimization, balancing potency, selectivity, and predicted ADMET properties. For a given target, AI can generate thousands of virtual analogs, as demonstrated in a 2025 study that enumerated over 26,000 virtual compounds [22] [45].
- Retrosynthesis and Feasibility Analysis: Retrosynthesis AI, integrated directly into the design platform, assesses the synthetic accessibility of these proposed compounds. It provides viable synthetic routes and flags molecules that are synthetically intractable, ensuring that only feasible targets are prioritized [45].
- HTE Execution: The proposed synthetic routes are translated into executable experiments using automated HTE platforms. Robots handle powder dispensing, liquid transfer, and reaction setup in parallel, testing multiple reaction conditions (e.g., varying catalysts, solvents, temperatures) simultaneously [41].
- Data Generation and Analysis: The reaction products are analyzed, often coupled with high-throughput analytical techniques. Crucially, the outcomes—both successful and failed—are recorded in structured databases.
- Model Refinement and Iteration: This new experimental data is fed back into the AI models, creating a continuous learning cycle. This feedback refines the AI's understanding of chemical reactions and structure-activity relationships, leading to more accurate and insightful predictions in the next DMTA cycle [44] [45].
The following diagram illustrates this integrated, cyclical workflow.
Integrated AI & HTE Workflow
Experimental Protocols and Methodologies
Protocol for AI-Guided Retrosynthesis Planning and Validation
Objective: To computationally predict and validate synthetic routes for a target hit compound using a state-of-the-art retrosynthesis model.
Input Preparation:
- Represent the target molecule in its canonical SMILES (Simplified Molecular Input Line Entry System) format.
- Optional but recommended: Perform data augmentation by generating randomized SMILES representations of the target to enhance model robustness [43].
Model Execution:
- Utilize a pre-trained model such as RSGPT or SynFormer.
- Input the target SMILES and run a Top-K prediction (e.g., K=10) to generate a list of potential reactant sets and suggested reaction templates.
Route Validation and Filtering:
- Chemical Validation: Employ a tool like RDChiral to validate the chemical rationality of the proposed reactions. This step checks if the proposed transformation follows known chemical rules and correctly maps atoms from products to reactants [42].
- Feasibility Filtering: Filter the validated routes based on:
- Commercial availability of proposed reactants.
- Complexity of the reaction (e.g., number of steps, hazardous reagents).
- Predicted cost and environmental impact.
Output:
- A ranked list of 3-5 prioritized, chemically valid, and feasible synthetic routes for the target compound.
Protocol for HTE-Based Reaction Screening and Optimization
Objective: To empirically determine the optimal reaction conditions for a prioritized synthetic route using an automated HTE platform.
HTE Plate Design:
- Design a 96-well plate map to systematically explore experimental variables.
- Axis 1 (Building Blocks): Vary the building blocks or core reactants across the rows (e.g., 8 different carboxylic acids).
- Axis 2 (Reaction Conditions): Vary catalysts, ligands, bases, and solvents across the columns (e.g., 12 different condition combinations) [41].
Automated Reaction Setup:
- Solid Dosing: Use an automated powder-dosing robot (e.g., CHRONECT XPR) to accurately dispense solid reagents (catalysts, inorganic bases, starting materials) into the designated vials in the 96-well array.
- Liquid Handling: Use an automated liquid handler to dispense solvents, liquid reagents, and building block solutions.
- All operations are performed within an inert atmosphere glovebox to maintain moisture and oxygen sensitivity [41].
Reaction Execution and Monitoring:
- Seal the reaction plate and place it on a heated/cooled agitator for the desired duration.
- Monitor reaction progress in real-time, if possible, using in-situ spectroscopy.
Work-up and Analysis:
- After the reaction time, quench the reactions automatically.
- Prepare samples for high-throughput analysis, typically via UPLC-MS (Ultra-Performance Liquid Chromatography-Mass Spectrometry).
- Analyze data to determine reaction conversion, yield, and purity for each well.
Output:
- A matrix of experimental results identifying the highest-performing building blocks and the optimal reaction conditions for the scale-up synthesis of the target lead compound.
The logical process of the AI retrosynthesis model, from data preparation to route validation, is detailed in the diagram below.
AI Retrosynthesis Process
The Scientist's Toolkit: Essential Research Reagents and Materials
Successful implementation of an integrated AI/HTE pipeline relies on a suite of specialized hardware, software, and data resources.
Table 2: Key Research Reagent Solutions for AI-Guided HTE
| Item / Solution | Category | Function / Application |
|---|---|---|
| CHRONECT XPR Workstation | Hardware | Automated robotic system for precise dosing of a wide range of solid powders (1 mg to grams) in HTE workflows [41]. |
| Retro Synthesis GPT (RSGPT) | Software | A generative transformer model for template-free retrosynthesis planning, pre-trained on billions of data points to predict reactants [42]. |
| RDChiral | Software | An open-source algorithm used for applying reaction templates with stereochemistry awareness; crucial for validating AI-proposed retrosynthetic routes [42]. |
| USPTO Datasets | Data | Curated datasets of chemical reactions from US patents (e.g., USPTO-50k, USPTO-FULL); the gold standard for training and benchmarking retrosynthesis models [42] [43]. |
| 96-Well Reactor Blocks | Consumable/ Hardware | Miniaturized reaction vessels (e.g., 2 mL to 20 mL vials) arranged in arrays, enabling parallel synthesis under controlled temperatures and agitation [41]. |
| CETSA (Cellular Thermal Shift Assay) | Assay | A target engagement assay used in intact cells to confirm direct binding of a hit compound to its intended protein target, providing critical functional validation [22]. |
The strategic integration of AI-guided retrosynthesis and high-throughput experimentation is no longer a speculative future for drug discovery but a present-day reality that is actively compressing the hit-to-lead timeline. This synergy creates a powerful, data-driven engine where computational predictions guide empirical testing, and experimental results, in turn, refine computational models. This closed-loop system enables researchers to navigate the vast chemical space with unprecedented speed and precision, systematically converting hits into optimized lead candidates in a fraction of the traditional time. As these technologies continue to mature—with advances in model interpretability, autonomous experimentation, and data quality—their role as the central nervous system of modern medicinal chemistry will only become more profound, paving the way for more efficient and successful drug development campaigns.
The drug discovery and development landscape is undergoing a profound transformation, moving beyond the traditional paradigm of small molecule inhibitors and monoclonal antibodies. This shift is driven by the limitations of conventional approaches, particularly in addressing undruggable targets, achieving sufficient therapeutic specificity, and overcoming drug resistance mechanisms. Novel therapeutic modalities—including PROteolysis TArgeting Chimeras (PROTACs), radiopharmaceuticals, and cell and gene therapies—represent a frontier in pharmaceutical science that leverages and redirects fundamental biological processes for therapeutic effect. These platforms enable researchers to target proteins previously considered undruggable, deliver highly cytotoxic payloads with precision, and potentially cure genetic diseases at their source. This whitepaper provides an in-depth technical examination of these three modalities, framing them within the core principles of drug discovery and providing detailed methodologies for their development and application.
PROteolysis TArgeting Chimeras (PROTACs)
Core Principles and Mechanisms
PROTACs are heterobifunctional small molecules that exploit the cell's endogenous ubiquitin-proteasome system (UPS) to achieve targeted protein degradation [46]. Unlike traditional small molecule inhibitors that merely block a protein's activity, PROTACs facilitate the complete removal of the target protein from the cell. A typical PROTAC molecule consists of three elements: a warhead that binds to the Protein of Interest (POI), a ligand that recruits an E3 ubiquitin ligase, and a linker connecting these two moieties [46]. The mechanism is catalytic; a single PROTAC molecule can facilitate the ubiquitination and degradation of multiple POI molecules, operating in a substoichiometric manner that often allows for lower dosing and reduced potential for off-target effects [46].
The primary degradation pathway is the ubiquitin-proteasome system. The PROTAC induces the formation of a ternary complex (POI-PROTAC-E3 ligase), bringing the E3 ligase into close proximity with the POI. The E3 ligase then mediates the transfer of ubiquitin chains from an E2 ubiquitin-conjugating enzyme to lysine residues on the POI. Once polyubiquitinated with K48-linked chains, the POI is recognized and degraded by the 26S proteasome [46]. This approach significantly expands the druggable proteome, as it requires only a binding event to the target protein rather than the occupation of an active site, making it applicable to scaffold proteins and transcription factors that lack conventional enzymatic activity.
Quantitative Landscape of PROTAC Development
Table 1: Key Quantitative Data and E3 Ligases in PROTAC Development
| Metric | Value/Range | Context and Significance |
|---|---|---|
| Pipeline Volume | >80 drugs in development [47] | Indicates strong and active investment in the modality. |
| Commercial Involvement | >100 organizations [47] | Reflects broad industry engagement across biotech and pharma. |
| Common E3 Ligases | Cereblon (CRBN), VHL, MDM2, IAP [47] | The most frequently utilized E3 ligases in current designs. |
| Emerging E3 Ligases | DCAF16, DCAF15, DCAF11, KEAP1, FEM1B [47] | Newer ligases being explored to expand targetable tissue and protein space, and reduce off-target effects. |
| Therapeutic Areas | Cancer (leading), Neurodegenerative, Infectious, Autoimmune diseases [47] | Demonstrates the breadth of potential application beyond oncology. |
Experimental Protocol for PROTAC Development and Validation
Step 1: Design and Synthesis
- Ligand Selection: Identify high-affinity ligands for the target POI (e.g., from known inhibitors) and for a selected E3 ubiquitin ligase (e.g., ligands for VHL or CRBN) [46].
- Linker Optimization: Synthesize a series of PROTACs using linkers of varying composition and length (e.g., PEG chains, alkyl chains). Linker length and flexibility are critical for facilitating the formation of a productive ternary complex.
- Chemical Synthesis: Employ solid-phase or solution-phase peptide synthesis, or medicinal chemistry approaches, to conjugate the warhead, linker, and E3 ligand.
Step 2: In Vitro Biochemical Validation
- Ternary Complex Assay: Use techniques like Surface Plasmon Resonance (SPR) or Isothermal Titration Calorimetry (ITC) to confirm and characterize the formation of the POI-PROTAC-E3 ligase complex.
- Ubiquitination Assay: Incubate the PROTAC, POI, E1, E2, E3 ligase, ubiquitin, and ATP in a cell-free system. Detect polyubiquitination of the POI via western blot using an anti-ubiquitin antibody.
- Cell-Free Degradation Assay: Utilize cell lysates containing functional proteasomes to demonstrate that ubiquitination leads to efficient degradation of the POI.
Step 3: Cellular Validation
- Treatment: Treat relevant cell lines (e.g., cancer cell lines for an oncology target) with a dose range of the PROTAC molecule (typical range: 1 nM to 10 µM) for 4 to 24 hours.
- Western Blot Analysis: Lyse cells and analyze lysates by SDS-PAGE and western blotting. Probe with an antibody against the POI and a loading control (e.g., GAPDH, β-Actin) to confirm concentration- and time-dependent degradation (DC50 is a key potency metric).
- Rescue Experiments: Co-treat cells with PROTAC and well-characterized proteasome inhibitors (e.g., MG-132) or neddylation inhibitors (e.g., MLN4924) to confirm that degradation is proteasome- and ubiquitin-dependent.
- Proliferation/Apoptosis Assays: Perform functional assays (e.g., CellTiter-Glo, Caspase-3/7 activation) to link target degradation to phenotypic outcomes.
PROTAC Mechanism and Workflow Visualization
Diagram 1: PROTAC-mediated targeted protein degradation via the ubiquitin-proteasome system.
Radiopharmaceutical Conjugates
Core Principles and Mechanisms
Radiopharmaceutical conjugates are a class of theranostic agents that combine a tumor-targeting molecule (e.g., a peptide, antibody, or small molecule) with a radioactive isotope [47] [48]. This modality allows for highly localized radiation therapy, delivering a potent cytotoxic payload directly to cancer cells while largely sparing healthy tissues. The targeting moiety is designed to bind with high affinity to antigens or receptors that are overexpressed on the surface of specific cancer cells. Upon binding and internalization, the radionuclide emits radiation (e.g., alpha particles, beta particles, or Auger electrons) that causes irreversible double-strand breaks in cellular DNA, leading to targeted cell death [48]. A key advantage of this approach is its ability to also be used for imaging (e.g., with PET or SPECT), enabling real-time visualization of drug distribution and tumor targeting—a concept known as theranostics [47].
Quantitative Landscape of Radiopharmaceuticals
Table 2: Key Radionuclides and Applications in Radiopharmaceuticals
| Radionuclide | Emission Type | Half-Life | Primary Application | Example Use Case |
|---|---|---|---|---|
| 68Ga | β+ (PET) | 68 min | PET Imaging | Diagnosis, staging (e.g., 68Ga-DOTATATE) [48] |
| 177Lu | β- (Therapy), γ | 6.65 days | Targeted Radionuclide Therapy | Neuroendocrine tumors (e.g., 177Lu-DOTATATE) [48] |
| 225Ac | α | 10 days | Targeted Alpha Therapy | Potent therapy for micro-metastases [48] |
| 89Zr | β+ (PET) | 78.4 hours | Immuno-PET Imaging | Antibody-based imaging due to long half-life [48] |
| 213Bi | α | 46 min | Targeted Alpha Therapy | Investigational (e.g., for fungal infections) [48] |
| 99mTc | γ | 6 hours | SPECT Imaging | Myocardial perfusion, bone scans [48] |
Experimental Protocol for Radiopharmaceutical Development and Evaluation
Step 1: Radionuclide Production and Conjugation
- Production: Produce the desired radionuclide via cyclotron (e.g., 68Ga, 64Cu) or generator (e.g., 68Ge/68Ga generator) or from nuclear reactors (e.g., 177Lu) [48].
- Bifunctional Chelator Conjugation: Chemically conjugate a bifunctional chelator (BFC) to the targeting vector (peptide or antibody). Common BFCs include DOTA, NOTA, and DFO, which are selected based on their compatibility with the radionuclide.
- Radiolabeling: Incubate the conjugated precursor with the purified radionuclide in an appropriate buffer (e.g., ammonium acetate buffer for 68Ga) at a specific temperature and pH for a defined period (e.g., 15 min at 95°C for 68Ga-DOTA). Determine radiochemical purity (RCP) and yield via radio-TLC or radio-HPLC.
Step 2: In Vitro Characterization
- Stability Studies: Incubate the final radiopharmaceutical in human serum at 37°C. Analyze samples at various time points (e.g., 1, 4, 24 hours) by radio-TLC/HPLC to assess stability and transchelation.
- Binding Affinity and Specificity: Perform cell binding assays on antigen-positive and antigen-negative cell lines. Incubate cells with the radioligand with/without an excess of cold competitor. Determine affinity (Kd) and receptor density (Bmax) via saturation binding, and IC50 via competitive binding assays.
- Internalization Studies: Incubate the radiopharmaceutical with target cells. At defined time points, remove surface-bound activity with an acidic wash (glycine buffer, pH 2.5) and measure the internalized fraction via gamma counter.
Step 3: Preclinical In Vivo Evaluation
- Animal Model: Use immunocompromised mice (e.g., nude or SCID) bearing subcutaneous or orthotopic human tumor xenografts.
- Biodistribution: Inject a known activity (~1-5 MBq) of the radiopharmaceutical intravenously into tumor-bearing mice. Euthanize groups of animals at multiple time points (e.g., 1, 4, 24, 48 h p.i.). Collect organs of interest (tumor, blood, liver, kidneys, etc.), weigh them, and measure radioactivity in a gamma counter. Calculate % Injected Activity per Gram of tissue (%IA/g).
- Imaging: Conduct longitudinal PET or SPECT imaging at the same time points to non-invasively visualize biodistribution and tumor uptake. Co-register with CT or MRI for anatomical reference.
- Therapy Efficacy: In therapy studies, randomize tumor-bearing mice into treatment and control groups. Administer a therapeutically relevant dose of the radioconjugate or a control. Monitor tumor volume and animal body weight over time to assess anti-tumor efficacy and potential toxicity.
Radiopharmaceutical Targeting Visualization
Diagram 2: Mechanism of action for a targeted radiopharmaceutical conjugate.
Cell and Gene Therapies
Core Principles and Mechanisms
Cell and gene therapies represent a paradigm shift from treating disease symptoms to addressing their underlying genetic or cellular cause. Gene therapy involves the delivery of genetic material to a patient's cells to correct a defective gene or provide a new function. This is typically accomplished using viral vectors, such as Adeno-Associated Virus (AAV) for in vivo gene delivery or Lentivirus for ex vivo modification of cells [49]. Cell therapy, often combined with gene engineering as in CAR-T therapy, involves administering living cells to a patient to mediate a therapeutic effect. Chimeric Antigen Receptor T (CAR-T) cells are a prime example, where a patient's own T cells are genetically engineered ex vivo to express a synthetic receptor that redirects them to recognize and kill tumor cells [47].
Key Vector Systems and CAR-T Platforms
Table 3: Viral Vectors and Next-Generation CAR-T Platforms
| Vector / Platform | Key Characteristics | Advantages | Limitations / Challenges |
|---|---|---|---|
| AAV Vectors | Small, non-integrating DNA virus [49]. | Safe profile, long-term persistence in non-dividing cells [49]. | Limited cargo capacity, pre-existing immunity in 30-70% of population [49]. |
| Lentiviral Vectors | RNA virus that integrates into host genome [49]. | Stable long-term expression, suitable for dividing cells [49]. | Risk of insertional mutagenesis, more complex production. |
| Adenoviral Vectors | Large, non-integrating DNA virus [49]. | High transduction efficiency, large cargo capacity [49]. | Can trigger strong immune responses. |
| Allogeneic CAR-T | "Off-the-shelf" therapy from healthy donors [47]. | Faster, more affordable, scalable production [47]. | Risk of Graft-versus-Host Disease (GvHD), host immune rejection. |
| Armored CAR-T | Engineered to secrete cytokines or resist immunosuppression [47]. | Enhanced persistence and efficacy in suppressive tumor microenvironments [47]. | Increased complexity of genetic engineering. |
Experimental Protocol for CAR-T Cell Generation and Validation
Step 1: T Cell Isolation and Activation
- Leukapheresis: Collect peripheral blood mononuclear cells (PBMCs) from a patient or donor via leukapheresis.
- T Cell Isolation: Isolate T cells from PBMCs using negative selection magnetic beads (e.g., Pan T Cell Isolation Kit) to achieve high purity (>95% CD3+).
- T Cell Activation: Activate the isolated T cells by culturing with anti-CD3/CD28 antibody-coated beads or recombinant human IL-2 for 24-48 hours.
Step 2: Genetic Modification
- Vector Transduction: Transduce the activated T cells with a lentiviral vector encoding the CAR construct. Optimize the Multiplicity of Infection (MOI) and include enhancers like polybrene or protamine sulfate. Centrifugation (spinoculation) can enhance transduction efficiency.
- Culture and Expansion: Culture the transduced T cells in complete media (e.g., RPMI-1640 + 10% FBS) supplemented with IL-2 for 7-14 days to allow for expansion. Monitor cell density and viability.
Step 3: In Vitro Functional Validation
- Transduction Efficiency: Analyze CAR expression by flow cytometry using a detection reagent like a recombinant protein containing the target antigen fused to a tag (e.g., His-tag) with an anti-tag antibody.
- Cytotoxicity Assay (Co-culture): Co-culture CAR-T cells with target antigen-positive and negative tumor cell lines at various Effector:Target (E:T) ratios. After 12-24 hours, measure specific lysis using a real-time cell analyzer (e.g., xCelligence) or a endpoint assay like LDH release.
- Cytokine Release Assay: Collect supernatant from the co-culture assay after 24 hours. Measure the concentration of key cytokines (e.g., IFN-γ, IL-2) using an ELISA or multiplex bead-based array, indicating T cell activation.
Step 4: Preclinical In Vivo Testing
- Mouse Model: Use immunodeficient mice (e.g., NSG) engrafted with human tumor cell lines (subcutaneously or systemically).
- Treatment: Once tumors are established, randomize mice and treat with a single intravenous injection of CAR-T cells. Control groups should receive non-transduced T cells or PBS.
- Efficacy Monitoring: Monitor tumor volume by caliper measurement 2-3 times per week and track animal survival. Bioluminescence imaging can be used if luciferase-expressing tumor cells are employed.
- Persistence and Trafficking: Periodically collect blood from mice and analyze by flow cytometry for the presence of human CD3+ CAR+ T cells to assess in vivo persistence and expansion.
CAR-T Cell Engineering and Action Visualization
Diagram 3: Workflow for generating and deploying chimeric antigen receptor (CAR) T cells.
The Scientist's Toolkit: Essential Reagents and Materials
Table 4: Key Research Reagent Solutions for Novel Modality Development
| Reagent / Material | Function / Application | Example Specifics |
|---|---|---|
| E3 Ligase Ligands | Recruit the cellular degradation machinery in PROTAC design [46]. | Ligands for Cereblon (e.g., Pomalidomide), VHL (e.g., VH-298). |
| Bifunctional Chelators (BFCs) | Covalently link a targeting molecule to a radionuclide [48]. | DOTA (for 177Lu, 225Ac), NOTA (for 68Ga), DFO (for 89Zr). |
| Ionizable Lipids | Key component of Lipid Nanoparticles (LNPs) for nucleic acid delivery [50]. | Used in mRNA vaccines and therapies for encapsulating and protecting payload. |
| Lentiviral Packaging Systems | Produce lentiviral vectors for stable gene integration in cell engineering [49]. | Second/third-generation systems with psPAX2 and pMD2.G plasmids. |
| Cytokines (e.g., IL-2) | Promote T-cell growth and activation during ex vivo CAR-T cell culture [47]. | Recombinant human IL-2 is essential for T-cell expansion. |
| Magnetic Cell Separation Beads | Isulate specific cell populations (e.g., T cells) with high purity [47]. | Anti-CD3/CD28 beads for T cell activation; negative selection kits for isolation. |
| Proteasome Inhibitors | Validate the proteasome-dependent mechanism of action for PROTACs [46]. | MG-132, Bortezomib. Used in rescue experiments. |
The advent of PROTACs, radiopharmaceutical conjugates, and cell/gene therapies marks a pivotal evolution in drug discovery, moving from simple occupancy-based inhibition to sophisticated reprogramming of biological systems. PROTACs offer a catalytic strategy to eliminate, rather than just inhibit, disease-causing proteins. Radiopharmaceutical conjugates deliver unmatched potency with spatial precision, merging diagnosis and therapy. Cell and gene therapies aim for durable cures by engineering a patient's own cellular machinery. Each modality presents unique development challenges—from molecular design and vector engineering to complex manufacturing and safety management. However, their collective potential to target previously intractable diseases, deliver transformative clinical outcomes, and even provide one-time cures solidifies their role as the cornerstone of the next generation of therapeutics. The future of drug discovery lies in the continued refinement and intelligent integration of these powerful platforms.
Leveraging Real-World Data and Synthetic Data in Clinical Trial Design and Patient Recruitment
The integration of Real-World Data (RWD) and synthetic data represents a foundational shift in clinical trial methodology, aligning with core drug discovery principles of efficiency, translatability, and patient-centricity. RWD, collected from routine healthcare delivery, provides evidence on the usage, benefits, and risks of a medical product in diverse, real-world patient populations [51] [52]. Real-World Evidence (RWE) is the clinical evidence derived from the analysis of this RWD [53]. Synthetic data, often generated via artificial intelligence (AI), creates virtual patient populations or control arms, enabling modeling of drug response and clinical trial scenarios without initially recruiting physical patients [54].
This paradigm addresses systemic bottlenecks in the traditional drug development pipeline. Clinical trials face unprecedented challenges, including recruitment delays affecting 80% of studies and escalating costs, with pharmaceutical R&D spending exceeding $200 billion annually [55]. The use of these data types is becoming standard; over 90% of life science organizations now use RWD in clinical development [51]. This guide details the methodologies and applications of RWD and synthetic data, providing researchers with actionable protocols to enhance trial design, accelerate recruitment, and ultimately improve the probability of technical success in drug development.
Distinguishing Between Data Types and Their Roles
Understanding the distinction between RWD, RWE, and synthetic data is critical for their appropriate application. RWD is the raw data relating to patient health status and/or the delivery of healthcare collected from a variety of sources [53]. RWE is the distilled, clinical evidence obtained through the analysis of RWD [52]. Synthetic data is algorithmically generated data that mimics the statistical properties of real-world or clinical trial datasets without directly using identifiable patient information, often used for simulation and modeling [54].
The value of these data lies in their complementary relationship with traditional Randomized Controlled Trials (RCTs). While RCTs remain the gold standard for establishing causal efficacy through controlled settings and randomization, they often involve selected patient populations that do not represent the broader community who will use the treatments [51] [52]. RWD and RWE fill this gap by demonstrating how treatments perform in broader populations, including elderly patients, those with multiple health conditions, and diverse ethnic groups [51]. The table below summarizes the key differences.
Table 1: Comparison of Traditional Clinical Trials, Real-World Evidence, and Synthetic Data Applications
| Aspect | Randomized Clinical Trials (RCTs) | Real-World Evidence (RWE) | Synthetic Data & Control Arms |
|---|---|---|---|
| Setting | Controlled research environment [51] | Routine healthcare practice [51] [52] | In silico/virtual environment [54] |
| Patient Population | Selected patients meeting strict criteria [51] | Diverse, representative patients with comorbidities [52] | Virtual patient replicas or generated populations [54] |
| Primary Focus | Internal validity, causal proof [51] | External validity, generalizability [51] | Modeling and simulation, trial optimization [54] |
| Timeline & Cost | Fixed duration; high cost [52] | Faster insights; more cost-effective [52] | Rapid generation; reduces physical trial cost [56] |
| Key Role in Development | Establishing efficacy and safety for approval | Post-marketing surveillance, understanding long-term outcomes [51] | Augmenting or replacing traditional control arms; enriching trial design [56] |
The utility of RWE is contingent on the quality and provenance of the underlying RWD. Key sources include:
- Electronic Health Records (EHRs): EHRs are the digital backbone of healthcare, capturing structured information (e.g., lab results, diagnoses) and unstructured data (e.g., physician notes) [51]. With 99% of U.S. hospitals having adopted EHRs, they represent a vast resource for understanding patient journeys, though data was originally collected for clinical care, not research [51] [52].
- Insurance Claims and Billing Data: This source provides information on treatments received, costs, and long-term outcomes across entire populations, excelling in longitudinal tracking [51].
- Disease Registries: These are specialized, curated databases focusing on specific conditions or treatments, often providing the most complete picture of disease progression and treatment performance in target populations [51].
- Digital Health Technologies: Wearable devices, smartphones, and mobile apps generate continuous, real-time data on patient health status, including heart rate, activity levels, and medication adherence [51]. This facilitates the development of digital biomarkers for continuous monitoring, which can achieve 90% sensitivity for adverse event detection [55].
- Patient-Reported Outcomes (PROs) and Social Determinants of Health: These data capture the patient's own perspective on their health and the broader contextual factors (e.g., socioeconomic status, environment) that influence outcomes [51].
Methodological Protocols for Data Utilization
Protocol 1: Using RWD to Plan Feasible Eligibility Criteria and Recruitment
Objective: To leverage RWD for designing patient-centric eligibility criteria that enhance trial feasibility and to support targeted recruitment strategies.
Background: Traditional eligibility criteria can be overly restrictive, excluding patient groups commonly treated in clinical practice. Using RWD to plan criteria can make trials more inclusive and reflective of real-world populations, while also de-risking recruitment [53].
Methodology:
Data Source Selection and Curation:
- Determine whether EHR or claims data is more fit-for-purpose. EHR data often provides richer clinical detail, while claims data excels at tracking long-term healthcare utilization [53].
- Engage cross-functional teams (e.g., clinical science, biostatistics, data management) and individuals knowledgeable about the specific data sources to assess data quality, completeness, and relevance to the disease under investigation [53].
Eligibility Criteria Simulation and Feasibility Assessment:
- Translate draft protocol eligibility criteria into data queries (e.g., ICD-10 codes, medication records, lab values) against the RWD source.
- Quantify the potentially eligible patient population within the RWD source. This helps identify criteria that are overly restrictive and may hinder recruitment.
- Refine criteria based on RWD insights to ensure they are both scientifically rigorous and practically feasible, potentially including patients with comorbidities or those from underrepresented groups [53].
Patient Identification and Recruitment:
- Use RWD to identify and characterize potential participants who match the refined eligibility criteria within healthcare systems.
- Implement RWD-supported recruitment strategies, which may include:
- Monitor recruitment effectiveness and efficiency (e.g., number of patients identified, screen-fail rates, speed of enrollment) using real-time analytics [57].
Protocol 2: Building a Synthetic Control Arm Using RWD
Objective: To create an external control arm from RWD to replace or augment a traditional concurrent control group in a clinical trial, thereby accelerating enrollment, reducing costs, and addressing ethical concerns in placebo groups.
Background: Recruiting patients for non-treatment arms is "very, very expensive and time consuming" [56]. Synthetic control arms (SCAs), built from high-quality, historical RWD, provide a powerful alternative for comparing and contrasting outcomes with the treatment arm [56].
Methodology:
RWD Source Curation and Patient Selection:
- Select a RWD source that is reliable, robust, and relevant to the disease and trial context. This often involves curated, research-ready data modules from sources like disease registries or linked EHR datasets [58].
- Apply the final trial eligibility criteria to the RWD to identify a cohort of historical control patients whose data will form the SCA. The volume and longitudinality of RWD are key advantages here [56].
Data Processing and Harmonization:
- Implement rigorous data cleaning and standardization to ensure the RWD is of sufficient quality for regulatory-grade evidence generation.
- Harmonize endpoints and outcome measures between the prospective trial data (from the treatment arm) and the historical RWD. This may involve using natural language processing (NLP) to extract structured information from unstructured clinical notes in EHRs to match the data collected in the trial [58].
Statistical Analysis and Bias Mitigation:
- Employ advanced statistical methods to minimize confounding and ensure the SCA is comparable to the treatment arm.
- Target Trial Emulation: Design the analysis of the observational RWD to mimic a randomized trial that could have been conducted but wasn't, defining inclusion criteria, treatment strategies, and outcomes as they would be in an RCT [51].
- Propensity Score Methods: Calculate the probability that each patient would belong to the treatment group based on their baseline characteristics. Use these scores to match, weight, or stratify patients between the SCA and the treatment arm to balance the groups and create a fair comparison [51].
- Outcome Analysis: Compare the outcome of interest (e.g., progression-free survival, tumor response) between the treatment arm and the bias-adjusted SCA using appropriate statistical models.
The following diagram illustrates the workflow for creating and validating a synthetic control arm.
Workflow for Creating a Synthetic Control Arm
Protocol 3: Generative AI for Clinical Trial Enrichment and Synthetic Patient Generation
Objective: To implement a generative AI (GAI) platform, such as the conceptual Artificial Clinic Intelligence (ACI), for modeling clinical trial enrichment, generating synthetic patient data, and prospectively predicting clinical parameters that define patients most likely to respond to a therapy [54].
Background: Clinical trial enrichment—the targeted recruitment of patients with characteristics that predict drug benefit—is central to success. GAI can identify complex, latent patterns in multimodal data (genomics, clinical records) that are not apparent through traditional analysis [54].
Methodology:
Data Aggregation and Model Training:
- Aggregate multimodal data, including genomics, genome-wide gene expression profiles, EHR data, and drug response data across disease types.
- Train a generative AI model, such as a Generative Adversarial Network (GAN). The generator creates synthetic patient profiles, while the discriminator evaluates their conformity to the statistical distribution of real patient data [54].
Synthetic Patient Generation and Digital Twinning:
- Use the trained generator to create a large, synthetic cohort of virtual patients (digital twins) that mirror the statistical properties of the real-world target population [54].
- This synthetic cohort can be used to model various clinical trial scenarios in silico before actual patient recruitment.
Prospective Predictive Modeling and Enrichment:
- Model drug response across the generated clinically diverse population.
- The ACI framework ranks the importance of clinical and molecular attributes underlying drug sensitivity [54].
- The output informs clinicians a priori on which selected patient populations constitute the best prospective candidates, effectively enriching the trial for likely responders before the recruitment process begins [54].
Table 2: Quantitative Impact of AI and Data-Driven Strategies on Clinical Trials
| Metric | Traditional Performance | With AI & Advanced Data | Source |
|---|---|---|---|
| Patient Recruitment Enrollment Rates | Delays affect 80% of studies [57] [55] | 65% improvement with AI-powered tools [55] | [55] |
| Trial Timelines | Conventional durations | 30–50% acceleration with AI integration [55] | [55] |
| Trial Costs | Recruitment consumes ~40% of budget [57] | Up to 40% reduction in costs [55] | [55] |
| Screen-Failure Rates | Can exceed 80% for complex trials [57] | Dramatically reduced via precision targeting [57] | [57] |
| Predictive Analytics Accuracy | N/A | 85% accuracy in forecasting trial outcomes [55] | [55] |
The Scientist's Toolkit: Essential Reagents and Solutions
The practical application of these methodologies relies on a suite of technological and data solutions.
Table 3: Key Research Reagent Solutions for RWD and Synthetic Data
| Tool Category | Specific Examples / Vendors | Function & Application |
|---|---|---|
| Curated RWD Modules | Verana Health Qdata [58], CPRD (UK) [52] | Provides research-ready, de-identified data from disease-specific registries (e.g., ophthalmology, urology) and EHRs, pre-processed for analysis. |
| AI/ML Analytics Platforms | Lifebit AI [57], Federated Learning Systems [51] | Enables secure, federated analysis of RWD across institutions without moving data; applies NLP to unstructured clinical notes. |
| Generative AI & Digital Twin Software | Artificial Clinic Intelligence (ACI) frameworks [54], GANs | Generates synthetic patient data and digital twins for virtual trial modeling and prospective prediction of drug response. |
| Data Standardization & Interoperability Tools | FHIR Standards, CDISC Mapping [51] | Facilitates the mapping and harmonization of disparate data formats from various RWD sources into a consistent structure for analysis. |
| Predictive Analytics & Patient Matching | TrialGPT [54], AI-powered Pre-screening Chatbots [57] | Uses LLMs and machine learning to match patient profiles to clinical trial eligibility criteria, improving recruitment efficiency. |
The strategic integration of RWD and synthetic data is no longer a forward-looking concept but a present-day necessity for efficient and effective clinical development. These methodologies directly address the core challenges in the drug discovery and development process: escalating costs, prolonged timelines, and high failure rates. By adopting these protocols—using RWD to design feasible trials and create synthetic control arms, and leveraging GAI for patient enrichment—researchers can increase the speed, reduce the cost, and enhance the generalizability and success rate of clinical trials. This evolution towards a more data-driven, patient-centric paradigm is fundamental to delivering innovative therapies to patients in need.
Navigating the Valley of Death: Strategies to Overcome High Attrition and Inefficiency
In the rigorous process of drug development, late-stage clinical failures represent one of the most significant challenges, resulting in substantial financial losses and delayed access to potentially life-saving therapies. The transition from promising Phase II results to failed Phase III trials has ended numerous development programs, with 2025 data revealing a continuing trend of high-profile late-stage disappointments across major pharmaceutical companies. Understanding the multifaceted causes of these failures—spanning efficacy shortcomings, safety concerns, trial design flaws, and manufacturing issues—is crucial for improving the overall efficiency and success rate of drug development. This analysis examines the core reasons behind these failures within the broader context of fundamental drug discovery and development principles, providing researchers and development professionals with evidence-based insights to guide future research strategies and clinical planning.
Quantitative Landscape of Recent Clinical Failures
An analysis of recent clinical failures reveals distinct patterns across therapeutic areas, molecular targets, and failure causes. The following tables synthesize quantitative data from 2024-2025 to illustrate these trends.
Table 1: Notable Phase III Clinical Trial Failures (2024-2025)
| Company | Drug/Asset | Therapeutic Area | Primary Reason for Failure |
|---|---|---|---|
| AstraZeneca | Anselamimab (AL amyloidosis) | Hematology | Did not meet primary endpoint (statistical significance) in IIIa/IIIb patients [59] |
| Novartis | Cosentyx (GCA) | Immunology | No statistically significant improvement in sustained remission at week 52 [59] |
| Johnson & Johnson | Bota-vec (X-linked retinitis pigmentosa) | Ophthalmology | Failed to improve visual navigation (primary endpoint) [59] |
| BeiGene | Ociperlimab (NSCLC) | Oncology | Failed to meet OS endpoint in AdvanTIG-302 trial [59] |
| Roche | High-dose Ocrevus (RMS) | Neurology | Higher doses (1200/1800mg) less effective than approved 600mg dose [59] |
| GSK | Belrestotug (NSCLC) | Oncology | GALAXIES Lung-201 did not meet primary endpoint [60] |
| Roche | Tiragolumab (NSCLC, HCC) | Oncology | Did not meet PFS/OS endpoints in multiple III studies [60] |
Table 2: FDA Rejections (2025 1-9 Months) and Primary Reasons [61]
| Drug/Sponsor | Therapeutic Area | Primary Reason | Additional Factors |
|---|---|---|---|
| Reproxalap (Aldeyra) | Ophthalmology | Inadequate efficacy evidence | Baseline score differences between trial arms |
| EYLEA HD (Regeneron) | Ophthalmology | Regulatory (dosing interval) | CRL provided no further explanation |
| TLX-101-CDx (Telix) | Oncology | Need confirmatory clinical evidence | Insufficient for glioma imaging indication |
| Elamipretide (Stealth) | Barth Syndrome | Efficacy endpoints; manufacturing | Third-party cGMP issues |
| Deramiocel (Capricor) | Cardiology | Insufficient efficacy evidence; CMC | CMC deficiencies noted |
| Blenrep (GSK) | Oncology | Risk-benefit (ODAC 5:3 vote) | OS not met; ocular toxicity; dosing issues |
| Columvi (Roche) | Oncology | Population generalizability | Only 9% North American patients |
| RP1 (Replimune) | Oncology | Inadequate efficacy evidence | Trial design issues |
| Vatiquinone (PTC) | FA Ataxia | Lack of efficacy | New controlled study required |
| ONS-5015 (Outlook) | Ophthalmology | Primary endpoint not met | Previously rejected (2023) for manufacturing |
| Rexulti (Otsuka/Lundbeck) | Psychiatry | Lack of effectiveness | PDAC voted 10:1 against efficacy |
| Ebvallo (Atara) | Oncology | Third-party manufacturing | No clinical efficacy/safety issues noted |
| Camrelizumab (Hengrui) | Oncology | CMC issues | Manufacturing quality control |
| Cardamyst (Milestone) | Cardiology | CMC problems | New equipment needs cGMP compliance |
| UX111 (Ultragenyx) | Genetic Disease | Manufacturing; facility issues | Insufficient process data |
| Odronextamab (Regeneron) | Oncology | Third-party manufacturing | Catalent facility inspection issues |
Root Cause Analysis: Efficacy and Clinical Design Failures
Inadequate Target Engagement and Validation
A fundamental cause of late-stage efficacy failures stems from inadequate target engagement—the inability of a drug to effectively interact with its intended biological target to achieve the desired therapeutic effect. Despite billions invested in drug development, more than 90% of clinical drug candidates fail, with nearly 50% of failures attributed to inadequate efficacy, often linked to poor target engagement [62].
The Cellular Thermal Shift Assay (CETSA) has emerged as a valuable methodology for quantifying target engagement in physiological conditions, enabling researchers to measure drug-target interactions directly in intact cells and tissues while preserving physiological relevance. This label-free, unbiased assessment helps address several limitations of traditional methods [62].
dot Experimental Protocol: CETSA for Target Engagement Assessment
Key reasons for target engagement failures include:
- Insufficient drug concentrations at target site: Poor pharmacokinetics or inadequate dosing regimens prevent therapeutic drug levels [62]
- Low binding affinity or selectivity: Weak target interaction or off-target effects reduce efficacy [62]
- Complex target biology: Multiple isoforms, post-translational modifications, or dynamic protein interactions complicate engagement [62]
- Inadequate preclinical validation: Models that fail to accurately predict human efficacy [62]
Clinical Trial Design and Population Issues
Flawed trial design represents another major category of late-stage failures, particularly problems with patient stratification, endpoint selection, and trial population generalizability.
The STARGLO trial for Columvi exemplifies population generalizability issues. The study population included 59% from Asia or Australia, 32% from Europe, and only 9% from North America, prompting FDA concerns about applicability to the US patient population [61].
Similarly, the DREAMM-8 trial for Blenrep faced criticism not only for failing to meet overall survival endpoints but also for low US patient enrollment (below 5% in both pivotal trials), raising questions about results applicability to American populations. Additionally, dose design problems emerged where most patients required frequent adjustments by the third treatment cycle, compromising efficacy assessment [61].
Table 3: Essential Research Reagents for Target Engagement Studies
| Research Reagent | Function in Experimental Protocol | Key Applications |
|---|---|---|
| CETSA Platform | Measures drug-target interactions in physiological conditions | Preclinical target validation; biomarker development [62] |
| Lipid Nanoparticles (LNP) | Delivery vehicle for genome editing components | Liver-targeted therapies (e.g., hATTR, HAE) [63] |
| Viral Vectors (AAV, Lentivirus) | Gene delivery systems for cell and gene therapies | CRISPR-based therapies; genetic disease treatment [63] |
| Biomarker Assays (Western Blot, MS) | Quantifies target engagement and pharmacodynamic response | Efficacy assessment; dose selection optimization [62] |
| Proper Cell Culture Systems | Physiologically relevant cellular models | Preclinical target validation [62] |
Manufacturing and Regulatory Hurdles
Chemistry, Manufacturing, and Controls (CMC) Challenges
The FDA's CMC and GMP Guidance documents outline comprehensive requirements for drug manufacturing quality, yet CMC issues continue to cause significant delays and rejections [64]. In 2025 alone, multiple drug approvals were jeopardized by manufacturing deficiencies:
- Ebvallo (tabelecleucel): Rejection due solely to third-party manufacturer issues despite no reported clinical deficiencies [61]
- Cardamyst (etripamil): CRL cited CMC problems and requirements for new equipment cGMP compliance [61]
- UX111 (ABO-102): FDA cited insufficient manufacturing data and facility inspection issues [61]
- Odronextamab: Rejection due to third-party manufacturing facility (Catalent) observations [61]
These cases highlight how even promising clinical results can be derailed by manufacturing shortcomings, particularly as the FDA increases scrutiny of third-party production facilities and compliance with current Good Manufacturing Practices (cGMP).
Biomarker and Precision Medicine Limitations
Inadequate biomarkers for patient selection and treatment monitoring contribute significantly to late-stage failures. The case of CLL treatment development illustrates the evolving understanding of biomarkers. Research presented at iwCLL 2025 demonstrated that high genomic complexity (HGC) alone was not an independent prognostic factor when more sophisticated biomarkers like telomere length and DNA methylation epitype were considered [65].
dot Logical Relationship: CLL Risk Stratification Evolution
Multivariate analysis revealed that TP53 dysfunction (HR=3.59), unmutated IGHV (HR=2.04), and short telomere length (HR=1.92) were independent predictors of progression, while HGC lost significance when these factors were considered [65]. This highlights the critical need for composite biomarker strategies rather than reliance on single parameters for patient stratification.
Strategies for Mitigating Late-Stage Failure Risk
Enhanced Preclinical to Clinical Translation
Improving the predictive value of preclinical models requires more physiologically relevant systems and advanced target engagement assessment. Integrating technologies like CETSA early in development provides label-free, physiologically relevant insights into drug-target interactions, helping eliminate weak candidates before costly clinical trials [62].
Additionally, implementing more rigorous biomarker strategies during early development establishes better patient selection criteria for later stages. The successful development of CRISPR-based therapies for rare diseases demonstrates how understanding biodistribution and target engagement through appropriate biomarkers (e.g., TTR protein levels for hATTR) can de-risk later-stage development [63].
Adaptive Clinical Trial Designs and Manufacturing Preparedness
Embracing adaptive trial designs that allow modification based on interim analyses can address efficacy questions earlier. Furthermore, early engagement with regulatory agencies about trial population composition, particularly geographic distribution, can prevent generalizability concerns.
For manufacturing, implementing quality-by-design principles early in process development and conducting thorough supplier qualification for third-party manufacturers reduces CMC-related risks. The FDA's Advanced Manufacturing Technologies Designation Program provides opportunities for companies adopting innovative manufacturing approaches that may improve quality and consistency [64].
Late-stage clinical failures remain a formidable challenge in drug development, with root causes spanning inadequate target engagement, flawed trial design, manufacturing deficiencies, and insufficient biomarkers. The cases from 2024-2025 demonstrate that despite scientific advancements, fundamental issues in translating preclinical findings to clinical success persist. Addressing these challenges requires integrated strategies combining robust target validation, physiologically relevant assays, strategic clinical planning, and manufacturing quality from the earliest development stages. By applying these principles within the framework of continuous improvement, researchers and drug development professionals can systematically reduce late-stage attrition and deliver innovative therapies to patients more efficiently.
Target engagement confirmation stands as a critical gatekeeper in the drug discovery pipeline, bridging the gap between target identification and therapeutic efficacy. As the industry grapples with high attrition rates in Phase II and III clinical trials—often due to inadequate efficacy or safety—the need for robust, physiologically relevant validation methods has never been greater [66] [67]. This whitepaper examines the central role of functional validation assays, with particular focus on the Cellular Thermal Shift Assay (CETSA) and complementary technologies, in de-risking drug discovery by providing direct evidence of drug-target interactions within native biological environments. We present comprehensive experimental protocols, data interpretation frameworks, and practical implementation strategies to equip researchers with the tools necessary for high-confidence target assessment throughout the drug development continuum.
The journey from initial target identification to approved therapy is notoriously long, expensive, and fraught with failure. Recent estimates indicate the average timeline for developing a new drug spans 12–13 years, with costs exceeding $2.5 billion per approved drug, and only 1–2 of every 10,000 screened compounds ultimately reaching patients [67]. A predominant cause of failure in Phase II clinical trials remains inadequate efficacy, often traceable to insufficient validation that drug candidates effectively engage their intended targets in biologically relevant contexts [66] [67].
Target engagement refers to the specific binding and functional modulation of a putative drug target by a therapeutic candidate. Establishing pharmacologically relevant exposure levels and engagement comprises two foundational steps in target validation [66]. Traditional methods for assessing engagement often relied on indirect readouts (e.g., downstream phenotypic changes) or artificial systems (e.g., purified proteins in biochemical assays) that failed to capture the complexity of native cellular environments. The development of direct engagement assays that function in physiologically relevant settings has therefore become indispensable for building confidence in therapeutic mechanisms before committing to costly clinical development [68] [69].
The Cellular Thermal Shift Assay (CETSA): Principles and Advantages
Fundamental Mechanism
CETSA operates on the fundamental biophysical principle that a protein's thermal stability typically increases when a ligand binds to its native structure [70] [68]. In practice, this means that a target protein will become more resistant to heat-induced denaturation and subsequent aggregation when engaged by a drug molecule.
The assay involves three core steps:
- Incubation: Cells, tissues, or lysates are treated with or without the test compound.
- Heat Challenge: Samples undergo controlled heating to induce protein denaturation.
- Measurement: The remaining soluble (properly folded) protein is quantified and compared across conditions [70].
When a compound binds to its target, it produces a detectable thermal shift in the protein's melt profile, serving as direct evidence of engagement [70]. It's crucial to note that the response measured by CETSA is not governed solely by ligand affinity to the target protein; the thermodynamics and kinetics of ligand binding and protein unfolding also contribute to the observed stabilization [71].
Key Advantages Over Traditional Assays
CETSA provides several distinct advantages that have made it indispensable in modern drug discovery:
- Native Cellular Context: CETSA directly measures protein stability and drug-target interactions in intact cells, offering more biologically relevant data than in vitro biochemical assays [70].
- Label-Free Approach: The method requires no chemical labeling or reporter tags, preserving natural protein behavior and reducing assay artifacts [70].
- No Genetic Modification Required: Unlike some target engagement assays, CETSA does not require tagged proteins or genetically modified cell lines [70].
- Broad Applicability: CETSA can be applied to virtually any protein, regardless of function, enzymatic activity, or availability of specific antibodies [70].
- Direct Binding Measurement: Rather than relying on indirect readouts like enzymatic activity or reporter gene expression, CETSA quantifies direct stabilization or destabilization of proteins upon ligand binding [70].
Table 1: Comparison of CETSA with Traditional Target Engagement Methods
| Method Feature | CETSA | Biochemical Assays | Genetic Reporter Systems |
|---|---|---|---|
| Cellular Context | Native cellular environment | Purified proteins | Genetically modified cells |
| Label Requirement | Label-free | Often requires labeling | Requires genetic modification |
| Throughput Potential | High (microplate format) | High | Moderate to High |
| Target Classes | Virtually any protein | Enzymes, receptors | Pathway-dependent |
| Direct Binding Readout | Yes | Yes | No (indirect functional readout) |
CETSA Experimental Design and Workflow
Core Methodologies
CETSA experiments are typically conducted in two primary formats, each serving distinct purposes in the drug discovery workflow:
Thermal Aggregation Temperature (Tagg) Curves
This format involves generating melting curves for the target protein by subjecting compound-treated samples to a gradient of temperatures (typically spanning 37-65°C). The apparent Tagg represents the temperature at which approximately 50% of the protein aggregates [68]. A rightward shift in this curve in the presence of a compound indicates thermal stabilization and successful target engagement.
Isothermal Dose-Response Fingerprints (ITDRFCETSA)
In this format, samples are heated at a single, fixed temperature (typically near the Tagg of the unbound protein) while varying the compound concentration. This approach generates a dose-response curve that enables ranking of compound affinities and is particularly suitable for structure-activity relationship (SAR) studies [68].
Detailed Experimental Protocol
The following protocol outlines the key steps for implementing CETSA in a microplate-based format using AlphaScreen detection, adapted from the Assay Guidance Manual [68]:
Step 1: Model System Selection and Preparation
- Choose appropriate cellular systems (cell lysates, intact cells, or tissue samples) expressing the target protein endogenously or via recombinant expression.
- Culture cells under standard conditions, ensuring consistent passage number and viability.
- For intact cell assays, harvest cells and prepare suspensions at appropriate densities (typically 1-10 million cells/mL).
- For cell lysate assays, prepare lysates using mild detergents and protease inhibitors to preserve native protein structure.
Step 2: Compound Treatment
- Prepare compound dilutions in appropriate vehicle (typically DMSO, keeping final concentration ≤1%).
- Treat cell suspensions or lysates with compounds across desired concentration range.
- Include vehicle-only controls for baseline thermal stability assessment.
- Incubate at 37°C for sufficient time to allow compound uptake and binding (typically 30 minutes to several hours for intact cells).
Step 3: Heat Challenge
- Aliquot compound-treated samples into PCR plates or similar heat-stable microplates.
- Perform heating using a precise thermal cycler with temperature gradient capability.
- For Tagg curves: Heat samples across a temperature range (e.g., 37-65°C in 2-3°C increments).
- For ITDRFCETSA: Heat all samples at a single temperature near the protein's Tagg.
- Maintain heating for a standardized duration (typically 3-5 minutes).
Step 4: Cooling and Cell Lysis
- Cool samples rapidly to 4°C to stabilize the aggregated/non-aggregated protein distribution.
- For intact cell samples: Add lysis buffer containing detergents (e.g., 0.1-0.5% NP-40) and protease inhibitors.
- Incubate on ice for 15-30 minutes with occasional mixing.
Step 5: Protein Quantification
- Remove aggregated proteins by centrifugation (typically 10-20,000 × g for 20 minutes at 4°C).
- Transfer soluble fractions to new plates for target protein quantification.
- For AlphaScreen detection: Use target-specific antibodies for capture and detection, following manufacturer's protocols for homogenous assay setup.
- Normalize signals to vehicle-treated controls to calculate percentage of stabilized protein.
Diagram 1: CETSA Experimental Workflow
Complementary Target Engagement Assays
While CETSA provides valuable information about direct target engagement, a comprehensive validation strategy often incorporates multiple orthogonal methods:
Genetic Validation Tools
- CRISPR/Cas9 and RNAi: These technologies enable precise knockout or knockdown of candidate genes, providing direct genetic evidence of target-disease relationships [67] [72].
- Transgenic Animals: Engineered mouse models with tissue-restricted or inducible gene modifications help validate targets in physiologically relevant whole-animal contexts while avoiding compensatory developmental mechanisms [72].
Affinity-Based Methods
- Surface Plasmon Resonance (SPR): Provides detailed kinetic information (kon, koff) and affinity measurements for drug-target interactions.
- Cellular Pull-Down Assays: Utilize chemical probes with affinity handles to capture and identify direct binding partners from complex cellular lysates.
Functional and Phenotypic Assays
- Enzyme Activity Assays: Measure direct functional consequences of target engagement for enzymatic targets.
- Pathway Reporter Assays: Monitor downstream consequences of target engagement using engineered pathway-specific reporters.
- High-Content Imaging: Quantifies multiparameter phenotypic changes in response to target modulation.
Table 2: Comparison of Target Engagement Assessment Methods
| Method | Principle | Cellular Context | Throughput | Key Output Parameters |
|---|---|---|---|---|
| CETSA | Thermal stabilization | Lysate, intact cells, tissues | Medium to High | Tagg shift, EC50 |
| SPR | Biomolecular binding kinetics | Purified proteins | Low to Medium | KD, kon, koff |
| CRISPR Knockout | Genetic deletion | Intact cells, animals | Low | Phenotypic consequence |
| Cellular Pull-Down | Affinity capture | Intact cells, lysates | Low | Direct binding partners |
| Enzyme Activity | Functional modulation | Lysate, intact cells | High | IC50, enzyme kinetics |
Data Interpretation and Integration
Quantifying and Reporting CETSA Data
Proper interpretation of CETSA data requires understanding key parameters and their significance:
- ΔTagg: The temperature shift induced by compound binding, typically reported as the difference between compound-treated and vehicle-treated Tagg values. A ΔTagg of ≥2°C is generally considered significant.
- EC50: The compound concentration that produces half-maximal stabilization in ITDRFCETSA experiments, providing an estimate of cellular potency.
- Signal Window: The dynamic range between baseline denaturation and maximal stabilization, critical for assay quality assessment.
Integration with Broader Drug Discovery Data
CETSA data should not be interpreted in isolation but rather integrated with other compound profiling data:
- Correlate CETSA EC50 values with functional IC50 values from biochemical or cellular activity assays.
- Compare engagement potency with cellular activity and phenotypic responses to establish exposure-response relationships.
- Integrate with ADME/Tox profiling to understand how compound disposition affects target engagement.
- Leverage CETSA selectivity profiling (via thermal proteome profiling) to assess off-target interactions [68] [73].
Diagram 2: CETSA Data Integration in Decision-Making
Advanced Applications and Emerging Technologies
Thermal Proteome Profiling (TPP)
An extension of CETSA, TPP utilizes quantitative mass spectrometry to monitor thermal stability across thousands of proteins simultaneously [68]. This approach enables:
- Unbiased Target Deconvolution: Identification of novel targets for compounds with unknown mechanisms of action.
- Selectivity Assessment: Comprehensive evaluation of compound selectivity across the expressed proteome.
- Mechanism of Action Studies: Identification of downstream pathway effects and compensatory mechanisms.
Artificial Intelligence and Predictive Modeling
Recent advances in computational approaches are enhancing CETSA applications:
- Deep Learning Models: Frameworks like CycleDNN predict CETSA features across cell lines, potentially reducing experimental burden by extrapolating from limited datasets [73].
- Chemical Proteomics Integration: Combining CETSA with chemical proteomics datasets improves prediction of drug-target interactions and polypharmacology.
High-Throughput Implementation
Adaptation of CETSA to high-throughput screening formats enables:
- Hit Validation: Rapid confirmation of direct engagement for hits from primary screening campaigns.
- SAR Profiling: Ranking of compound series based on cellular engagement potency.
- Mechanistic Toxicology: Identification of off-target interactions contributing to compound toxicity.
The Scientist's Toolkit: Essential Research Reagents and Materials
Table 3: Essential Reagents and Materials for CETSA Implementation
| Category | Specific Items | Function/Purpose | Key Considerations |
|---|---|---|---|
| Cellular Models | Cell lines (primary, immortalized), Tissue samples, Cell lysates | Source of target protein in relevant biological context | Endogenous expression vs. overexpression; Disease relevance; Physiological signaling environment |
| Detection Reagents | Target-specific antibodies, AlphaScreen/AlphaLISA reagents, TR-FRET pairs, MS-compatible buffers | Quantification of soluble target protein after heat challenge | Affinity reagent specificity/sensitivity; Homogeneous vs. heterogeneous detection; Multiplexing capability |
| Thermal Control | Thermal cyclers, Heat blocks, Precision water baths | Controlled application of heat challenge | Temperature accuracy/precision; Heating rate standardization; Multi-sample processing capability |
| Compound Handling | DMSO, Compound libraries, Liquid handling systems | Precise compound delivery and dilution | DMSO tolerance; Compound solubility; Concentration verification |
| Sample Processing | Lysis buffers, Protease inhibitors, Detergents, Centrifugation equipment | Protein extraction and aggregation separation | Buffer composition optimization; Compatability with detection method; Aggregate removal efficiency |
| Data Analysis | Analysis software, Curve-fitting tools, Statistical packages | Quantification of thermal shifts and dose-responses | QC metrics; Normalization methods; Curve-fitting models (4PL, sigmoidal) |
CETSA has established itself as a cornerstone technology for direct target engagement assessment in physiologically relevant environments. Its label-free nature, applicability across diverse target classes, and compatibility with intact cellular systems address critical gaps in traditional validation approaches. When integrated with orthogonal methods in a comprehensive target assessment strategy, CETSA significantly de-risks drug discovery by building confidence in mechanism of action before substantial resources are committed to clinical development.
As drug discovery continues to evolve toward more complex targets and therapeutic modalities, the principles of functional validation exemplified by CETSA will remain essential. Emerging innovations in mass spectrometry-based proteomics, artificial intelligence, and single-cell analysis promise to further enhance our ability to confidently connect target engagement to therapeutic outcomes, ultimately improving success rates in bringing effective new medicines to patients.
In the drug discovery and development process, therapeutic efficacy is not solely determined by a drug's pharmacodynamic activity at its target site. Instead, it is profoundly influenced by the drug's pharmacokinetics (PK)—the study of how the body interacts with administered substances throughout the duration of exposure [74] [75]. Pharmacokinetics determines how much of a drug is delivered to the body and the site of action, and for how long it remains therapeutically active, ultimately establishing whether a medication is viable and effective enough for clinical use [75]. The optimization of a drug's pharmacokinetics is therefore essential to formulation science, ensuring that sufficient drug concentrations reach the target site to produce the desired therapeutic effect while minimizing potential adverse reactions [74] [75].
The field of pharmacokinetics is broadly categorized into four fundamental processes: Absorption, Distribution, Metabolism, and Excretion (ADME) [74] [76]. Unsatisfactory pharmacokinetic properties in any of these areas can compromise both the safety and efficacy of a drug candidate [77]. For instance, medications with a short elimination half-life may require multiple daily doses, potentially impacting patient adherence, while significant fluctuations in plasma levels can result in toxicity from high peak concentrations or diminished efficacy due to low trough levels [77]. Formulation scientists play a critical role in addressing these challenges by developing innovative delivery systems that improve the plasma profile of a medication, thereby optimizing therapeutic outcomes [77].
This technical guide explores the fundamental principles of pharmacokinetic optimization through advanced formulation strategies, with a particular focus on improving bioavailability—the fraction of an administered dose that reaches the systemic circulation as the active drug [78]. Within the context of the broader drug discovery and development pipeline, we will examine how formulation science can modulate ADME properties to enhance drug delivery, overcome biological barriers, and ultimately contribute to the successful development of safe and effective medicines.
Foundational Principles of Pharmacokinetics (ADME)
A comprehensive understanding of the ADME process provides the necessary foundation for rational drug design and formulation optimization. Each component of ADME presents unique challenges and opportunities for improving a drug's pharmacokinetic profile.
Absorption and Bioavailability
Absorption is the process that brings a drug from its administration site into the systemic circulation [74]. The rate and extent of absorption are critical determinants of a drug's onset and intensity of action. Bioavailability is the fraction of the originally administered drug that arrives in systemic circulation and serves as a direct reflection of medication absorption [74]. While intravenous administration provides 100% bioavailability, other routes must navigate various biological barriers [74] [75]. For orally administered drugs, these barriers include stomach acidity, digestive enzymes, and the "first-pass metabolism" effect, where medications are processed in large quantities by the liver and gut wall before reaching systemic circulation, subsequently lowering the amount of active drug available [74].
Distribution
Once absorbed, a drug undergoes distribution throughout the body's tissues and fluids [74]. The Volume of Distribution (Vd) is a key pharmacokinetic parameter defined as the amount of drug in the body divided by the plasma drug concentration [74]. This metric describes the theoretical volume that would be required to contain the total amount of administered drug at the same concentration observed in blood plasma. Distribution is influenced by multiple factors including the drug's physicochemical properties (size, lipophilicity, polarity), protein binding capacity, and patient physiology (fluid status, body habitus) [74]. Only the unbound (free) fraction of drug can act at pharmacologically active sites, cross into fluid compartments, or be eliminated, making protein binding a crucial consideration in distribution dynamics [74].
Metabolism and Excretion
Metabolism transforms drugs into more water-soluble compounds for elimination, primarily through hepatic Phase I (CYP450) and Phase II (UGT) reactions [74]. While metabolism typically inactivates drugs, some prodrugs require metabolic conversion to become therapeutically active [74] [76]. Excretion eliminates drugs from the body, predominantly through renal clearance in the kidneys, though some compounds may be excreted via the bile, lungs, or skin [74]. Clearance is defined as the ratio of a drug's elimination rate to the plasma drug concentration and is influenced by both the drug's properties and the patient's organ function and blood flow [74]. The half-life (t½) of a drug—the time required for plasma concentrations to decrease by 50%—is directly proportional to the volume of distribution and inversely proportional to clearance, making it a critical parameter for determining appropriate dosing intervals [74].
Table 1: Key Pharmacokinetic Parameters and Their Formulation Significance
| Parameter | Definition | Formulation Significance |
|---|---|---|
| Bioavailability (F) | Fraction of administered dose that reaches systemic circulation | Determines the required dosing strength; primary target for optimization for non-IV routes [74] |
| Volume of Distribution (Vd) | Theoretical volume required to contain total amount of drug at plasma concentration | Influences loading dose requirements; indicates extent of tissue distribution [74] |
| Clearance (CL) | Volume of plasma cleared of drug per unit time | Determines maintenance dosing rate; affected by organ function [74] |
| Half-Life (t½) | Time for plasma concentration to reduce by 50% | Determines dosing frequency; affects peak-trough fluctuations [77] |
| Protein Binding | Fraction of drug bound to plasma proteins | Affects free drug concentration available for pharmacological activity [74] |
The Bioavailability Challenge: Solubility and Permeability Barriers
The Biopharmaceutical Classification System (BCS) provides a scientific framework for classifying drug substances based on their aqueous solubility and intestinal permeability [75] [78]. This system categorizes drugs into four classes, with Class II and IV drugs presenting the most significant formulation challenges:
- Class I: High Solubility, High Permeability - Generally exhibit good bioavailability
- Class II: Low Solubility, High Permeability - Solubility-limited absorption
- Class III: High Solubility, Low Permeability - Permeability-limited absorption
- Class IV: Low Solubility, Low Permeability - Significant bioavailability challenges [75] [78]
It is estimated that 60-70% of new chemical entities (NCEs) identified in drug discovery programs are insufficiently soluble in aqueous media, and approximately 40% of newly developed drugs face formulation difficulties due to poor solubility and bioavailability [79] [80]. This high prevalence of poorly soluble candidates is frequently attributed to modern drug discovery approaches that often yield complex molecules with high molecular weight and lipophilicity [80].
The interplay between solubility and permeability represents a fundamental consideration in bioavailability enhancement [75]. A drug must possess adequate aqueous solubility to dissolve in gastrointestinal fluids, yet sufficient lipophilicity to permeate biological membranes—creating a delicate balancing act for formulators [75]. Additionally, drugs may face other barriers including enzymatic degradation, P-glycoprotein mediated efflux, and first-pass metabolism, all of which can further reduce systemic exposure [78].
Formulation Strategies for Bioavailability Enhancement
Formulation scientists have developed a diverse arsenal of techniques to address bioavailability challenges. These approaches can be broadly categorized into physical modifications, chemical modifications, and advanced drug delivery systems.
Physical Modification Approaches
Physical modification techniques alter the physicochemical properties of drugs without changing their chemical structure, primarily focusing on enhancing dissolution rates.
Particle Size Reduction: Conventional micronization (2-5 μm) and nanocrystal technology (100-250 nm) increase the surface area available for solubilization, thereby enhancing dissolution rates [80] [75] [78]. Techniques include jet milling, high-pressure homogenization, and media milling [78]. Nanosuspensions represent an advanced application of this approach, creating colloidal dispersions of drug nanoparticles stabilized by surfactants [78].
Solid Dispersion Systems: These systems incorporate the drug into hydrophilic polymer matrices to create amorphous formulations with enhanced solubility [79] [78]. Technologies include spray drying, hot-melt extrusion, and solvent evaporation [78]. These systems often use specialized polymers such as HPMC, HPMCAS, PVP, and PVP-VA which inhibit recrystallization and maintain the drug in its high-energy amorphous state [79].
Crystal Engineering: This approach involves modifying the crystalline habit of a drug to improve its solubility profile [75]. Techniques include creating amorphous forms (lacking long-range crystal order) and pharmaceutical co-crystals (crystalline materials consisting of two or more molecular species in a defined stoichiometric ratio) [75].
Chemical Modification Approaches
Chemical modification strategies alter the drug's molecular structure to improve its pharmacokinetic properties.
Salt Formation: Converting ionizable drugs into salt forms enhances aqueous solubility through improved ionization and dissolution characteristics [80] [75]. For example, a basic compound formulated as a salt is ionized in stomach acid, making it soluble, but becomes unionized in the intestinal environment, facilitating permeability across lipophilic membranes [75].
Prodrug Design: Prodrugs are pharmacologically inactive derivatives of active drugs that undergo enzymatic or chemical transformation in vivo to release the active moiety [74] [78]. This approach can overcome various pharmaceutical and pharmacokinetic barriers, such as poor solubility, low permeability, or rapid pre-systemic metabolism [78]. Notable examples include valacyclovir (a prodrug of acyclovir) which demonstrates 3-5-fold greater bioavailability than the parent drug through enhanced absorption via peptide transporters [78].
Lipid-Based Drug Delivery Systems
Lipidic formulations have emerged as a particularly promising approach for improving the gastrointestinal absorption of poorly water-soluble compounds [80]. The Lipid Formulation Classification System (LFCS) categorizes these systems based on their composition and dispersion properties:
Table 2: Classification of Lipid-Based Formulation Systems
| Formulation Type | Composition | Dispersion Particle Size | Key Characteristics | Examples/References |
|---|---|---|---|---|
| Type I | 100% triglycerides or mixed glycerides | Coarse | Non-dispersing; requires digestion; GRAS status | [80] |
| Type II | 40-80% triglycerides + 20-60% water-insoluble surfactants (HLB < 12) | 250-2000 nm | Self-emulsifying without water-soluble components | [80] |
| Type IIIA | 40-80% triglycerides + 20-40% water-soluble surfactants (HLB > 11) + 0-40% cosolvents | 100-250 nm | SEDDS with water-soluble components; some loss of solvent capacity on dispersion | [80] |
| Type IIIB | <20% triglycerides + 20-50% water-soluble surfactants + 20-50% cosolvents | 50-100 nm | SMEDDS with water-soluble components and low oil content; significant phase changes on dilution | [80] |
| Type IV | Oil-free: 0-20% water-insoluble surfactants + 30-80% water-soluble surfactants + 0-50% cosolvents | <50 nm | Oil-free formulations that disperse to micellar solution; potential loss of solvent capacity on dispersion | [80] |
Self-Emulsifying Drug Delivery Systems (SEDDS) and Self-Microemulsifying Drug Delivery Systems (SMEDDS) represent particularly effective lipid-based approaches [80]. These isotropic mixtures of oils, surfactants, and cosolvents form fine oil-in-water emulsions or microemulsions upon mild agitation in the gastrointestinal tract, presenting the drug in a dissolved state and avoiding the slow dissolution process that typically limits the bioavailability of hydrophobic drugs [80].
Diagram 1: Mechanism of Lipid-Based Self-Emulsifying Formulations. These systems spontaneously form fine dispersions in the GI tract, enhancing drug absorption by maintaining the drug in a dissolved state.
Nanotechnology Approaches
Nanotechnology has emerged as one of the most promising avenues for improving drug bioavailability through various mechanisms:
Nanoparticles and Nanocrystals: These systems increase dissolution velocity and saturation solubility through enormous surface area enhancement, with typical particle sizes ranging from 100-1000 nm [78]. Additionally, nanocrystals can adhere to the gastrointestinal mucosa, prolonging residence time and further enhancing absorption [78].
Liposomes: These phospholipid-based vesicles can encapsulate both hydrophilic and hydrophobic drugs, protecting them from degradation and potentially enhancing cellular uptake [80] [78].
Solid Lipid Nanoparticles (SLNs) and Nanostructured Lipid Carriers (NLCs): These particulate carriers combine advantages of various traditional carriers while minimizing their drawbacks, offering improved physical stability, controlled release capabilities, and potential for large-scale production [79] [78].
Table 3: Nanotechnology-Based Approaches for Bioavailability Enhancement
| Technology | Typical Size Range | Mechanism of Action | Advantages | Limitations |
|---|---|---|---|---|
| Nanosuspensions | 100-1000 nm | Increased surface area for dissolution; adhesion to GI mucosa | Suitable for high drug loading; applicable to various administration routes | Physical stability concerns; potential for crystal growth |
| Polymeric Nanoparticles | 50-500 nm | Encapsulation for protection; controlled release; surface functionalization for targeting | Versatile design options; potential for targeted delivery | Complex manufacturing; polymer biocompatibility considerations |
| Solid Lipid Nanoparticles (SLNs) | 50-1000 nm | Biocompatible lipid matrix for solubilization; controlled release | Excellent biocompatibility; scale-up feasibility | Limited drug loading; potential drug expulsion during storage |
| Liposomes | 50-500 nm | Phospholipid bilayers encapsulating hydrophilic and hydrophobic compounds | Enhanced permeability and retention effect; flexible drug loading | Stability challenges; rapid clearance in some cases |
| Polymeric Micelles | 10-100 nm | Core-shell structure with hydrophobic core for solubilization | High solubilization capacity; potential for passive targeting | Low loading capacity for some drugs; stability at dilution |
Experimental Methodologies and Optimization Approaches
The development of optimized drug delivery systems requires systematic methodologies for formulation screening, characterization, and optimization.
Systematic Formulation Development Using Design of Experiments (DoE)
Traditional formulation development approaches that change one variable at a time are inefficient and may fail to identify true optimal compositions [81]. Design of Experiments (DoE) represents a systematic optimization approach that evaluates multiple variables simultaneously through structured experimental designs [81]. The key elements of a DoE optimization methodology include:
- Planning Study Objectives: Defining critical quality attributes and target product profile
- Screening Influential Variables: Identifying factors with significant impact on formulation performance
- Experimental Design: Implementing structured design matrices (e.g., factorial, response surface, mixture designs)
- Mathematical Modeling: Postulating relationships between factors and responses
- Model Validation: Confirming predictive capability through verification experiments [81]
This approach enables formulators to efficiently navigate complex multivariate formulation spaces, understand factor interactions, and establish robust design spaces for quality assurance [81].
In Vitro and In Vivo Evaluation Methods
Comprehensive characterization of optimized formulations involves a series of rigorous in vitro and in vivo assessments:
Solubility and Dissolution Testing: Determination of equilibrium solubility in various media and dissolution profiling under physiologically-relevant conditions [79]. For lipid-based systems, dilution and digestion tests evaluate the potential for drug precipitation upon dispersion in the gastrointestinal environment [80].
Permeability Assessments: Using cell culture models (e.g., Caco-2, MDCK) or artificial membranes to predict intestinal absorption potential [78].
Solid-State Characterization: For solid dispersions and other amorphous systems, techniques including X-ray diffraction (XRPD), differential scanning calorimetry (DSC), and spectroscopy (FTIR, Raman) are essential for confirming amorphous state and physical stability [79] [78].
In Vivo Pharmacokinetic Studies: Animal studies to evaluate bioavailability, exposure profiles, and food effects, with careful correlation to in vitro performance [77] [76].
Diagram 2: Systematic Formulation Development Workflow. This structured approach begins with comprehensive API characterization and progresses through strategy selection, optimization, characterization, and eventual scale-up.
The Scientist's Toolkit: Key Research Reagents and Materials
Table 4: Essential Research Reagents and Materials for Bioavailability Enhancement Studies
| Category | Specific Examples | Function and Application | References |
|---|---|---|---|
| Lipid Excipients | Medium-chain triglycerides, Mono- and diglycerides, Mixed glycerides | Lipid phase for SEDDS/SMEDDS; enhance lymphatic transport | [80] |
| Surfactants | Polysorbates (Tween), Polyoxyl castor oil (Cremophor), Labrasol | Emulsification and solubilization in lipid systems; enhance permeability | [80] |
| Cosolvents | PEG, Propylene glycol, Ethanol, Transcutol | Increase solvent capacity for drugs in lipid formulations | [80] |
| Polymeric Carriers | HPMC, HPMCAS, PVP, PVP-VA, Copovidone | Matrix formers for solid dispersions; inhibit crystallization | [79] |
| Cyclodextrins | HP-β-CD, SBE-β-CD, γ-Cyclodextrin | Molecular encapsulation for solubility enhancement via complexation | [80] [78] |
| Permeation Enhancers | Sodium caprate, Fatty acids, Bile salts | Temporarily increase membrane permeability for improved absorption | [80] |
| Stabilizers | Poloxamers, Vitamin E TPGS, SLS | Prevent aggregation in nanosystems; enhance physical stability | [79] [78] |
Emerging Trends and Future Perspectives
The field of pharmacokinetic optimization continues to evolve with several emerging technologies and approaches:
Model-Informed Formulation Development: The use of physiologically based biopharmaceutics modeling (PBBM) and other computational approaches to predict in vivo performance based on in vitro data [77]. Simulation techniques including molecular dynamics (MD), finite element analysis (FEA), and computational fluid dynamics (CFD) are increasingly employed to understand drug behavior and optimize delivery systems [82].
Advanced Nanocarrier Systems: Next-generation nanoparticles with stimuli-responsive properties and surface functionalization for active targeting [78] [82]. These systems can respond to specific physiological triggers (pH, enzymes) to release their payload at the desired site of action.
3D Printing and Personalized Medicines: Additive manufacturing technologies enabling the production of tailored dosage forms with complex release profiles matched to individual patient needs [82].
Hybrid Formulation Technologies: Combinations of multiple approaches (e.g., lipid-polymer hybrid nanoparticles, solid dispersions in self-emulsifying systems) to address multiple bioavailability barriers simultaneously [83].
The integration of these advanced technologies with systematic formulation approaches promises to further enhance our ability to develop optimized drug delivery systems with precisely controlled pharmacokinetic profiles.
The optimization of pharmacokinetics through advanced formulation strategies represents a critical component of the modern drug development paradigm. As the proportion of poorly soluble drug candidates continues to increase, the strategic application of bioavailability enhancement technologies becomes increasingly essential for converting promising therapeutic molecules into viable medicines. By systematically addressing the fundamental challenges of solubility, permeability, and stability through physical, chemical, and delivery system-based approaches, formulation scientists can significantly impact the clinical success and therapeutic value of new pharmaceutical products. The continued advancement and intelligent application of these technologies, guided by fundamental pharmacokinetic principles and systematic development methodologies, will remain crucial for meeting the evolving challenges of drug delivery in the coming decades.
Embracing Hybrid Trial Models and AI for Protocol Optimization and Enhanced Patient Engagement
The drug development process is a rigorous, multi-stage journey from discovery to post-market surveillance, historically characterized by high costs, inefficiencies, and high attrition rates [84] [14]. A significant challenge lies in clinical trials, which face persistent problems with patient recruitment, enrollment, data quality, and generalizability [85]. The convergence of Artificial Intelligence (AI) and hybrid clinical trial models is now revolutionizing this landscape. These technologies and approaches offer a paradigm shift towards more efficient, patient-centric, and data-driven research [86]. By integrating decentralized methods with AI-driven insights, sponsors can optimize protocols, enhance patient engagement, and ultimately improve the success rate of bringing new therapies to patients [87]. This transformation is situated within the broader thesis of modern drug discovery, which increasingly relies on quantitative and systems pharmacology to integrate mechanistic and clinical data for better decision-making [88].
AI-Driven Protocol Optimization and Trial Design
AI is moving beyond automation to become a core tool for optimizing trial design and execution. Its application ranges from refining eligibility criteria to enabling complex, self-optimizing trial architectures.
Quantitative Foundations: Model-Based Drug Development
The conceptual foundation for using models in development is not new. Model-based drug development (MBDD) is a paradigm that promotes the use of modeling to delineate the path and focus of drug development, where models serve as both the instruments and the aims [84]. This approach is complemented by Quantitative and Systems Pharmacology (QSP), an integrative approach that uses mathematical models based on biology, pharmacology, and physiology to quantify drug-patient interactions [88]. QSP employs a "learn and confirm" paradigm, where experimental findings are systematically integrated into mechanistic models to generate and test hypotheses [88].
Key AI Applications for Protocol Optimization
- Eligibility Criteria Optimization: Restrictive eligibility criteria often exclude significant portions of the real-world patient population. ML algorithms like Trial Pathfinder can analyze historical trial data and Real-World Data (RWD) to identify criteria that have minimal impact on trial outcomes or patient safety. In one analysis of Phase III lung cancer trials, this data-driven approach doubled the pool of eligible patients on average without compromising safety [85].
- Adaptive Trial Designs Enhanced by AI: Adaptive designs allow pre-planned modifications to trial protocols based on interim data. AI enhances this by using reinforcement learning, decision trees, and neural networks to rapidly analyze incoming data and inform real-time adjustments to parameters like treatment arms or patient allocation [85]. This creates a "fail-fast" capability, ensuring resources are focused on the most promising interventions.
- Digital Twins and Synthetic Control Arms: A Digital Twin (DT) is a dynamic virtual representation of an individual patient or a patient population, created from RWD and computational modeling [85]. In clinical trials, DTs can be used to generate synthetic control arms, where simulated patient data replaces or augments actual control groups. This can optimize recruitment, reduce the burden on patients who would otherwise receive placebo, and allow for more efficient exploration of trial designs in silico [85].
- Self-Optimizing Trials: The next leap in trial delivery is the move from automation to self-optimization. These trials use simulation models to predict disruptions before they happen, automate data validation for accelerated compliance, and feature an AI orchestration layer to enable real-time intelligence across trial management systems [87]. This allows trials to self-adjust in response to emerging data.
Experimental Protocol for AI-Driven Eligibility Optimization
Objective: To broaden eligibility criteria for a clinical trial using a machine learning algorithm without compromising safety or statistical integrity.
Methodology:
- Data Acquisition: Obtain de-identified data from a completed Phase III trial (e.g., one of the aNSCLC trials like FLAURA or KEYNOTE-189) [85]. In parallel, acquire a large, curated Real-World Data (RWD) database, such as the Flatiron Health EHR database, containing records of patients with the same condition [85].
- Model Application: Apply an ML algorithm (e.g., Trial Pathfinder) to the RWD cohort. The algorithm systematically applies the original trial's eligibility criteria to the RWD population and then relaxes specific laboratory or clinical history criteria one by one [85].
- Outcome Simulation: For each relaxed criterion set, the model simulates the hypothetical outcome (e.g., hazard ratio for overall survival) that would have been observed if the broader population had been enrolled [85].
- Impact Assessment: Identify which criteria, when broadened, have a minimal impact on the predicted trial outcome. The goal is to find the set of criteria that maximizes patient pool expansion while maintaining the trial's safety and efficacy profiles.
- Validation: The proposed broadened criteria should be reviewed by clinical experts for feasibility and validated against holdout datasets or through prospective pilot studies.
Table: Quantitative Impact of AI-Driven Eligibility Optimization in Retrospective Analysis
| Trial Name | Original Eligible Patient Pool | Expanded Eligible Patient Pool | Percentage Increase | Impact on Key Efficacy Endpoint |
|---|---|---|---|---|
| FLAURA (Example) | X Patients | ~2X Patients | ~100% | Minimal change in OS HR [85] |
| KEYNOTE-189 (Example) | X Patients | ~2X Patients | ~100% | Minimal change in OS HR [85] |
| CheckMate 017 (Example) | X Patients | ~2X Patients | ~100% | Minimal change in OS HR [85] |
AI-Driven Eligibility Optimization Workflow
Implementing the Hybrid and Decentralized Clinical Trial Model
The hybrid decentralized clinical trial (DCT) model blends traditional site-centric visits with remote and local care options, placing the patient at the center of the research process [86].
Core Characteristics and Benefits
Hybrid models are defined by patient empowerment, allowing participation with reduced travel burden, and the leveraging of technology such as telehealth, remote monitoring devices, and mobile applications for real-time data collection [86]. The primary benefits include improved patient access and convenience, which can enhance recruitment and retention, and the generation of more comprehensive real-world data through continuous remote monitoring [86].
Operational Framework and Key Technologies
The operational success of a hybrid trial relies on integrating several digital tools and support systems:
- Digital Patient Engagement Platforms: Comprehensive mobile applications that consolidate multiple functions into a single interface are critical. These should include electronic consent (eConsent), training modules, electronic patient-reported outcomes (ePRO), and electronic clinical outcome assessments (eCOA) [89] [90].
- Remote Monitoring and Data Collection: Wearable devices and sensors collect physiological data directly from patients in their homes. BYOD ("Bring Your Own Device") policies can further reduce barriers by allowing patients to use their familiar smartphones, leading to greater compliance [90].
- Virtual Site Teams and Support: Technology must be paired with accessible human support. A responsive virtual site team that can address patient questions, provide tech support, and monitor for adverse events via chat or video call is essential for maintaining trust and engagement [90].
Experimental Protocol for a Hybrid Trial Workflow
Objective: To implement and evaluate a hybrid clinical trial model for a chronic condition, comparing patient retention and data completeness against a historical traditional trial control.
Methodology:
- Protocol Design:
- Define which study activities are site-based (e.g., drug infusion, complex imaging) and which can be decentralized (e.g., patient-reported outcomes, vital signs monitoring, video consultations) [86].
- Select and validate digital tools (ePRO platform, wearable devices) for remote data collection. Ensure interoperability between systems.
- Patient Onboarding:
- Trial Execution and Monitoring:
- Patients perform remote tasks as per the protocol, with data flowing to a central database.
- A virtual site team monitors incoming data on dashboards for compliance, safety signals (e.g., missed entries, adverse events), and provides proactive support via in-app chat or phone [90].
- Schedule and conduct periodic tele-visits for assessments that can be done remotely.
- Metrics and Evaluation:
- Primary Endpoints: Patient retention rate at trial end; data completeness rate (percentage of expected data points captured).
- Secondary Endpoints: Patient satisfaction scores (via survey); time to complete enrollment; cost per patient compared to traditional model.
Hybrid Trial Operational Ecosystem
Strategies for Enhanced Patient Engagement and Retention
Patient engagement is the active, informed involvement of participants in their clinical journey, and it is a decisive factor for trial success, directly impacting data quality and dropout rates [89].
The Motivation Framework: The "4 Cs"
A comprehensive engagement strategy can be built around four key motivators, the "4 Cs":
- Control: Giving patients a sense of agency through clear timelines and progress tracking.
- Contribution: Reinforcing the value of their role in advancing science.
- Context: Helping them understand how their efforts fit into the bigger picture.
- Retention: The ultimate goal, achieved by mastering the first three Cs [90].
Applied Behavioral Science and Digital Tools
- Gamification: Applying game-design elements like point-scoring, badges, and progress trackers can make completing study tasks more engaging and enjoyable, activating the brain's natural reward pathways [89] [90].
- Frictionless Design: Adhere to the "principle of least effort" by designing user interfaces with one-finger gestures, clear visual cues, and intuitive flows that minimize cognitive load [90]. A BYOD model is a key part of this strategy [90].
- Strategic Compensation: Financial remuneration is a powerful extrinsic motivator. A transparent and structured compensation schedule, potentially with milestone bonuses, should be integrated into the platform [90].
Experimental Protocol for Measuring Engagement
Objective: To quantify the effect of a multi-faceted digital engagement strategy on patient retention and data compliance in a Phase III hybrid trial.
Methodology:
- Intervention Arm Design:
- Platform: A single, integrated mobile app with ePRO, training, and communication features.
- Gamification: Implement a system of points and badges for on-time task completion.
- Support: Enable 24/7 access to a knowledgeable virtual site team via in-app chat.
- Communication: Send automated, personalized reminders and progress updates.
- Control Arm: Standard trial support, which may include a basic ePRO system and traditional site-based support without gamification or proactive virtual support.
- Measurement and Analysis:
- Primary Metrics: Retention rate at study end; ePRO compliance rate (percentage of tasks completed on time).
- Secondary Metrics: Time from enrollment to first missed task; patient satisfaction scores.
- Statistical Analysis: Compare primary metrics between intervention and control arms using chi-square tests. Analyze time-to-event data (e.g., dropout) using Kaplan-Meier curves and log-rank tests.
Table: Key Performance Indicators for Patient Engagement Strategies
| Engagement Strategy | Key Performance Indicator (KPI) | Target Outcome |
|---|---|---|
| Gamification & Motivational Tools | Participant points earned; Badges unlocked | Increased task compliance; Higher subjective enjoyment scores |
| Intuitive UX/BYOD Model | Task completion time; User error rate | Reduced time per task; Fewer support tickets related to usability |
| Proactive Virtual Support | Time to first response to patient query; Chat utilization rate | High patient satisfaction (>90%); Early detection of adverse events |
| Structured Compensation | Milestone completion rate (e.g., Week 4, Week 12) | Improved long-term retention (>80%) |
The Scientist's Toolkit: Essential Research Reagents and Materials
Implementing AI-driven hybrid trials requires a suite of technological and methodological "reagents."
Table: Essential Reagents for AI-Optimized Hybrid Trials
| Research Reagent / Tool | Function / Application | Example |
|---|---|---|
| Machine Learning Algorithm | Optimizes eligibility criteria by analyzing RWD and historical trial data. | Trial Pathfinder [85] |
| Reinforcement Learning Model | Enables real-time adaptation in adaptive trial designs by analyzing interim data. | AI algorithms for arm selection [85] |
| Digital Twin (DT) Platform | Creates virtual patients or populations for simulating trial designs and generating synthetic control arms. | Mechanistic or AI-based patient models [85] |
| Integrated Patient Engagement Platform | Consolidates patient-facing functions (eConsent, ePRO, training, communication) into a single application. | ACTide, ObvioHealth platform [89] [90] |
| Remote Monitoring Devices | Collects physiological and activity data directly from patients in a decentralized setting. | Wearable sensors, connected spirometers [86] |
| Cloud Computing Infrastructure | Provides the scalable computational power needed for complex AI simulations and data storage. | AWS, Google Cloud, Microsoft Azure [85] |
| Real-World Data (RWD) Source | Provides longitudinal, real-world patient data for model training and external control arms. | Flatiron Health EHR Database [85] |
The integration of AI-driven optimization and the hybrid decentralized model represents a fundamental evolution in clinical research, firmly anchored in the quantitative principles of modern drug development [88]. This synergy addresses core inefficiencies in protocol design, patient recruitment, and engagement, transforming trials from static, site-centric processes into dynamic, patient-centric, and self-optimizing systems [86] [87]. For researchers and drug development professionals, embracing these technologies is no longer a forward-looking concept but a present-day imperative. The future of clinical trials lies in leveraging AI and hybrid models not as isolated tools, but as an interconnected framework to generate robust evidence more efficiently, making better therapies available to patients faster.
Mitigating Bias and Ethical Risks in AI Models for Fair and Representative Outcomes
The integration of artificial intelligence (AI) is revolutionizing traditional drug discovery and development models by seamlessly integrating data, computational power, and algorithms to enhance efficiency, accuracy, and success rates [91]. This technological revolution promises to compress the traditional decade-long development path, reducing both time and the immense costs associated with bringing a new drug to market [92] [93]. However, this great opportunity comes with significant risks. AI systems can perpetuate and even amplify existing societal and historical biases, leading to unfair outcomes and posing serious ethical challenges in the highly regulated biomedical field [94] [95]. Biased AI in healthcare can lead to discrimination, inequality, and unfair treatment of marginalized groups, potentially resulting in diagnostic algorithms that perform poorly for underrepresented populations or treatment recommendations that reflect historical healthcare inequities [94] [96]. Therefore, mitigating bias is not merely a technical exercise but a fundamental prerequisite for ensuring that AI-driven drug development is both innovative and equitable, ultimately serving the health needs of all patient populations.
Understanding AI Bias: Typology and Manifestations in Drug Development
Bias in AI systems refers to systematic and unfair discrimination that arises from the design, development, and deployment of AI technologies [94]. In the context of drug discovery, where decisions can directly impact patient safety, understanding the origins and types of bias is critical. Bias can manifest in various forms, each with profound implications for the fairness and representativeness of AI models.
Core Types of AI Bias
- Data Bias: This occurs when the data used to train AI models is unrepresentative or flawed [94]. For instance, if a model is trained predominantly on genetic or clinical data from populations of European ancestry, it will likely perform poorly when applied to other demographic groups [96]. An example is medical imaging systems that demonstrate lower accuracy for minority patients due to training data that predominantly features lighter-skinned individuals [96].
- Algorithmic Bias: This bias arises from the design and implementation of the algorithms themselves. Even with unbiased data, the way algorithms process information can introduce bias if they are optimized for efficiency without considering fairness [94]. This can result in discriminatory practices, such as a clinical trial design algorithm that inadvertently excludes certain patient subgroups.
- Human Bias: Human bias can seep into AI systems through the decisions made by developers, data scientists, and stakeholders [94]. The implicit biases of individuals involved in the AI lifecycle can influence data selection, feature engineering, and model evaluation, perpetuating existing inequalities. A lack of diversity on development teams can exacerbate this problem, as team members may have blind spots regarding the needs and characteristics of underrepresented groups [96].
It is crucial to differentiate between genuine AI bias and the reflection of real-world distributions. AI outcomes may accurately mirror societal realities or existing biological trends rather than indicate bias. For example, if historical data indicates that certain demographic groups have a higher prevalence of a specific health condition due to genetic or socioeconomic factors, an AI's prediction of higher risks for individuals from that group may reflect an actual health trend rather than a biased model [94]. Conducting thorough analyses is essential to determine the root cause of observed disparities.
The Impact of Biased AI in Biomedicine
The consequences of biased AI in drug development are far-reaching and potentially devastating.
- Perpetuation of Health Disparities: Biased AI can worsen existing health inequalities. For example, during the COVID-19 pandemic, pulse oximeter algorithms showed significant racial bias, overestimating blood oxygen levels in Black patients. This led to delayed treatment decisions and contributed to worse outcomes in vulnerable communities [96].
- Erosion of Trust and Legal Risk: The outcomes from biased AI can erode trust in medical institutions and technology [94]. Furthermore, organizations deploying biased systems may face legal repercussions, ethical dilemmas, and financial penalties. Regulatory bodies like the FDA are now paying closer attention to these issues, and compliance risks are growing [96] [93].
- Compromised Drug Safety and Efficacy: Perhaps the most direct risk is to patient safety. If an AI-driven diagnostic tool is less accurate for an underrepresented population, it can lead to misdiagnoses or inadequate treatment recommendations [94]. Similarly, biased patient recruitment algorithms for clinical trials can lead to unrepresentative trial populations, compromising the understanding of a drug's safety and efficacy across the full spectrum of future patients.
A Proactive Framework for Mitigating AI Bias
Mitigating AI bias requires a human-centric, multi-pronged approach that spans the entire AI lifecycle and the various stages of drug development [94]. A reactive strategy is insufficient; a proactive, integrated framework is necessary to foster fairness and drive equitable outcomes.
Technical Mitigation Strategies
- Data Auditing and Curation: The first line of defense is ensuring training data is representative and fair. This involves conducting rigorous data audits to assess representation across relevant demographic groups, disease subtypes, and genetic backgrounds [94]. For facial recognition or dermatological AI, this means training on diverse datasets that include various skin tones, ages, genders, and ethnic backgrounds [94]. In drug discovery, this translates to ensuring genetic datasets, such as those used for target identification, include global populations and not just privileged ones. Techniques to address class imbalances in data are also crucial [93].
- Algorithmic Fairness and Testing: Mitigation must extend to the algorithm itself. This involves re-evaluating algorithms with fairness metrics in mind, not just predictive accuracy [94]. Techniques include implementing bias-aware modeling and using adversarial debiasing to remove sensitive attributes from model considerations. Algorithmic transparency is a key requirement from regulators; the European Medicines Agency (EMA), for instance, expresses a preference for interpretable models but acknowledges "black-box" models if justified by superior performance and accompanied by explainability metrics [93].
- Continuous Monitoring and Validation: AI models can "drift" after deployment, and their performance must be continuously monitored [94]. This is part of post-market safety monitoring, a critical phase in drug development [12]. Establishing a benchmark to regularly test for performance regressions or emerging biases is essential [97]. The EMA's framework for post-authorization allows for continuous model enhancement but mandates ongoing validation and performance monitoring, integrated within established pharmacovigilance systems [93].
Operational and Governance Protocols
- Interdisciplinary Collaboration: Effective bias mitigation cannot be achieved by data scientists alone. It requires interdisciplinary collaboration between AI experts, biologists, clinical researchers, and ethicists [94] [95]. This ensures that decisions are grounded in the appropriate societal and biological contexts and that potential blind spots are identified early.
- Human Oversight and Review: Perhaps the most critical mitigation strategy is ensuring meaningful human oversight [97]. Humans must be "in the loop" to review AI outputs, especially for high-stakes decisions in areas like patient recruitment, safety prediction, and diagnostic support. This human review is a final safeguard against automated discrimination.
- Clear Accountability and Ethical Frameworks: Organizations must build a culture of responsibility by creating clear accountability mechanisms [95]. This includes developing internal guidelines and ethical frameworks for AI development and use. A framework proposed by Stanford researchers recommends that organizations embed protective measures, including restricted access to models, audits of foundational data, and a level of transparency [95].
The following table summarizes the core strategies for mitigating AI bias throughout the development lifecycle:
Table 1: AI Bias Mitigation Strategies Across the Development Lifecycle
| Lifecycle Stage | Primary Goal | Specific Mitigation Strategies |
|---|---|---|
| Data Collection & Preprocessing | Ensure representative and unbiased training data. | - Conduct pre-collection data audits for representativeness [94]- Implement synthetic data generation to fill gaps [95]- Apply re-sampling techniques to address class imbalances [93] |
| Model Training & Development | Design and train fair algorithms. | - Incorporate fairness constraints and metrics into objective functions [94]- Use adversarial debiasing techniques- Conduct "red teaming" or simulated adversarial testing [95] |
| Pre-deployment Validation | Rigorously assess model for biased outcomes before use. | - Perform rigorous validation on diverse, held-out test sets [96]- Validate against standardized benchmark tests [97]- Engage interdisciplinary teams for review [92] |
| Deployment & Monitoring | Maintain model fairness and performance in real-world use. | - Establish continuous performance and fairness monitoring systems [94]- Maintain human-in-the-loop oversight for critical decisions [97]- Implement model update and retraining protocols [93] |
Experimental Protocols for Bias Detection and Mitigation
To translate mitigation strategies into practice, researchers need concrete, actionable experimental protocols. The following section provides detailed methodologies for key experiments and analyses crucial for identifying and countering bias in AI models for drug discovery.
Protocol: Pre-Collection Data Audit for Representativeness
Objective: To systematically evaluate the composition of a proposed training dataset before model training begins, identifying potential gaps in representation that could lead to bias.
Methodology:
- Define Relevant Demographic and Clinical Axes: Identify the patient or sample characteristics most relevant to the disease and drug mechanism. These typically include genomic ancestry, sex, age, socioeconomic status (if available), and disease subtype [96].
- Establish Target Proportions: Determine the ideal distribution of these characteristics based on the global disease prevalence or the intended patient population for the drug. Use public health databases (e.g., WHO, CDC) and epidemiological studies as references.
- Quantitative Analysis: Statistically compare the distributions of each characteristic in the candidate dataset against the target proportions. Use tests like Chi-squared to identify significant under-representation or over-representation of any group.
- Gap Analysis Report: Produce a report detailing the findings, highlighting axes with significant representation gaps (e.g., "Dataset contains <5% of samples from African ancestry populations, despite this group bearing 15% of the global disease burden").
Protocol: Bias Testing via Subgroup Performance Analysis
Objective: To evaluate a trained AI model's performance across different demographic subgroups to uncover performance disparities that indicate algorithmic bias.
Methodology:
- Stratified Test Set Creation: Partition a held-out test set (not used in training) into subgroups based on the axes defined in Protocol 4.1 (e.g., "Female, Age 65+, European Ancestry").
- Performance Metric Calculation: Run the model on the entire test set and then calculate key performance metrics (e.g., Area Under the Curve (AUC), precision, recall, F1-score) separately for each subgroup [96].
- Disparity Measurement: Compare the performance metrics across subgroups. A significant drop in performance for any subgroup indicates potential bias. For example, a dermatology AI model showing a 95% AUC for light skin tones but only 75% for dark skin tones demonstrates clear performance disparity [96].
- Benchmarking and Reporting: Document all subgroup performances. Establish a pre-defined maximum allowable performance gap (e.g., "No subgroup AUC shall be more than 0.10 below the overall AUC") as a benchmark for model fairness.
Protocol: Adversarial Debiasing in Feature Space
Objective: To technically remove the influence of a sensitive attribute (e.g., race, gender) from the model's predictions without drastically reducing overall accuracy.
Methodology:
- Sensitive Attribute Identification: Select the protected attribute (e.g., genomic principal component correlated with ancestry) that should not influence the model's prediction.
- Adversarial Network Setup: Implement a dual-model architecture. The first, the "predictor" model, is trained for the primary task (e.g., predicting drug response). The second, the "adversary" model, tries to predict the sensitive attribute from the internal representations (features) of the predictor model.
- Adversarial Training Loop: Train the two models simultaneously with opposing goals. The predictor model is trained to maximize performance on the primary task while minimizing the adversary's ability to predict the sensitive attribute. This forces the predictor to learn features that are informative for the task but uncorrelated with the sensitive attribute.
- Validation: After training, validate that the final predictor model's performance is balanced across subgroups (using Protocol 4.2) and that an external classifier can no longer accurately predict the sensitive attribute from the model's features.
The following workflow diagram illustrates the interconnected stages of a comprehensive bias mitigation strategy, from data preparation to ongoing monitoring.
Bias Mitigation Workflow
Implementing robust bias mitigation requires a suite of methodological and computational "reagents." The following table details essential components for a responsible AI workflow in drug discovery.
Table 2: Essential Reagents for Mitigating AI Bias in Drug Discovery
| Toolkit Component | Category | Primary Function | Application Example |
|---|---|---|---|
| Stratified Sampling Framework | Methodological | Ensures proportional representation of sub-populations in training data. | Intentionally oversampling genomic data from under-represented ancestries to create a balanced dataset for target identification [94]. |
| Fairness Metric Suite (e.g., Demographic Parity, Equalized Odds) | Analytical | Quantifies model fairness and performance disparities across subgroups. | Measuring if a clinical trial prediction tool has an equal false positive rate across racial groups before deployment [94] [96]. |
| Adversarial Debiasing Library (e.g., AIF360, Fairlearn) | Computational | Implements algorithms to remove dependence on sensitive attributes. | Training a model to predict drug toxicity without letting its predictions be influenced by gender, a protected attribute. |
| Synthetic Data Generation Engine | Computational | Generates realistic, privacy-preserving data to fill representation gaps. | Creating synthetic patient records for rare disease subtypes to augment a small dataset, improving model robustness [95]. |
| Model Card & Documentation Protocol | Governance | Provides standardized documentation of model performance, limitations, and fairness characteristics. | Creating a "datasheet" for an AI tool that clearly states it was validated on East Asian and European populations only, warning users of potential limitations elsewhere [93]. |
The integration of artificial intelligence into drug discovery holds immense promise for accelerating the development of life-saving therapies. However, this power must be harnessed with a steadfast commitment to fairness and ethical responsibility. As this guide has outlined, mitigating bias is not a single step but a continuous, integrated process that requires vigilance at every stage—from the initial data audit to post-market monitoring. By adopting a human-centric approach, leveraging rigorous technical and operational protocols, and fostering interdisciplinary collaboration, researchers and drug development professionals can ensure that AI serves as a force for equitable innovation. The ultimate goal is to create AI models that are not only powerful and efficient but also fair and representative, thereby ensuring that the benefits of AI-driven drug discovery are accessible to all segments of the global population.
Proving Efficacy and Value: Validation Frameworks and Comparative Analysis for Success
Biomarker Validation for Early Diagnosis and Patient Stratification in Oncology and Neurodegenerative Diseases
Biomarkers, defined as objectively measured characteristics that indicate normal biological processes, pathogenic processes, or responses to an exposure or intervention, have become indispensable tools in modern drug development [98]. In both oncology and neurodegenerative diseases, validated biomarkers address critical challenges in drug development, including subject selection for clinical trials, assessment of target engagement, and efficient measurement of disease progression [99] [100]. The biomarker validation process ensures that these biological measures provide reliable, reproducible, and clinically meaningful data to support regulatory decision-making and advance therapeutic development for complex diseases.
The validation pathway for biomarkers requires rigorous assessment of both analytical and clinical performance. According to the FDA's Biomarker Qualification Program, validation involves demonstrating that within a stated Context of Use (COU), a biomarker reliably supports a specific manner of interpretation and application in drug development [101]. This process is particularly crucial for early diagnosis and patient stratification, where biomarkers can identify pathological processes before clinical symptoms manifest and categorize heterogeneous diseases into molecularly distinct subgroups for targeted therapy. The growing emphasis on precision medicine across therapeutic areas has accelerated the development of novel biomarker technologies, including liquid biopsies in oncology and multi-omics approaches in neurodegenerative diseases [102] [103].
Foundational Principles of Biomarker Validation
Definitions and Regulatory Framework
Biomarker validation requires careful distinction between related but distinct concepts. Validation refers to the process of assessing the biomarker and its measurement performance characteristics to determine the range of conditions under which it will give reproducible and accurate data [104]. In contrast, qualification is the evidentiary process of linking a biomarker with biological processes and clinical endpoints, establishing its utility for a specific context of use [104] [105]. The Context of Use (COU) is a critical regulatory concept that defines how a biomarker should be implemented in drug development and the specific interpretation that can be drawn from its measurement [101].
The FDA's Biomarker Qualification Program outlines a rigorous, collaborative pathway for biomarker development consisting of three stages: Letter of Intent (LOI), Qualification Plan (QP), and Full Qualification Package (FQP) [98] [101]. This structured approach ensures that qualified biomarkers meet stringent standards for reliability and clinical relevance. It is important to note that biomarker qualification is independent of any specific test method, though reliable measurement techniques must be established [101].
Analytical Validation Requirements
Analytical validation establishes that an assay consistently measures the biomarker accurately and reliably. This process assesses multiple performance characteristics across different matrices and conditions to ensure reproducibility [105]. The key components of analytical validation include sensitivity, specificity, accuracy, precision, and reproducibility, with requirements varying based on the biomarker's intended application and the consequences of false results [105].
For biomarkers intended to support critical decisions in drug development, such as patient selection or as surrogate endpoints, more thorough validation is required. The "fit-for-purpose" approach recognizes that the extent of validation should be commensurate with the intended application, with increasing evidence needed as a biomarker progresses from exploratory use to application as a trial endpoint [105].
Clinical Validation and Qualification
Clinical validation establishes that a biomarker reliably predicts or measures a clinical endpoint or biological process of interest. This process requires demonstration of sensitivity (the biomarker's ability to detect true positives) and specificity (the biomarker's ability to distinguish true negatives) in the target population [104]. The clinical validation process must also address statistical concerns such as confounding variables, multiplicity issues, and within-subject correlation when multiple measurements are taken from the same individual [106].
The evidentiary standards for clinical qualification depend on the proposed context of use. For example, biomarkers intended for subject selection (identifying likelihood of future disease progression) require different evidence than those used as study outcomes (efficiently measuring disease progression) [99]. The stringency of validation requirements increases along the spectrum from exploratory biomarkers to surrogate endpoints, with the most rigorous standards applied to biomarkers intended to substitute for clinical outcomes [104].
Table 1: Key Performance Characteristics for Biomarker Validation
| Performance Characteristic | Definition | Importance in Validation |
|---|---|---|
| Sensitivity | Ability to correctly identify true positive cases | Critical for early detection and screening applications |
| Specificity | Ability to correctly identify true negative cases | Reduces false positives and unnecessary interventions |
| Accuracy | Closeness of measurements to true values | Ensures biomarker reflects true biological state |
| Precision | Reproducibility of measurements under unchanged conditions | Essential for reliable longitudinal monitoring |
| Robustness | Reliability under varying experimental conditions | Important for multisite clinical trials |
Biomarker Applications in Oncology
Established and Emerging Cancer Biomarkers
In oncology, biomarkers play crucial roles across the cancer care continuum, from early detection and diagnosis to prognosis, treatment selection, and therapeutic monitoring [102]. Traditional protein biomarkers such as carcinoembryonic antigen (CEA) for colorectal cancer, prostate-specific antigen (PSA) for prostate cancer, and cancer antigen 125 (CA-125) for ovarian cancer have been widely used but often disappoint due to limitations in sensitivity and specificity, resulting in overdiagnosis and/or overtreatment [102]. For example, PSA levels can rise due to benign conditions like prostatitis, leading to false positives and unnecessary invasive procedures [102].
Emerging biomarkers are transforming cancer detection and management. Circulating tumor DNA (ctDNA) has shown particular promise as a non-invasive biomarker that detects fragments of DNA shed by cancer cells into the bloodstream [102] [107]. ctDNA analysis can identify specific mutations in genes like KRAS, EGFR, and TP53 and has demonstrated utility in detecting various cancers—including lung, breast, and colorectal—at preclinical stages [102]. Multi-analyte blood tests combining DNA mutations, methylation profiles, and protein biomarkers—such as CancerSEEK—have demonstrated the ability to detect multiple cancer types simultaneously, with encouraging sensitivity and specificity [102].
Table 2: Categories of Cancer Biomarkers and Their Clinical Applications
| Biomarker Category | Examples | Clinical Applications | Limitations |
|---|---|---|---|
| Protein Biomarkers | CEA, PSA, CA-125, AFP | Screening, diagnosis, monitoring treatment response | Limited sensitivity and specificity; can be elevated in benign conditions |
| Genetic Mutations | KRAS, EGFR, TP53, BRAF V600 | Diagnosis, prognosis, treatment selection, minimal residual disease detection | Tumor heterogeneity; clonal evolution |
| Circulating Biomarkers | ctDNA, CTCs, miRNAs, exosomes | Early detection, monitoring treatment response, detecting recurrence | Low concentration in early-stage disease; technical challenges in isolation |
| Immunotherapy Biomarkers | PD-L1, MSI-H, TMB | Predicting response to immune checkpoint inhibitors | Dynamic expression; insufficient as sole predictors |
Biomarker-Driven Clinical Trial Designs in Oncology
Biomarker integration has enabled innovative clinical trial designs that accelerate oncology drug development. Enrichment designs enroll and randomize only biomarker-positive participants, making them ideal for situations where strong mechanistic rationale links a biomarker to treatment response [100]. This approach enables efficient signal detection but may result in narrower regulatory labels since biomarker-negative patients are never studied [100].
Stratified randomization designs enroll all patients but randomize within biomarker-positive and biomarker-negative subgroups, removing potential confounding when a biomarker is prognostic [100]. All-comers trials enroll both biomarker-positive and negative patients without stratification, assessing biomarker effects retrospectively, which is valuable for hypothesis generation [100]. Tumor-agnostic basket trials represent a paradigm shift, enrolling patients with biomarker-positive tumors across different cancer types into separate study arms, enabling efficient evaluation of targeted therapies across multiple indications [100].
Biomarker Applications in Neurodegenerative Diseases
Challenges and Advances in Neurodegeneration Biomarkers
Neurodegenerative diseases present unique challenges for biomarker development, including extended preclinical periods, heterogeneity in clinical presentation, common co-occurrence of multiple pathologies, and variability in progression rates [103]. Despite these challenges, significant progress has been made, particularly in Alzheimer's disease, where biomarkers of amyloid and tau pathology are now widely used [103]. However, there remains an urgent need for reliable biomarkers of other neurodegenerative pathologies, including α-synuclein, TDP-43, and non-AD tauopathies [103].
Large-scale collaborative efforts are addressing these challenges through standardized biomarker measurement and data sharing. The Global Neurodegeneration Proteomics Consortium (GNPC) has established one of the world's largest harmonized proteomic datasets, including approximately 250 million unique protein measurements from more than 35,000 biofluid samples [103]. This resource enables the identification of disease-specific differential protein abundance and transdiagnostic proteomic signatures of clinical severity, accelerating biomarker discovery across Alzheimer's disease, Parkinson's disease, frontotemporal dementia, and amyotrophic lateral sclerosis [103].
Validation Frameworks for Neurodegeneration Biomarkers
The MarkVCID consortium has established a rigorous framework for validating biomarkers of cerebral small vessel diseases (SVD) associated with cognitive impairment [99]. This approach involves targeted enrollment to enrich for participants with cognitive symptoms and defined risk factors, comprehensive baseline assessments including cognitive testing, multimodal magnetic resonance imaging (MRI), and biofluid collection, and longitudinal follow-up to validate candidate biomarkers for specific contexts of use [99].
This validation framework addresses two primary projected contexts of use: subject selection (identifying likelihood of future SVD progression) and study outcome (efficiently measuring SVD progression) [99]. The consortium's approach demonstrates successful enrollment of diverse individuals enriched in factors associated with SVD-related cognitive decline, with substantial recategorization of risk status after baseline MRI assessment, highlighting the importance of multimodal validation in heterogeneous neurodegenerative conditions [99].
Methodological Approaches and Experimental Protocols
Technology Platforms for Biomarker Discovery and Validation
Advanced technology platforms have dramatically expanded biomarker discovery capabilities across disease areas. In oncology, liquid biopsies analyze ctDNA or circulating tumor cells (CTCs) from blood samples, providing a non-invasive alternative to traditional tissue biopsies that permits both early detection and real-time monitoring [102]. Next-generation sequencing (NGS) enables comprehensive genomic profiling, detecting tumor mutations, fusions, and copy number alterations with high sensitivity and specificity [102].
In neurodegenerative diseases, high-dimensional proteomic platforms such as SomaScan, Olink, and mass spectrometry offer sufficient depth to capture a sizable portion of the circulating proteome [103]. Protein-level changes often capture biological processes proximal to neurodegeneration, providing functional insights directly relevant to disease pathogenesis [103]. The integration of artificial intelligence (AI) and machine learning (ML) is revolutionizing biomarker analysis across therapeutic areas by identifying subtle patterns in large datasets that human observers might miss, enabling integration of various molecular data types with imaging to enhance diagnostic accuracy [102].
Statistical Considerations in Biomarker Validation
Biomarker validation requires careful attention to statistical issues that can compromise result interpretation. Within-subject correlation must be accounted for when multiple observations are collected from the same subject, as analyzing such data assuming independent observations will inflate type I error rates and produce spurious findings of significance [106]. Mixed-effects linear models, which account for dependent variance-covariance structures within subjects, provide more realistic p values and confidence intervals for correlated biomarker data [106].
Multiplicity presents another significant challenge in biomarker validation studies, as the probability of false positive findings increases with each additional test performed [106]. This issue is particularly relevant when investigating large numbers of candidate biomarkers or multiple endpoints. Approaches to address multiplicity include controlling the family-wise error rate using methods such as Bonferroni correction, false discovery rate control, pre-specification of primary analyses, and development of composite endpoints [106]. Selection bias in retrospective studies must also be addressed through careful study design and analytical methods [106].
Research Reagent Solutions for Biomarker Validation
Table 3: Essential Research Reagents and Platforms for Biomarker Validation
| Reagent/Platform Category | Specific Examples | Primary Function in Validation |
|---|---|---|
| Proteomic Profiling Platforms | SomaScan, Olink, Mass Spectrometry | High-throughput protein measurement; discovery of protein signatures |
| Genomic Sequencing Platforms | Next-Generation Sequencing (NGS), Digital PCR | Detection of genetic variants, mutations, and copy number alterations |
| Immunoassay Reagents | ELISA kits, Multiplex Immunoassays, Electrochemical Biosensors | Targeted protein quantification with high sensitivity |
| Liquid Biopsy Components | ctDNA extraction kits, CTC capture devices, Exosome isolation reagents | Isolation and analysis of circulating biomarkers from biofluids |
| Reference Standards | Certified reference materials, Quality control samples | Assay calibration and standardization across laboratories |
Integration with Drug Development Processes
Biomarker Qualification Pathways
The formal biomarker qualification process through regulatory agencies like the FDA provides a pathway for establishing biomarkers for specific contexts of use in drug development. The Biomarker Qualification Program (BQP) operates through a three-stage submission process: Letter of Intent (LOI), Qualification Plan (QP), and Full Qualification Package (FQP) [101]. This collaborative process allows regulators to work with external stakeholders to develop biomarkers that are suited to a particular context of use, with feasible and reliable measurement, and analytical performance that adequately supports the stated application [101].
Qualification means that within a stated context of use, the biomarker has been demonstrated to reliably support a specified manner of interpretation and application in drug development [101]. Once qualified, the biomarker information is made publicly available and may be used in multiple drug development programs under its qualified context of use, potentially reducing uncertainty in regulatory decisions and accelerating therapeutic development [98].
Biomarker Applications Across the Drug Development Continuum
Biomarkers provide value throughout the drug development process, from target discovery and validation to clinical application. During target discovery and validation, biomarkers help identify and justify therapeutic targets, such as cellular growth factor receptors or signaling molecules [105]. In lead discovery and optimization, biomarkers determine target effects using target-associated assays to identify leads and evaluate molecular targeted drugs in preclinical development [105].
In preclinical studies, biomarkers play essential roles in validating animal disease models, assessing toxicity and safety, and establishing pharmacodynamic relationships [105]. During clinical trials, biomarker-based studies provide early evaluations of whether a drug is hitting its intended target, help optimize dose and schedule based on pharmacological effects, enable selection of appropriate patient populations, and serve as potential surrogate endpoints [105]. The integration of biomarkers into clinical trials has been particularly transformative in oncology, where biomarker-driven trials have become standard for targeted therapies and immunotherapies [100].
Biomarker validation for early diagnosis and patient stratification represents a cornerstone of precision medicine in both oncology and neurodegenerative diseases. The structured approaches to analytical validation, clinical qualification, and regulatory endorsement ensure that biomarkers provide reliable, actionable information for drug development and patient care. Emerging technologies—including liquid biopsies, multi-omics platforms, and artificial intelligence—are expanding the potential applications of biomarkers while also introducing new validation challenges.
Future progress will depend on continued collaboration among stakeholders, including academic researchers, pharmaceutical companies, regulatory agencies, and patient advocates. Large-scale data sharing initiatives, such as the Global Neurodegeneration Proteomics Consortium, demonstrate the power of collaborative science to accelerate biomarker discovery and validation [103]. In oncology, the evolution of biomarker-driven trial designs continues to refine patient selection strategies and endpoint assessment [100]. As biomarker science advances, the integration of validated biomarkers into drug development pipelines promises to enhance therapeutic targeting, improve clinical trial efficiency, and ultimately deliver more effective treatments to patients across disease areas.
The drug development process is notoriously protracted, costly, and afflicted by high attrition rates, with approximately 90% of candidates failing to achieve market approval [108] [109]. This translational gap between preclinical findings and clinical success represents a significant challenge for the pharmaceutical industry. Quantitative Systems Pharmacology (QSP) has emerged as a discipline that leverages mathematical models to characterize biological systems, disease processes, and drug pharmacology, thereby providing a mechanistic framework to improve decision-making [110] [111]. A pivotal innovation within QSP is the development of 'virtual patient' platforms, which simulate clinical trials using computer-generated cohorts, enabling the prediction of drug efficacy and safety across diverse populations [108] [112]. This whitepaper provides an in-depth technical guide to the core principles, methodologies, and applications of QSP and virtual patient technology, framing them within the foundational context of the drug discovery and development process.
The conventional drug development paradigm proceeds through distinct stages: target identification, preclinical research, and clinical trials (Phases I-IV) [109]. This process typically spans 12-15 years and costs in excess of $2.8 billion per marketed drug, with a failure rate of about 90% [108] [109]. Failures often occur due to inadequate efficacy or unanticipated safety issues in humans that were not predicted by animal models—a phenomenon known as the "translational gap" [72].
Quantitative Systems Pharmacology (QSP) addresses this gap by integrating mathematical modeling with systems biology and pharmacology. Unlike traditional pharmacokinetic/pharmacodynamic (PK/PD) models that describe what happens, QSP models seek to explain why it happens by mechanistically simulating the dynamic interactions between a drug and the biological system [110] [113] [114]. These models typically comprise systems of ordinary differential equations (ODEs) that depict the dynamical properties of drug-target interactions and their downstream effects on disease pathways [110] [111].
Core Principles of Quantitative Systems Pharmacology (QSP)
Definition and Components of a QSP Model
QSP is defined as a computational framework that simulates physiological and pathological processes involved in drug action. A QSP model integrates key components:
- Drug Properties: Dose, dosing regimen, pharmacokinetics (PK), and target engagement [110].
- Biological System: Target biology, downstream effectors at molecular, cellular, and pathophysiological levels, and functional endpoints [110] [114].
- Disease Physiology: The pathophysiological context of the disease, including multi-scale interactions from genes to whole-organism phenotypes [110].
By combining these elements, QSP provides a holistic "drug-disease" model that can predict the system's behavior under therapeutic intervention [113].
The QSP Workflow: From Data to Model
A robust QSP modeling workflow is essential for reproducible and predictive model development. The progressive maturation of a QSP model involves several interconnected stages [110]:
Diagram 1: The QSP modeling workflow, illustrating the progression from data handling to simulation and application.
- Data Programming and Standardization: Raw data from diverse sources (e.g., omics, clinical trials, literature) are converted into a standardized format. This creates a master dataset that is crucial for all subsequent modeling tasks, reducing errors and accelerating development [110].
- Data Exploration and Model Scoping: The standardized data is explored to assess trends, consistency across experiments, and key biological phenomena that the model must capture. This step informs the initial model structure and scope [110].
- Model Development and Parameter Estimation: Mathematical equations (e.g., ODEs) are constructed to represent the biological system. Parameter estimation is a cornerstone, often employing a multi-start strategy and profile likelihood methods to ensure robustness and identifiability [110].
- Model Qualification and Validation: The model is tested against independent datasets to qualify its predictive power. Techniques like the Fisher information matrix help assess parameter identifiability and confidence intervals [110].
- Application and Simulation: The qualified model is used to simulate scenarios, such as predicting patient responses, optimizing doses, or evaluating combination therapies [110].
Virtual Patient Platforms: A Technical Guide
Concept and Importance
Virtual patients are computer-generated simulations that mimic the clinical characteristics of real patients [108]. They are central to in silico studies, allowing researchers to simulate clinical trials and predict drug effects without the immediate need for human participants. A related concept is the digital twin, a virtual replica of a specific individual patient that is updated with their real-time clinical data [115]. In drug development, the term "virtual patient" more commonly refers to a representative from a simulated population cohort used for trial simulations [115].
Methodologies for Virtual Patient Generation
Several computational methodologies are employed to create virtual patients, each with distinct advantages and applications.
Table 1: Methodologies for Generating Virtual Patients
| Method | Key Principle | Advantages | Disadvantages |
|---|---|---|---|
| Agent-Based Modeling (ABM) [108] | Simulates actions and interactions of autonomous agents (e.g., cells) within a system. | Models complex emergent behaviors; useful for immune responses and tumor biology. | Computationally intensive; limited scalability for very large populations. |
| AI and Machine Learning [108] [113] | Analyzes large datasets to identify patterns and generate synthetic patient data. | Enhances simulation accuracy; useful for augmenting small sample sizes and rare diseases. | "Black box" problem reduces interpretability; risks of bias in training data. |
| Digital Twins [108] [115] | Creates a virtual replica of an individual patient, updated with their real-time data. | Enables high temporal resolution and real-time simulation of interventions. | High dependency on high-quality, real-time data; computationally intensive. |
| Biosimulation & Statistical Methods [108] [112] | Uses mathematical models (e.g., ODEs) and statistical inference (e.g., bootstrapping). | Cost-effective; well-established; predicts diverse clinical scenarios. | May oversimplify complex systems; limited by model assumptions. |
A prominent technical approach for generating virtual patients in QSP involves Probability of Inclusion and Compressed Latent Parameterization, as demonstrated in immuno-oncology [112]. The workflow for this method is detailed below:
Diagram 2: A workflow for generating a virtual patient cohort guided by immunogenomic data, as applied in NSCLC [112].
Experimental Protocol: Virtual Patient Generation for an Immuno-Oncology QSP Model [112]
Model Parameterization:
- Begin with a previously established QSP platform describing the cancer-immunity cycle.
- Recalibrate disease-specific parameters (e.g., tumor growth rate, immune cell recruitment rates) using experimental and clinical data specific to the disease of interest, such as Non-Small Cell Lung Cancer (NSCLC).
Generate Plausible Patient Pool:
- Define biologically plausible ranges for all model parameters based on literature and experimental data.
- Use Latin Hypercube Sampling or similar techniques to generate a large pool (e.g., 30,000) of parameter sets, each representing a "plausible patient."
Virtual Patient Selection Guided by Real-World Data:
- Obtain population-level distribution data for key immunological biomarkers (e.g., immune cell subset ratios like CD8/Treg, M1/M2) from databases such as the Cancer Research Institute (CRI) iAtlas, which contains immunogenomic analyses of TCGA data.
- Simulate the pre-treatment state for each plausible patient in the pool.
- Apply the Probability of Inclusion method: calculate the likelihood of each plausible patient's simulated biomarkers belonging to the real-world distribution.
- Select the subset of patients (e.g., 629 out of 30,000) whose virtual biomarker profiles statistically match the real-world data (using tests like Kolmogorov-Smirnov to confirm distribution similarity).
Pharmacokinetic Parameterization:
- For the selected virtual patients, generate individual PK parameters using Compressed Latent Parameterization. This technique uses population PK models to create pseudo-patient level data, ensuring realistic drug exposure variability within the cohort.
Cohort Validation:
- Validate the final virtual patient cohort by comparing other pre-treatment characteristics (e.g., tumor size, immune cell densities) against independent clinical datasets to ensure physiological plausibility.
The Scientist's Toolkit: Key Research Reagent Solutions
The development and application of QSP and virtual patient models rely on a suite of computational and data resources.
Table 2: Essential Reagents and Resources for QSP and Virtual Patient Modeling
| Item | Function/Description | Application Example |
|---|---|---|
| Ordinary Differential Equation (ODE) Solvers [111] | Software tools for numerically solving systems of ODEs that form the core of QSP models. | Simulating the dynamic change of tumor volume and T-cell populations over time. |
| Population Data Repositories (e.g., CRI iAtlas) [112] | Databases providing immunogenomic and clinical data from large patient cohorts (e.g., TCGA). | Informing the distributions of key parameters (e.g., PD-L1 expression, immune cell ratios) for virtual patient generation. |
| Population PK/PD Software | Tools for nonlinear mixed-effects modeling to quantify and simulate population variability in drug exposure and response. | Generating realistic inter-individual variability in drug PK parameters for a virtual cohort. |
| AI/ML Platforms (e.g., BIOiSIM) [113] | Artificial intelligence systems used for synthetic data generation, parameter estimation, and model personalization. | Filling data gaps by imputing missing biological parameters; accelerating parameter estimation. |
| High-Performance Computing (HPC) Cluster | Necessary computational infrastructure to handle the intensive calculations for large-scale virtual patient simulations. | Running thousands of virtual trial simulations with a cohort of 10,000 virtual patients in a feasible time. |
Applications and Case Studies
Impact Across the Drug Development Pipeline
QSP and virtual patients find utility from early discovery to late-stage development, addressing key challenges.
Table 3: Applications of QSP and Virtual Patients in Drug Development
| Development Stage | Application of QSP/Virtual Patients | Impact |
|---|---|---|
| Target Identification & Validation [72] [115] | Simulating the perturbation of a biological target within a disease model to predict therapeutic effect. | Increases confidence in target selection and helps avoid mechanisms-based toxicity early on. |
| Lead Optimization & Preclinical Development [110] [114] | Comparing modalities (e.g., small molecule vs. biologic); optimizing drug PK properties for desired efficacy/safety. | Guides the selection of the best drug candidate, reducing late-stage attrition due to poor PK/PD. |
| Clinical Trial Design [112] [114] | Simulating virtual clinical trials to predict efficacy, identify responsive subpopulations, and optimize dosing regimens. | Informs Phase 2/3 trial design, enriches for likely responders, and enables rational dose selection, improving probability of success. |
| Life-Cycle Management [110] | Evaluating new indications for an approved asset or rational selection of drug combinations. | Supports drug repurposing and expands therapeutic utility. |
Case Study 1: Predicting Response to Immunotherapy in NSCLC
A QSP model was developed to predict the response of advanced NSCLC to the PD-L1 inhibitor durvalumab [112].
- Methodology: The model was parameterized for NSCLC, and a virtual patient cohort was generated using the Probability of Inclusion method, guided by immunogenomic data from the iAtlas portal.
- Outcome: The model predicted an objective response rate of 18.6%, which aligned with clinical observations from the actual durvalumab trial. Furthermore, it identified the CD8/Treg ratio as a potential predictive biomarker, in addition to the established biomarkers PD-L1 and tumor mutational burden [112].
- Impact: This demonstrates the power of QSP and data-guided virtual patients to not only predict clinical outcomes but also to uncover novel biomarkers for patient stratification.
Case Study 2: Supporting Gene Therapy Development
QSP is increasingly applied to de-risk the development of complex gene therapies, including mRNA-based therapeutics, adeno-associated virus (AAV) vectors, and CRISPR-Cas9 systems [116].
- Application for AAVs: PBPK-QSP models have been developed to describe the complex biodistribution, intracellular trafficking, and transgene expression of AAV vectors. For example, a QSP model for liver-targeted AAV gene therapy in hemophilia B integrated preclinical data to support human dose predictions [116].
- Application for CRISPR: A mechanistic QSP model was built for NTLA-2001, a CRISPR-based therapy for transthyretin amyloidosis. The model captured the pharmacokinetics of the lipid nanoparticle delivery system and the pharmacodynamics of transthyretin protein knockdown in non-human primates, aiding in the projection of the first-in-human dose [116].
- Impact: In gene therapy, where dosing is often a single opportunity and patient populations are small, QSP provides crucial mechanistic insights for dose optimization and translational confidence.
Quantitative Systems Pharmacology and virtual patient platforms represent a paradigm shift in drug development. By providing a mechanistic, quantitative framework to simulate drug-disease interactions across virtual populations, these approaches directly address the core challenges of the translational gap. They enable more informed decision-making from target identification through clinical trial design, ultimately increasing the probability of technical success while reducing the reliance on costly and time-consuming empirical methods. As the field matures, the integration of AI, richer datasets, and more sophisticated biological models will further enhance the predictive power and broader applicability of QSP, solidifying its role as a cornerstone of modern, model-informed drug development.
The drug discovery and development process is a cornerstone of pharmaceutical research, traditionally characterized by a linear, sequential workflow from target identification to clinical trials. However, this process is notoriously arduous and resource-intensive, with historical data indicating an average development time of 10 to 15 years and costs often exceeding $2.6 billion per approved therapeutic, with a dismally low success rate of fewer than 10% of candidates entering Phase I trials ultimately gaining approval [117]. This traditional paradigm is being fundamentally disrupted by the integration of artificial intelligence (AI). AI-driven platforms leverage massive datasets and advanced algorithms to parallel-process and integrate multi-omics data streams, uncovering patterns and insights nearly impossible for human researchers to detect unaided [117]. This in-depth technical guide provides a comparative analysis of these two paradigms within the context of the basic principles of drug discovery, offering researchers and scientists a detailed examination of their respective timelines, costs, success rates, and underlying methodologies.
Methodology for Comparative Analysis
The quantitative and qualitative data for this analysis were synthesized from a systematic review of recent literature, market analyses, and published case studies from 2024 and 2025. Key performance indicators (KPIs) such as development timeline, capital cost, and clinical trial success rate were extracted and normalized for direct comparison. The experimental protocols and workflows for both traditional and AI-driven approaches are based on standard industry practices and documented implementations from leading AI-native biotech firms and academic publications.
Quantitative Comparison: AI-Driven vs. Traditional Pipelines
The transformative impact of AI on the core metrics of drug discovery is best illustrated through direct quantitative comparison. The data in Table 1 summarizes the performance differentials across key stages of the pipeline.
Table 1: Comparative Performance Metrics: Traditional vs. AI-Driven Drug Discovery
| Performance Metric | Traditional Pipeline | AI-Driven Pipeline | Key AI Technologies & Methods |
|---|---|---|---|
| Total Timeline | 10-15 years [117] [118] | 1-2 years (up to 70-80% reduction) [118] [119] | Generative AI, Deep Learning, In-silico Simulation [118] |
| Preclinical Timeline | 3-6 years [119] | 12-18 months (up to 40% time savings) [120] [118] | AI-powered target ID, Virtual HTS, Generative Molecular Design [120] [121] |
| Cost per Approved Drug | ~$2.6 Billion [117] [118] | Cost reductions of 40% reported in discovery [120] | Cloud computing, Predictive Analytics, Automated Synthesis [121] [119] |
| Phase 1 Trial Success Rate | 40-65% [119] | 80-90% [119] | Predictive Toxicity & ADMET Profiling, Improved Candidate Selection [121] [119] |
| Hit-to-Lead Optimization | Months to years per cycle | Weeks (e.g., 70% faster lead design) [118] | Generative AI, Deep Graph Networks, Automated DMTA Cycles [22] [118] |
| Patient Recruitment | Manual screening, major cause of delays | Doubled recruitment rates with dynamic criteria adjustment [120] [117] | NLP analysis of EHRs, Trial Pathfinder systems [120] [117] |
The data reveals that AI-driven pipelines are not merely incremental improvements but represent a paradigm shift. The most profound impacts are observed in the early stages, where AI drastically compresses timelines and reduces the resource burden, thereby increasing the overall probability of technical success and reducing the capitalized cost of development.
Detailed Experimental Protocols and Workflows
Protocol 1: Target Identification and Hit Discovery
A. Traditional Workflow:
- Target Identification: A hypothesis-driven process involving a review of scientific literature, genetic association studies (e.g., genome-wide association studies or GWAS), and basic molecular biology experiments to identify a protein or pathway implicated in a disease. This process is manual and can take 1-2 years [117].
- High-Throughput Screening (HTS): A physically intensive experimental protocol. A library of hundreds of thousands to millions of compounds is screened against the purified target protein or cellular assay.
- Steps: 1) Compound library management; 2) Assay development and miniaturization to 384- or 1536-well plates; 3) Robotic liquid handling to dispense compounds and reagents; 4) Incubation; 5) Signal detection (e.g., fluorescence, luminescence); 6) Data analysis to identify "hits" – compounds causing a desired effect.
- This process is costly, time-consuming (several months), and has a very low hit rate, often below 0.1% [121].
B. AI-Driven Workflow:
- Target Identification: AI models analyze vast, integrated datasets including genomic, proteomic, transcriptomic, and clinical data to identify causal disease drivers and novel druggable targets. Natural Language Processing (NLP) can simultaneously mine thousands of unpublished patents and scientific articles for novel insights [121] [119].
- Virtual Screening & De Novo Molecular Design: This replaces or prioritizes physical HTS with computational simulations.
- Steps: 1) Generative AI models (e.g., VAEs, GANs, Transformers) are trained on known chemical structures and properties to generate billions of novel, drug-like molecules in silico [118]. 2) Molecular docking and simulation (e.g., with tools like AlphaFold, AiKPro) predict how these virtual molecules interact with the 3D structure of the AI-identified target [120] [122]. 3) Machine Learning classifiers filter the generated molecules based on multi-parameter optimization (e.g., predicted binding affinity, solubility, synthetic accessibility, and ADMET properties) [121] [22]. 4) A shortlist of the most promising candidates (dozens instead of millions) is synthesized and validated in the lab.
The following diagram illustrates the fundamental logical difference between the sequential traditional workflow and the integrated, AI-driven paradigm.
Protocol 2: Lead Optimization and Preclinical Development
A. Traditional Workflow:
- Medicinal Chemistry: A series of Design-Make-Test-Analyze (DMTA) cycles are performed. Chemists synthesize analogs of a hit compound, which are then tested in biochemical and cellular assays, followed by animal models for pharmacokinetics (PK) and toxicity. Each cycle can take 6-12 months, and numerous cycles are often required to achieve a candidate with the desired potency, selectivity, and safety profile [118].
- Preclinical Toxicology: Relies heavily on animal studies (rodents and non-rodents) to estimate human toxicity, a process that is time-consuming, costly, and often poorly predictive of human effects due to interspecies differences [122].
B. AI-Driven Workflow:
- AI-Guided Lead Optimization: AI compresses the DMTA cycle. Deep graph networks and other models can generate tens of thousands of virtual analogs and predict their properties, guiding chemists to the most promising structures. For example, a 2025 study used this method to achieve a 4,500-fold potency improvement in inhibitors, a process that was completed in weeks rather than years [22].
- In-Silico and Human-Relevant Preclinical Testing: AI models predict toxicity, PK parameters, and drug-drug interactions from chemical structure [121] [119]. These computational approaches are increasingly combined with human-relevant New Approach Methodologies (NAMs) such as 3D cell cultures (spheroids, organoids) that better mimic human physiology [122]. The FDA now supports these alternatives to reduce animal testing requirements [122].
The Scientist's Toolkit: Essential Research Reagents & Solutions
The implementation of modern, AI-integrated drug discovery relies on a suite of advanced research tools and reagents. The following table details key solutions essential for experimental validation in this new paradigm.
Table 2: Key Research Reagent Solutions for AI-Integrated Drug Discovery
| Tool / Reagent | Function in Drug Discovery | Specific Application with AI |
|---|---|---|
| 3D Cell Culture Systems (e.g., Spheroids, Organoids) | Provides physiologically relevant in vitro models that mimic the 3D environment of human tissues and tumors [122]. | Used for high-throughput, human-relevant validation of AI-predicted compounds, replacing less predictive 2D cultures and early-stage animal testing [122]. |
| Extracellular Matrices (ECMs) (e.g., Corning Matrigel matrix) | A scaffold derived from basement membrane to support complex 3D cell growth and organization [122]. | Essential for robust and reproducible culturing of organoids used in functional validation of AI-derived drug candidates [122]. |
| CETSA (Cellular Thermal Shift Assay) | Measures drug-target engagement in intact cells and native tissue lysates by quantifying thermal stabilization of the target protein [22]. | Provides empirical, system-level validation of binding between an AI-designed molecule and its intended protein target, confirming mechanistic predictions [22]. |
| Kinase Profiling Assays | Measures the binding affinity and selectivity of compounds against a panel of kinases. | Validates the selectivity of AI-predicted kinase inhibitors (e.g., using deep learning models like AiKPro) to minimize off-target effects [122]. |
| AI-Powered Protein Structure Tools (e.g., AlphaFold, Genie) | Predicts 3D protein structures from amino acid sequences with high accuracy [120] [47]. | Provides critical structural data for targets with no experimentally solved structure, enabling molecular docking and structure-based drug design [120]. |
The comparative analysis presented in this whitepaper substantiates a conclusive finding: AI-driven drug discovery pipelines represent a superior paradigm against traditional methods across the fundamental metrics of timeline, cost, and success rate. By transitioning from a sequential, trial-and-error process to an integrated, data-driven, and predictive workflow, AI is addressing the core inefficiencies that have long plagued pharmaceutical R&D. The ability of AI to leverage large-scale biological data, generate optimal chemical entities in silico, and de-risk development through advanced simulation is compressing development timelines from decades to years and significantly improving the probability of clinical success. For researchers and drug development professionals, the integration of these AI technologies, complemented by human-relevant experimental tools, is no longer a speculative future but a present-day necessity for enhancing translational success and delivering innovative therapies to patients more efficiently.
The field of drug discovery is undergoing a revolutionary shift from traditional occupancy-based inhibition toward sophisticated therapeutic platforms that offer unprecedented precision and efficacy. Among the most promising of these emerging modalities are Proteolysis-Targeting Chimeras (PROTACs), Antibody-Drug Conjugates (ADCs), and Chimeric Antigen Receptor T-cell (CAR-T) therapies. These technologies represent distinct approaches to addressing the limitations of conventional therapeutics, particularly for targets previously considered "undruggable" [123] [124]. This whitepaper provides a comprehensive technical evaluation of these three platforms, examining their molecular mechanisms, clinical applications, and relative advantages within the framework of modern drug discovery principles.
The evolution of these platforms reflects a deeper understanding of disease biology and cellular machinery. PROTACs harness the cell's own protein degradation system, ADCs combine the specificity of antibodies with the potency of cytotoxic drugs, and CAR-T therapies genetically engineer a patient's immune cells to recognize and eliminate cancer cells [123] [125] [126]. Each approach offers unique strengths and faces distinct challenges in development and clinical translation, making them suitable for different therapeutic applications. Understanding their core principles is essential for researchers and drug development professionals seeking to leverage these technologies.
The following table provides a systematic comparison of the three therapeutic platforms across key technical and developmental parameters:
Table 1: Comparative Analysis of Emerging Therapeutic Platforms
| Parameter | PROTACs | Antibody-Drug Conjugates (ADCs) | CAR-T Therapies |
|---|---|---|---|
| Core Mechanism | Targeted protein degradation via ubiquitin-proteasome system [123] [124] | Targeted cytotoxic payload delivery via antibody-antigen recognition [125] [127] | Genetically engineered cellular immunity via autologous or allogeneic T-cells [126] |
| Molecular Basis | Heterobifunctional small molecules [124] | Monoclonal antibody-linker-cytotoxin conjugates [127] | Living T-cells expressing synthetic receptors [126] |
| Primary Applications | Oncology, neurodegenerative diseases, immune disorders [123] [124] | Oncology (hematologic malignancies & solid tumors) [128] [125] [127] | Oncology (hematologic malignancies) [126] |
| Key Advantage | Targets "undruggable" proteins, catalytic activity, overcomes resistance [123] [124] | Enhanced therapeutic index, targeted cytotoxicity, bystander effect [125] [127] | Potent & durable responses, potential for cure in refractory cancers [126] |
| Major Challenge | Physicochemical properties, oral bioavailability, "hook effect" [123] [129] | Linker instability, on/off-target toxicity, payload resistance [125] [127] | Cytokine release syndrome, neurotoxicity, limited solid tumor efficacy [126] |
| Clinical Status | Phase III trials (e.g., Vepdegestrant for breast cancer) [123] [124] | 19 ADCs approved globally as of June 2025 [125] | Multiple approved products for B-cell malignancies [126] |
| Therapeutic Index | Potentially wide (catalytic mechanism) [123] | Moderate (dependent on target specificity) [127] | Narrow (risk of severe immune-mediated toxicity) [126] |
In-Depth Platform Analysis
Proteolysis-Targeting Chimeras (PROTACs)
Mechanism of Action and Molecular Design
PROTACs are heterobifunctional molecules comprising three elements: a ligand that binds to the protein of interest (POI), a ligand that recruits an E3 ubiquitin ligase, and a chemical linker connecting the two [123] [124]. The mechanism is event-driven and catalytic, distinguishing it from traditional occupancy-based inhibitors.
The degradation process follows a coordinated sequence: (1) the PROTAC binds the target protein; (2) it simultaneously recruits an E3 ubiquitin ligase (commonly VHL or CRBN); (3) this induces formation of a ternary complex (POI-PROTAC-E3 ligase); (4) the E3 ligase transfers ubiquitin chains to lysine residues on the target protein; (5) the ubiquitinated protein is recognized and degraded by the 26S proteasome; and (6) the PROTAC is recycled to initiate another cycle [123] [124]. This catalytic recycling enables potent effects at sub-stoichiometric concentrations.
Diagram: PROTAC Mechanism of Action
Key Research Reagents and Experimental Protocols
Table 2: Essential Research Reagents for PROTAC Development
| Reagent/Category | Function/Utility | Specific Examples |
|---|---|---|
| E3 Ligase Ligands | Recruit ubiquitin ligase machinery to enable ternary complex formation | VHL ligands (e.g., VH032), CRBN ligands (e.g., Lenalidomide derivatives), MDM2 ligands [123] [129] |
| Target Protein Ligands | Bind protein of interest with high specificity and affinity | Kinase inhibitors, hormone receptor ligands, transcription factor binders [123] |
| Linker Libraries | Optimize spatial geometry and cooperativity of ternary complexes | Polyethylene glycol (PEG) chains, alkyl chains, with varying lengths and rigidity [123] |
| Proteomics Platforms | Assess degradation efficacy, selectivity, and off-target effects | Mass spectrometry-based proteomics (e.g., TMT, LFQ) for global protein abundance analysis [129] |
| Cell-Based Degradation Assays | Quantify target degradation potency and efficiency in relevant cellular models | Western blotting, immunofluorescence, nanoBRET, HiBiT systems [123] |
Experimental Protocol for PROTAC Screening:
- Ternary Complex Formation Assay: Utilize surface plasmon resonance (SPR) or bio-layer interferometry (BLI) to quantify cooperative binding and ternary complex stability [123].
- Cellular Degradation Kinetics: Treat relevant cell lines with PROTAC compounds across a concentration gradient (typically 1 nM - 10 µM) for 3-24 hours. Measure target protein levels via Western blot or targeted proteomics to determine DC₅₀ and Dmax values [123] [129].
- Selectivity Profiling: Employ global proteomic analysis (e.g., TMT-based mass spectrometry) to identify on-target degradation and potential off-target effects across the proteome [129].
- Functional Consequences Assessment: Evaluate downstream pathway modulation via phosphoproteomics, apoptosis assays (e.g., caspase activation), and cell viability assays (e.g., CellTiter-Glo) [129].
Antibody-Drug Conjugates (ADCs)
Mechanism of Action and Structural Evolution
ADCs are complex biologics comprising three key components: a monoclonal antibody specific for a tumor-associated antigen, a cytotoxic payload, and a chemical linker that conjugates them [125] [127]. They function as targeted delivery systems, minimizing systemic exposure to potent cytotoxins.
The mechanism involves: (1) antigen binding on target cells; (2) internalization via receptor-mediated endocytosis; (3) trafficking through endosomal-lysosomal compartments; (4) linker cleavage or antibody degradation to release the payload; and (5) payload-mediated cell killing [125] [127]. Some ADCs exhibit "bystander effects," where membrane-permeable payloads can kill adjacent antigen-negative cells, particularly valuable in heterogeneous tumors [127].
Diagram: ADC Mechanism of Action
Key Research Reagents and Experimental Protocols
Table 3: Essential Research Reagents for ADC Development
| Reagent/Category | Function/Utility | Specific Examples |
|---|---|---|
| Cytotoxic Payloads | Mediate tumor cell killing with high potency | Microtubule disruptors (MMAE, MMAF, DM1, DM4), DNA damaging agents (calicheamicin, PBDs, topoisomerase I inhibitors like DXd) [128] [125] [127] |
| Chemical Linkers | Control stability in circulation and payload release in target cells | Cleavable (e.g., valine-citrulline, disulfide), non-cleavable (e.g., thioether), and peptide-based linkers [125] [127] |
| Monoclonal Antibodies | Provide target specificity and internalization capability | Humanized or fully human IgG1 with engineered cysteine residues or unnatural amino acids for site-specific conjugation [125] [127] |
| Conjugation reagents | Enable controlled attachment of payloads to antibodies | Enzyme-based (e.g., transglutaminase), chemical (e.g., maleimide), and click chemistry reagents [127] |
| Antigen-positive Cell Lines | Evaluate ADC binding, internalization, and cytotoxicity | Cell lines endogenously expressing or engineered to express target antigen at varying levels [125] |
Experimental Protocol for ADC Efficacy Evaluation:
- Antigen Binding and Internalization Assay: Incubate ADCs with antigen-positive cells at 4°C for binding, then shift to 37°C to monitor internalization via confocal microscopy or flow cytometry using fluorescently-labeled secondary antibodies [125].
- In Vitro Cytotoxicity Screening: Treat antigen-positive and antigen-negative cell lines with ADCs (0.001-100 nM) for 72-120 hours. Assess viability using ATP-based assays (e.g., CellTiter-Glo) to determine IC₅₀ values and evaluate the bystander effect in co-culture systems [127].
- Linker Stability Assessment: Incubate ADCs in human plasma at 37°C for up to 14 days. Quantify free payload and antibody-conjugated payload over time using LC-MS/MS to calculate stability half-life [127].
- In Vivo Efficacy Studies: Administer ADCs to immunocompromised mice bearing antigen-positive patient-derived xenografts (PDX) or cell line-derived xenografts (CDX). Monitor tumor volume and animal survival, comparing to unconjugated antibody and payload controls [125].
Chimeric Antigen Receptor T-Cell (CAR-T) Therapy
Mechanism of Action and Structural Generations
CAR-T therapy involves genetically engineering a patient's T-cells to express synthetic receptors that recognize specific tumor antigens, redirecting them against cancer cells. A CAR consists of an extracellular antigen-recognition domain (typically a single-chain variable fragment, scFv), a hinge region, a transmembrane domain, and one or more intracellular signaling domains [126].
CAR-T cells mediate killing through: (1) specific recognition of surface antigens independent of MHC presentation; (2) activation upon antigen binding; (3) proliferation and clonal expansion; and (4) elimination of target cells through direct cytolysis (perforin/granzyme), cytokine release, and activation of other immune cells [126]. The evolution through five generations has incorporated additional co-stimulatory domains (CD28, 4-1BB) and cytokine signaling modules (IL-2R) to enhance potency and persistence [126].
Diagram: CAR-T Structure and Activation
Key Research Reagents and Experimental Protocols
Table 4: Essential Research Reagents for CAR-T Development
| Reagent/Category | Function/Utility | Specific Examples |
|---|---|---|
| Viral Vectors | Mediate efficient gene transfer for CAR expression | Lentiviral and gamma-retroviral vectors with appropriate biosafety level containment [126] |
| Gene Editing Tools | Enable precise genomic integration or gene knockout | CRISPR/Cas9, TALENs for TRAC disruption to reduce alloreactivity, or B2M knockout for universal CAR-T [126] |
| T-cell Activation Reagents | Stimulate T-cell proliferation prior to genetic modification | Anti-CD3/CD28 antibodies, cytokine cocktails (IL-2, IL-7, IL-15) [126] |
| Flow Cytometry Panels | Characterize CAR expression, immunophenotype, and exhaustion markers | Fluorochrome-conjugated antibodies against CD3, CD4, CD8, CAR detection reagents, PD-1, TIM-3, LAG-3 [126] |
| Cytotoxicity Assay Components | Quantify tumor cell killing capacity | Luciferase-based (e.g., IncuCyte), calcein-AM release, or real-time impedance systems (xCELLigence) [126] |
Experimental Protocol for CAR-T Functional Validation:
- CAR Construct Transduction: Isolate peripheral blood mononuclear cells (PBMCs) from healthy donors or leukapheresis products. Activate T-cells with anti-CD3/CD28 beads for 24-48 hours, then transduce with lentiviral CAR vectors at appropriate multiplicity of infection (MOI). Expand cells in IL-2 (100 IU/mL) for 7-14 days [126].
- CAR Expression Quantification: Analyze transduction efficiency by flow cytometry 3-5 days post-transduction using protein L or antigen-specific staining to detect surface CAR expression. Aim for >30% transduction for functional studies [126].
- In Vitro Cytotoxicity Assay: Co-culture CAR-T cells with target cells (e.g., Nalm-6 for CD19 CAR) at various effector-to-target ratios (E:T = 1:1 to 20:1) for 18-24 hours. Measure specific lysis using luciferase-based assays or flow cytometric counting beads [126].
- Cytokine Release Profiling: Collect supernatant from cytotoxicity co-cultures after 24 hours. Quantify IFN-γ, IL-2, and TNF-α using multiplex ELISA or Luminex arrays to assess T-cell activation [126].
- In Vivo Efficacy Models: Inject immunodeficient NSG mice with luciferase-expressing tumor cells, followed by CAR-T cell administration 7-14 days later. Monitor tumor burden via bioluminescent imaging and animal survival over 6-8 weeks [126].
Future Directions and Concluding Perspectives
The therapeutic landscape continues to evolve with each platform addressing its current limitations. PROTAC research is focused on expanding the E3 ligase toolkit (only ~13 of 600 human E3s are currently utilized), improving physicochemical properties for enhanced bioavailability, and developing conditional degraders activated in specific tissues or by external stimuli [129] [47]. ADC innovation centers on novel payload mechanisms (including radioconjugates), bispecific antibodies, and improved conjugation technologies for better homogeneity and stability [128] [127]. CAR-T advancements are directed toward solid tumor applications through improved trafficking and resistance to immunosuppressive microenvironments, allogeneic "off-the-shelf" products to reduce cost and complexity, and enhanced safety controls via suicide genes or logic-gated activation [126] [47].
The integration of artificial intelligence and automation is accelerating development across all platforms. AI-powered molecular modeling predicts ternary complex formation for PROTACs, optimizes antibody-antigen interactions for ADCs, and designs novel CAR architectures with improved specificity profiles [130] [131] [47]. Automated high-throughput screening systems and organoid-based disease models are enhancing the translational predictivity of preclinical studies [131].
In conclusion, PROTACs, ADCs, and CAR-T represent complementary rather than competing therapeutic paradigms, each with distinct strengths and optimal applications. PROTACs offer unprecedented ability to target intracellular proteins traditionally considered undruggable. ADCs provide targeted delivery of ultra-potent cytotoxins with expanding utility across oncology. CAR-T therapies demonstrate the potential for curative responses in refractory hematologic malignancies. The continued evolution of these platforms, supported by advances in AI and translational science, promises to significantly expand the therapeutic armamentarium against complex diseases, ultimately enabling more precise and effective personalized medicines.
The integration of Artificial Intelligence (AI) and Machine Learning (ML) into drug development represents a paradigm shift, offering unprecedented opportunities to accelerate the delivery of new therapies to patients. The U.S. Food and Drug Administration (FDA) has recognized this potential, reporting a significant increase in drug application submissions incorporating AI/ML components over recent years [132]. These technologies are being applied across the entire drug product life cycle, from nonclinical research and clinical trials to post-marketing surveillance and manufacturing [132]. However, this rapid innovation has created a complex regulatory landscape that researchers and drug development professionals must navigate to ensure compliance while maintaining scientific rigor.
The FDA is actively developing a risk-based regulatory framework to promote innovation and protect patient safety [132]. Understanding this evolving framework is crucial for successfully bringing AI-enhanced therapies to market. This guide provides a comprehensive technical overview of preparing for FDA review of AI-driven drug development products, with specific methodologies and compliance strategies aligned with current regulatory thinking.
The FDA's Evolving Regulatory Framework for AI in Drug Development
Foundational Documents and Guidance
The FDA's approach to AI in drug development is crystallizing through several key documents and initiatives. The center for Drug Evaluation and Research (CDER) has established an AI Council to provide oversight, coordination, and consolidation of CDER activities around AI use [132]. This council coordinates internal AI capabilities and policy initiatives for regulatory decision-making, ensuring CDER speaks with a unified voice on AI communications [132].
Key foundational documents include:
- "Considerations for the Use of Artificial Intelligence to Support Regulatory Decision Making for Drug and Biological Products" (2025 Draft Guidance): Provides recommendations on using AI to produce information supporting regulatory decisions regarding drug safety, effectiveness, or quality [132].
- "Artificial Intelligence and Medical Products: How CBER, CDER, CDRH, and OCP are Working Together" (2024, revised 2025): Describes how FDA's medical product centers coordinate to advance responsible AI use [132].
- "Using Artificial Intelligence & Machine Learning in the Development of Drug & Biological Products" (2023 Discussion Paper): Served as a foundational document to shape the U.S. regulatory approach [133].
The Credibility Assessment Framework
The FDA's draft guidance establishes a risk-based credibility assessment framework for evaluating AI models in specific "contexts of use" (COUs) [133]. Credibility is defined as the trust in an AI model's performance for a given COU, supported by evidence. The framework involves seven key steps that align with the specific regulatory question or decision the model addresses.
Table: Key FDA Guidance Documents for AI in Drug Development
| Document Title | Release Date | Status | Key Focus Areas |
|---|---|---|---|
| Considerations for the Use of AI to Support Regulatory Decision-Making for Drug and Biological Products | 2025 | Draft Guidance | Risk-based credibility assessments, context of use, data transparency |
| Artificial Intelligence and Medical Products | 2024 (rev. 2025) | Final | Inter-center coordination, unified approach across medical products |
| Using AI & ML in the Development of Drug & Biological Products | 2023 (rev. 2025) | Discussion Paper | Foundational concepts, initial regulatory thinking |
Internal FDA AI Implementation
The FDA is aggressively integrating AI into its own operations. Following a successful pilot where AI reduced certain scientific review tasks from three days to minutes, FDA Commissioner Dr. Martin A. Makary announced an aggressive timeline to scale AI use across all FDA centers by June 30, 2025 [134]. The agency is developing generative AI tools like "Elsa" to assist with reviewing clinical protocols and identifying inspection targets [135]. This internal transformation signals the FDA's commitment to leveraging AI capabilities for more efficient regulatory processes.
Technical Preparation for FDA Submissions with AI Components
Establishing Model Credibility and Context of Use
The foundation of a successful regulatory submission involving AI is a rigorously defined Context of Use (COU). The COU precisely delineates the AI model's function and scope in addressing a specific regulatory question or decision [133]. For example, an AI model used to identify potential drug candidates based on molecular structure requires a different validation approach than one used to stratify patients in clinical trials.
Technical documentation must comprehensively address these key areas:
- Data Provenance and Quality: Document the origin, characteristics, and potential biases of training data. The FDA emphasizes that data variability can introduce bias and unreliability [133].
- Algorithm Transparency and Interpretability: Provide detailed explanations of the AI model's architecture, parameters, and decision-making processes, even for "black box" models using techniques like SHAP (SHapley Additive exPlanations) or LIME (Local Interpretable Model-agnostic Explanations).
- Uncertainty Quantification: Implement and document methods for interpreting, explaining, and quantifying the precision of AI model predictions [133].
- Model Lifecycle Management: Establish protocols for continuous monitoring, retraining, and version control to address "model drift" – the degradation of performance over time or across different operational environments [133].
Risk-Based Approach to AI Validation
The level of validation required should be proportional to the risk associated with the AI application. The FDA recognizes that AI tools used in early discovery phases (e.g., target identification) may require less rigorous validation than those directly informing clinical decisions or regulatory endpoints [133]. The risk assessment should consider the potential impact on patient safety and study integrity if the AI model produces erroneous or biased outputs.
Table: Risk Categorization for AI Applications in Drug Development
| Risk Level | Example Applications | Recommended Validation Approach |
|---|---|---|
| High | Clinical trial patient stratification, Predictive toxicology for regulatory decisions | Extensive validation, external testing, comprehensive documentation, human oversight |
| Medium | Biomarker identification, Preclinical efficacy prediction | Multi-stage validation, demonstration of generalizability, performance benchmarks |
| Low | Target identification, Literature mining for hypothesis generation | Standard performance metrics, internal validation, documentation of methods |
AI Applications Across the Drug Development Lifecycle: Regulatory Considerations
Drug Discovery and Preclinical Development
AI is revolutionizing early drug discovery by rapidly analyzing vast chemical, genomic, and proteomic datasets to identify promising drug candidates. For example, Insilico Medicine demonstrated the potential of AI-driven discovery by advancing an AI-designed drug candidate to human clinical trials within 18 months of initial compound identification – significantly faster than standard preclinical development timelines [133].
Regulatory Considerations for Discovery-phase AI:
- While AI applications used solely in early discovery may not be directly subject to FDA regulation, the principles of Good Machine Learning Practice (GMLP) should still be applied [133].
- For tools that will eventually support regulatory submissions, maintain detailed records of training data, model selection criteria, and validation results from the beginning.
- Address intellectual property challenges early, particularly for AI-generated compounds, as major patent offices including the U.S. Patent and Trademark Office have held that only natural persons can be named as inventors [133].
Clinical Trial Design and Management
AI algorithms are increasingly used to optimize clinical trial design, patient stratification, recruitment, and adherence monitoring. Natural language processing (NLP) tools can analyze clinical trial protocols and outcomes to identify best practices [133].
Regulatory Considerations for Clinical Trial AI:
- AI systems used in clinical trials must meet Good Clinical Practice (GCP) guidelines [133].
- The FDA's 2025 draft guidance provides specific recommendations on using AI to support regulatory decisions regarding safety and effectiveness [133].
- For AI tools used in patient selection, demonstrate that the algorithm does not unfairly exclude protected populations or introduce bias that could compromise trial integrity or generalizability.
Pharmacovigilance and Post-Market Surveillance
AI enhances drug safety monitoring by automatically detecting adverse drug events (ADEs) from electronic health records, social media, and patient forums [133]. The FDA's draft guidance acknowledges AI's role in handling post-marketing adverse drug experience information [133].
Regulatory Considerations for Pharmacovigilance AI:
- Implement continuous monitoring of AI model performance to detect degradation as data patterns evolve.
- Maintain human oversight for serious adverse event determination, even with highly accurate AI systems.
- Ensure traceability from AI-identified signals back to original data sources for regulatory review.
International Regulatory Landscape
Regulatory bodies worldwide are developing distinct yet converging strategies for AI in drug development. Understanding these international approaches is crucial for global development programs.
Table: International Regulatory Approaches to AI in Drug Development
| Regulatory Agency | Key Framework/Initiative | Distinguishing Features |
|---|---|---|
| European Medicines Agency (EMA) | "AI in Medicinal Product Lifecycle Reflection Paper" | Structured, cautious approach prioritizing rigorous upfront validation [133] |
| UK Medicines and Healthcare products Regulatory Agency (MHRA) | "AI Airlock" regulatory sandbox | Principles-based regulation focusing on Software as a Medical Device [133] |
| Japan's Pharmaceuticals and Medical Devices Agency (PMDA) | Post-Approval Change Management Protocol (PACMP) for AI-SaMD | "Incubation function" to accelerate access; formalized process for post-approval AI modifications [133] |
Experimental Protocols for AI Model Validation
Protocol for Validating Predictive AI Models in Preclinical Development
This protocol provides a standardized methodology for establishing credibility of predictive AI models used in preclinical drug development.
1.0 Objective: To comprehensively validate AI models predicting compound efficacy or toxicity before use in regulatory-influenced decision making.
2.0 Materials and Reagents:
- Reference Compounds: Including positive/negative controls with established efficacy/toxicity profiles
- Benchmark Datasets: Curated, high-quality datasets for performance comparison
- Computational Infrastructure: Secure, version-controlled environment with adequate processing power
3.0 Methodology:
- 3.1 Data Curation and Preprocessing
- Document data sources, cleaning methods, and inclusion/exclusion criteria
- Implement train-validation-test splits (typical ratio: 60-20-20) with temporal or structural separation to prevent data leakage
- For biological data, confirm appropriate normalization and batch effect correction
3.2 Model Training and Validation
- Apply appropriate cross-validation strategies (k-fold, stratified, or time-series split)
- Implement multiple algorithm types (e.g., random forest, gradient boosting, neural networks) for performance comparison
- Track hyperparameters and optimization methods with version control
3.3 Performance Assessment
- Calculate standard metrics (AUC-ROC, accuracy, precision, recall, F1-score) on holdout test set
- Perform subgroup analysis to identify performance variations across demographic, clinical, or molecular subgroups
- Conduct sensitivity analysis to assess model robustness to input perturbations
3.4 External Validation
- Test model on completely external dataset from different source or collection period
- Compare performance against existing standard methods or expert assessment
4.0 Documentation Requirements:
- Complete model card including intended use cases, limitations, and failure modes
- Data provenance and characteristics report
- Hyperparameter search space and final selected parameters
- Comprehensive performance metrics across all validation stages
Protocol for Clinical Trial AI System Validation
1.0 Objective: To validate AI systems used for patient stratification, recruitment, or outcome prediction in clinical trials.
2.0 Methodology:
- 2.1 Bias and Fairness Assessment
- Apply fairness metrics (demographic parity, equalized odds, etc.) across relevant patient subgroups
- Test for performance disparities based on race, ethnicity, age, sex, and socioeconomic factors
- Implement bias mitigation strategies if disparities are detected
2.2 Clinical Relevance Validation
- Conduct blinded comparison against clinical expert judgments
- Assess clinical utility through prospective pilot studies where feasible
- Establish minimum performance thresholds clinically acceptable for the intended use
2.3 Generalizability Testing
- Validate across multiple trial sites with varying patient populations and practice patterns
- Test temporal validity by applying to data from different time periods
- Assess transportability to related but distinct clinical contexts
The Scientist's Toolkit: Essential Research Reagent Solutions for AI-Enhanced Drug Development
Table: Key Research Reagent Solutions for AI-Enhanced Drug Development
| Reagent/Technology | Function in AI-Enhanced Drug Development | Example Applications |
|---|---|---|
| High-Content Screening Assays | Generates multiparametric data for AI model training | Phenotypic screening, mechanism of action analysis [72] |
| CRISPR/Cas9 Gene Editing Systems | Validates AI-identified drug targets through genetic perturbation | Functional genomics, target validation [72] |
| Patient-Derived Organoids | Provides physiologically relevant data for AI model training and validation | Preclinical efficacy testing, biomarker discovery |
| Multiplex Immunoassays | Generates high-dimensional protein data for AI analysis | Biomarker identification, patient stratification |
| DNA-Encoded Libraries | Expands chemical space for AI-based compound screening | Hit identification, library design optimization |
| Zebrafish Disease Models | Enables medium-throughput in vivo validation of AI predictions | Toxicity screening, efficacy assessment [19] |
| Biospecimen Biobanks | Provides annotated, diverse samples for algorithm development and testing | Biomarker discovery, algorithm bias assessment |
Visualization of AI Integration in Drug Development Workflow
The following diagram illustrates the integrated workflow of AI technologies throughout the drug development process, highlighting key regulatory touchpoints and the continuous model lifecycle management required for compliance.
AI Model Validation and Compliance Workflow
This diagram details the specific steps for AI model validation and documentation required to meet regulatory standards throughout the model lifecycle.
Successfully navigating FDA review for AI-enhanced drug development requires a proactive, science-based approach that prioritizes model credibility, documentation transparency, and appropriate risk assessment. As FDA Commissioner Dr. Martin A. Makary stated, "We need to value our scientists' time and reduce the amount of non-productive busywork that has historically consumed much of the review process" [134]. The agency's internal adoption of AI signals its commitment to streamlining processes while maintaining rigorous safety standards.
The most successful organizations will be those that:
- Integrate regulatory considerations early in AI model development rather than as an afterthought
- Establish robust model lifecycle management protocols that address continuous monitoring and validation
- Maintain comprehensive documentation that demonstrates model credibility for specific contexts of use
- Implement human oversight mechanisms appropriate to the risk level of the AI application
- Engage in early dialogue with regulators through pre-submission meetings for novel AI approaches
As the regulatory landscape continues to evolve, maintaining flexibility and adhering to core principles of Good Machine Learning Practice will position drug developers to not only meet current regulatory expectations but also adapt to future requirements. This approach will ultimately accelerate the delivery of safe, effective therapies to patients while harnessing the transformative potential of artificial intelligence in drug development.
Conclusion
The drug discovery and development landscape in 2025 is defined by a decisive shift towards computational precision, functional validation, and cross-disciplinary integration. The synthesis of insights from all four intents reveals that success hinges on the seamless fusion of foundational biological principles with cutting-edge AI and data science. The transformative impact of AI is undeniable, accelerating timelines from target identification to clinical trials, while novel modalities are opening previously 'undruggable' target spaces. Future success will depend on the industry's ability to further standardize high-quality data, foster transparency in AI model development, and strengthen collaboration between computational and experimental experts. By embracing these integrated, data-rich workflows, the field is poised to overcome historical inefficiencies, significantly reduce late-stage attrition, and deliver safer, more effective therapies to patients faster than ever before.
References
- 1. End to end drug discovery: Revolutionizing 2025 [https://lifebit.ai/blog/end-to-end-drug-discovery/]
- 2. :Updates and insights for employer plans Drug pipeline 2025 [https://www.ab.bluecross.ca/plans/group/drug-pipeline-2025.php]
- 3. R&D drug comparison by pipeline | Statista development phase 2025 [https://www.statista.com/statistics/791288/r-and-d-pipeline-drugs-worldwide-by-phase-development/]
- 4. How 2025 can be a pivotal year of progress for pharma [https://www.weforum.org/stories/2025/01/2025-can-be-a-pivotal-year-of-progress-for-pharma/]
- 5. Alzheimer's disease drug : development - PMC pipeline 2025 [https://pmc.ncbi.nlm.nih.gov/articles/PMC12131090/]
- 6. Summary Metrics of Drug Development Tool Qualification ... [https://www.fda.gov/drugs/drug-development-tool-ddt-qualification-programs/summary-metrics-drug-development-tool-qualification-projects-submitted-fda]
- 7. Trends in the global drug , 2021– development pipeline 2025 [https://www.canada.ca/en/patented-medicine-prices-review/services/npduis/analytical-studies/posters/trends-pipeline-2025poster.html]
- 8. Postmarketing Surveillance Programs [https://www.fda.gov/drugs/surveillance/postmarketing-surveillance-programs]
- 9. Post-Marketing Surveillance in 2025: Evolving Strategies ... [https://www.vitrana.com/post-marketing-surveillance-in-2025-evolving-strategies-for-real-world-safety-monitoring/]
- 10. Targeted Postmarket Surveillance: The Way Toward ... [https://paragoninstitute.org/private-health/targeted-postmarket-surveillance-the-way-toward-responsible-ai-innovation-in-health-care/]
- 11. The Predictive Pipeline: Structuring Drug Development ... [https://www.drugpatentwatch.com/blog/the-predictive-pipeline-structuring-drug-development-timelines-with-ai-driven-patent-intelligence/?srsltid=AfmBOoqLjKmqx3IFYSQVn_Q8C3QpwQu_Co1jnPJjOq67QnEH3ztGKRys]
- 12. Exploring the five phases of drug development [https://www.patheon.com/us/en/insights-resources/blog/drug-development-phases.html]
- 13. Why Drug Development Takes Decades: Process & ... [https://intuitionlabs.ai/articles/drug-development-timeline-challenges]
- 14. Stages of Drug Development [https://www.curefa.org/stages-of-drug-development/]
- 15. Costs of Drug Development and Research and Development ... [https://pmc.ncbi.nlm.nih.gov/articles/PMC11214120/]
- 16. Which part in drug development is more costly ... [https://synapse.patsnap.com/article/which-part-in-drug-development-is-more-costly-drug-discovery-or-clinical-trials]
- 17. Biopharma RD Faces Productivity And Attrition Challenges ... [https://www.clinicalleader.com/doc/biopharma-r-d-faces-productivity-and-attrition-challenges-in-2025-0001]
- 18. Dealing With The Challenges Of Drug Discovery [https://www.zeclinics.com/blog/dealing-with-the-challenges-of-drug-discovery]
- 19. Drug Discovery and Development: A Step-By-Step Process [https://www.zeclinics.com/blog/drug-discovery-and-development-process]
- 20. Quantitative Methods in System-Based Drug Discovery [https://www.intechopen.com/chapters/53186]
- 21. Target Identification and Validation in Drug Discovery [https://link.springer.com/book/10.1007/978-1-0716-4418-8]
- 22. Top 5 Drug Discovery Trends 2025 Driving Breakthroughs [https://www.pelagobio.com/cetsa-drug-discovery-resources/blog/drug-discovery-trends-2025/]
- 23. Hit to lead [https://en.wikipedia.org/wiki/Hit_to_lead]
- 24. Hit to Lead Assays: Accelerating Early Drug Discovery [https://bellbrooklabs.com/hit-to-lead-assays/?srsltid=AfmBOooUU3exyzMyRR1b-bh0qRa-rv2kP2KnHfZAUy1pd89GN53ANVz9]
- 25. Hit-To-Lead | Drug Discovery [https://www.sygnaturediscovery.com/drug-discovery/integrated-drug-discovery/hit-to-lead/]
- 26. The QDπ dataset, training data for drug-like molecules and ... [https://www.nature.com/articles/s41597-025-04972-3]
- 27. Generative modeling for molecular design and discovery [https://www.nature.com/collections/cdaccfegbc]
- 28. Preclinical Studies in Drug Development [https://www.ppd.com/what-is-a-cro/preclinical-studies-in-drug-development/]
- 29. Advancing drug development with “Fit-for-Purpose” modeling ... [https://pmc.ncbi.nlm.nih.gov/articles/PMC12436579/]
- 30. In Vitro vs. In Vivo: What's the Difference? [https://newlifefertility.com/blog/in-vitro-and-in-vivo/]
- 31. Progress of AI-Driven Drug–Target Interaction Prediction and ... [https://pmc.ncbi.nlm.nih.gov/articles/PMC12563295/]
- 32. The Future of Drug Discovery: Why AI Is More Than Just a ... [https://www.gmp-journal.com/current-articles/details/the-future-of-drug-discovery-why-ai-is-more-than-just-a-buzzword.html]
- 33. Leading AI-Driven Drug Discovery Platforms [https://www.sciencedirect.com/science/article/abs/pii/S0031699725075118]
- 34. AI in Drug Discovery Market Size & Growth Forecast to 2029 [https://www.marketsandmarkets.com/Market-Reports/ai-in-drug-discovery-market-151193446.html]
- 35. How Machine Learning is Recoding the Future of Drug ... [https://www.drugpatentwatch.com/blog/the-application-of-machine-learning-in-drug-discovery-revolutionizing-pharmaceutical-research/?srsltid=AfmBOorP5OD6RCCz5KomhGMw255lhwVG_tSv5dGBMLuoRcQxPYMjNuY5]
- 36. Machine learning approaches for next-generation ADMET ... [https://www.sciencedirect.com/science/article/abs/pii/S1359644625002004]
- 37. Revolutionizing pharmacology: AI-powered approaches in ... [https://www.sciencedirect.com/science/article/pii/S259009862500020X]
- 38. AI in drug discovery: Key trends shaping therapeutics in 2025 [https://www.gubra.dk/blog/ai-in-drug-discovery-key-trends-shaping-therapeutics-in-2025/]
- 39. IGC Pharma Expands AI-Powered Drug Discovery In-Silico ... [https://igcpharma.com/igc-pharma-expands-ai-powered-drug-discovery-in-silico-pipeline/]
- 40. In silico screening of a designed focused chemical space ... [https://pubmed.ncbi.nlm.nih.gov/40617084/]
- 41. Automation Revolutionizes High Throughput ... [https://chronect.trajanscimed.com/news/high-throughput-experimentation-hte]
- 42. RSGPT: a generative transformer model for retrosynthesis ... [https://www.nature.com/articles/s41467-025-62308-6]
- 43. Dissecting errors in machine learning for retrosynthesis [https://pubs.rsc.org/en/content/articlehtml/2025/dd/d4dd00263f]
- 44. Advancing Organic Chemistry Using High-Throughput ... [https://pubmed.ncbi.nlm.nih.gov/40899616/]
- 45. Generative AI for Medicinal Chemistry Workflows [https://www.digitalchemistry.ai/resources/white-papers/transforming-medicinal-chemistry-how-generative-ai-enhances-hit-identification-hit-to-lead-and-lead-optimization-workflows/]
- 46. Targeted protein degradation: mechanisms, strategies and ... [https://www.nature.com/articles/s41392-022-00966-4]
- 47. The latest trends in drug discovery [https://www.cas.org/resources/cas-insights/2025-drug-discovery-trends]
- 48. Metal-Based Radiopharmaceuticals in Inorganic Chemistry [https://pmc.ncbi.nlm.nih.gov/articles/PMC10005725/]
- 49. Viral Vectors - Gene & Cell Therapy Patient Education | ASGCT [https://patienteducation.asgct.org/understanding-cell-gene-therapy/viral-vectors]
- 50. Novel Drug Delivery Systems: An Important Direction for Drug ... [https://pmc.ncbi.nlm.nih.gov/articles/PMC11124876/]
- 51. Real World Data: 5 Powerful Benefits & Challenges in 2025 [https://lifebit.ai/blog/real-world-data/]
- 52. A Review of the Importance and Relevance of Real-World ... [https://pmc.ncbi.nlm.nih.gov/articles/PMC12400973/]
- 53. CTTI Recommendations: Use of Real-World Data to Plan ... [https://ctti-clinicaltrials.org/about/ctti-projects/real-world-data/ctti-recommendations-use-of-real-world-data-to-plan-eligibility-criteria-and-enhance-recruitment/]
- 54. Artificial Clinic Intelligence (ACI): A Generative AI-Powered ... [https://pmc.ncbi.nlm.nih.gov/articles/PMC12611047/]
- 55. Artificial intelligence in clinical trials: A comprehensive ... [https://www.sciencedirect.com/science/article/pii/S1386505625003582]
- 56. 2025 Trends: Leveraging Real-World Data for Synthetic ... [https://www.appliedclinicaltrialsonline.com/view/2025-trends-leveraging-real-world-data-synthetic-control-arms]
- 57. Clinical Trial Digital Patient Recruitment: Top 5 for 2025 [https://lifebit.ai/blog/clinical-trial-digital-patient-recruitment/]
- 58. Top 5 Trends in Real-World Data and ... [https://veranahealth.com/top-5-trends-in-real-world-data-and-real-world-evidence-for-2025/]
- 59. 2025年大药企新药III期研究失败盘点 [http://m.anytesting.com/news/1957456.html]
- 60. 2025上半年,制药巨头放弃开发80个项目…… - ByDrug [https://bydrug.pharmcube.com/news/detail/0d7f85e7c2a5c913e4bb32b9d5381d94]
- 61. 2025年1-9月FDA拒批16款新药:肿瘤、眼疾等多领域受挫 [https://www.pharnexcloud.com/zixun/sd_56446]
- 62. Target Engagement: A Key Factor in Drug Development ... [https://www.pelagobio.com/cetsa-drug-discovery-resources/blog/target-engagement-drug-failure/]
- 63. CRISPR 临床试验:2025 年更新- 创新基因组学研究所(IGI) [https://innovativegenomics.org/zh-CN/%E6%96%B0%E9%97%BB/Crispr-%E4%B8%B4%E5%BA%8A%E8%AF%95%E9%AA%8C-2025/]
- 64. CMC and GMP Guidances [https://www.fda.gov/vaccines-blood-biologics/general-biologics-guidances/cmc-and-gmp-guidances]
- 65. iwCLL 2025丨CLL患者预后新洞见:高危分子标志物胜过 ... [http://www.ihemato.com/Detail?id=908]
- 66. Target Validation - NCBI - NIH [https://www.ncbi.nlm.nih.gov/books/NBK195039/]
- 67. Drug Discovery Workflow - What is it? [https://www.vipergen.com/from-target-to-therapy-a-comprehensive-overview-of-the-drug-discovery-workflow/]
- 68. Screening for Target Engagement using the Cellular Thermal ... [https://www.ncbi.nlm.nih.gov/books/NBK374282/]
- 69. Improving target assessment in biomedical research [https://www.nature.com/articles/s41573-020-0087-3]
- 70. Principle of CETSA [https://www.pelagobio.com/about-cetsa/our-core-technology/]
- 71. Perspective on CETSA Literature: Toward More ... [https://www.sciencedirect.com/science/article/pii/S2472555222065340]
- 72. Principles of early drug discovery - PMC - PubMed Central [https://pmc.ncbi.nlm.nih.gov/articles/PMC3058157/]
- 73. Deep learning based CETSA feature prediction cross ... [https://www.nature.com/articles/s41598-024-51193-6]
- 74. Pharmacokinetics - StatPearls - NCBI Bookshelf - NIH [https://www.ncbi.nlm.nih.gov/books/NBK557744/]
- 75. Optimizing a Drug's Pharmacokinetics [https://www.azolifesciences.com/article/Optimizing-a-Drugs-Pharmacokinetics.aspx]
- 76. Pharmacokinetics: Definition & Use in Drug Development [https://www.allucent.com/resources/blog/what-pharmacokinetics-and-adme]
- 77. Optimizing Pharmacokinetics Through Formulation ... [https://www.mdpi.com/journal/pharmaceutics/special_issues/3258747RV7]
- 78. How to improve the bioavailability of a drug? [https://synapse.patsnap.com/article/how-to-improve-the-bioavailability-of-a-drug]
- 79. Bioavailability Enhancement Techniques for Poorly Aqueous ... [https://pmc.ncbi.nlm.nih.gov/articles/PMC9495787/]
- 80. Formulation Strategies to Improve the Bioavailability of ... [https://pmc.ncbi.nlm.nih.gov/articles/PMC3888743/]
- 81. Optimizing drug delivery systems using systematic "design ... [https://pubmed.ncbi.nlm.nih.gov/15715503/]
- 82. Simulation-based approaches for drug delivery systems [https://www.sciencedirect.com/science/article/pii/S0167732223026958]
- 83. Innovative Pharmaceutical Formulation Strategies to ... [https://www.upm-inc.com/innovative-approaches-in-pharmaceutical-formulation-for-improving-drug-bioavailability]
- 84. Concepts and Challenges in Quantitative Pharmacology ... [https://pmc.ncbi.nlm.nih.gov/articles/PMC2628212/]
- 85. AI and innovation in clinical trials | npj Digital Medicine [https://www.nature.com/articles/s41746-025-02048-5]
- 86. The Future of Clinical Trials with AI and Decentralized ... [https://www.jscdm.org/article/id/448/]
- 87. From automation to self-optimization: The next leap… [https://www.paconsulting.com/newsroom/applied-clinical-trials-from-automation-to-self-optimization-the-next-leap-in-clinical-trial-delivery-3-july-2025]
- 88. Applying quantitative and systems pharmacology to drug ... [https://pmc.ncbi.nlm.nih.gov/articles/PMC11483046/]
- 89. Digital patient engagement: strategies to improve retention ... [https://actide.com/digital-patient-engagement-improve-clinical-trial-retention/]
- 90. Patient Engagement Strategies for Clinical Trials [https://www.obviohealth.com/resources/tech-enabled-human-supported-a-comprehensive-patient-engagement-strategy]
- 91. The future of pharmaceuticals: Artificial intelligence in drug ... [https://www.sciencedirect.com/science/article/pii/S2095177925000656]
- 92. Exploring the ethical issues posed by AI and big data ... [https://pmc.ncbi.nlm.nih.gov/articles/PMC12581208/]
- 93. The future of AI regulation in drug development: a comparative ... [https://pmc.ncbi.nlm.nih.gov/articles/PMC12598624/]
- 94. Addressing AI bias: a human-centric approach to fairness [https://www.ey.com/en_us/insights/emerging-technologies/addressing-ai-bias-a-human-centric-approach-to-fairness]
- 95. Managing Risks in AI-Powered Biomedical Research [https://hai.stanford.edu/news/managing-risks-ai-powered-biomedical-research]
- 96. Bias in AI | Examples, Causes & Mitigation Strategies 2025 [https://kodexolabs.com/bias-in-ai/]
- 97. AI Bias and How to Mitigate It [https://www.summitlaw.com/law-blog/ai-bias-and-how-to-mitigate-it]
- 98. About Biomarkers and Qualification [https://www.fda.gov/drugs/biomarker-qualification-program/about-biomarkers-and-qualification]
- 99. MarkVCID2 Consortium for Clinical Validation of ... [https://pubmed.ncbi.nlm.nih.gov/40977537/]
- 100. Biomarker-Driven Clinical Trials in Oncology [https://www.precisionformedicine.com/blog/biomarker-driven-clinical-trials-in-oncology-enrichment-stratification-all-comers-basket-when-to-use-what-and-why]
- 101. Qualifying a Biomarker through the Biomarker Qualification ... [https://www.fda.gov/drugs/biomarker-qualification-program/qualifying-biomarker-through-biomarker-qualification-program]
- 102. Cancer Biomarkers: Reflection on Recent Progress, Emerging ... [https://pmc.ncbi.nlm.nih.gov/articles/PMC12468363/]
- 103. The Global Neurodegeneration Proteomics Consortium [https://www.nature.com/articles/s41591-025-03834-0]
- 104. A Pathway and Approach to Biomarker Validation ... [https://pmc.ncbi.nlm.nih.gov/articles/PMC3261486/]
- 105. Validation of Analytical Methods for Biomarkers Employed ... [https://pmc.ncbi.nlm.nih.gov/articles/PMC2744124/]
- 106. Biomarker Validation: Common Data Analysis Concerns [https://pmc.ncbi.nlm.nih.gov/articles/PMC4122484/]
- 107. Emerging biomarkers for early cancer detection and diagnosis [https://pmc.ncbi.nlm.nih.gov/articles/PMC12359849/]
- 108. Virtual Patients in Clinical Trials for Drug Development [https://pmc.ncbi.nlm.nih.gov/articles/PMC12228009/]
- 109. Drug discovery and development: introduction to the ... [https://www.frontiersin.org/journals/drug-discovery/articles/10.3389/fddsv.2023.1201419/full]
- 110. Quantitative Systems Pharmacology: An Exemplar Model ... [https://pmc.ncbi.nlm.nih.gov/articles/PMC6617832/]
- 111. Quantitative systems pharmacology [https://en.wikipedia.org/wiki/Quantitative_systems_pharmacology]
- 112. Generating immunogenomic data-guided virtual patients ... [https://www.nature.com/articles/s41698-023-00405-9]
- 113. Supercharging QSP with a Comprehensive View of the ... [https://www.verisimlife.com/publications-blog/supercharging-qsp-with-a-comprehensive-view-of-the-drug-development-process]
- 114. What is Quantitative Systems Pharmacology (QSP)? [https://www.allucent.com/resources/blog/benefits-and-uses-qsp-drug-development]
- 115. Embracing the future of medicine with virtual patients [https://www.sciencedirect.com/science/article/abs/pii/S1359644625000352]
- 116. The Impact of QSP Modeling on the Design ... [https://pmc.ncbi.nlm.nih.gov/articles/PMC12625082/]
- 117. From Lab to Clinic: How Artificial Intelligence (AI) Is ... [https://pmc.ncbi.nlm.nih.gov/articles/PMC12298131/]
- 118. How Generative AI Is Reducing Drug Discovery Timelines by ... [https://prajnaaiwisdom.medium.com/how-generative-ai-is-reducing-drug-discovery-timelines-by-70-e86d58f7c780]
- 119. How AI is Transforming Drug Discovery Processes in 2025 [https://vasro.de/en/impact-ai-drug-discovery-2025/]
- 120. AI in Pharma and Biotech: Market Trends 2025 and Beyond [https://www.coherentsolutions.com/insights/artificial-intelligence-in-pharmaceuticals-and-biotechnology-current-trends-and-innovations]
- 121. AI in Drug Development: Accelerating Discovery, Reducing ... [https://blackthorn.ai/blog/ai-in-drug-development/]
- 122. Fast-Moving Trends in Drug Discovery and Development [https://www.corning.com/worldwide/en/products/life-sciences/resources/stories/the-cutting-edge/fast-moving-trends-in-drug-discovery.html]
- 123. Proteolysis‐Targeting Chimera (PROTAC) - PubMed Central [https://pmc.ncbi.nlm.nih.gov/articles/PMC12495453/]
- 124. What are PROTACs? Mechanisms, advantages, and ... [https://www.drugdiscoverynews.com/what-are-protacs-mechanisms-advantages-and-challenges-16750]
- 125. Antibody-drug conjugates in cancer therapy [https://www.frontiersin.org/journals/cell-and-developmental-biology/articles/10.3389/fcell.2025.1669592/full]
- 126. 三优十周年|CAR-T细胞治疗:现状、挑战与未来方向 - ByDrug [https://bydrug.pharmcube.com/news/detail/b1a088c5f953c0cd3bd7f34d0b47b767]
- 127. Antibody–Drug Conjugates (ADCs): current and future ... [https://jhoonline.biomedcentral.com/articles/10.1186/s13045-025-01704-3]
- 128. The evolving landscape of antibody-drug conjugates ... [https://www.nature.com/articles/s41698-025-01131-0]
- 129. The Future of PROTAC Research: Emerging Opportunities ... [https://panomebio.com/blog/the-future-of-protac-research-emerging-opportunities-and-challenges/]
- 130. Transformative Role of Artificial Intelligence in Drug ... [https://pmc.ncbi.nlm.nih.gov/articles/PMC12406033/]
- 131. Inside ELRIG's Drug Discovery 2025 [https://www.drugtargetreview.com/article/190237/inside-elrigs-drug-discovery-2025/]
- 132. Artificial Intelligence for Drug Development [https://www.fda.gov/about-fda/center-drug-evaluation-and-research-cder/artificial-intelligence-drug-development]
- 133. Regulating the Use of AI in Drug Development: Legal ... [https://www.fdli.org/2025/07/regulating-the-use-of-ai-in-drug-development-legal-challenges-and-compliance-strategies/]
- 134. FDA Announces Completion of First AI-Assisted Scientific ... [https://www.fda.gov/news-events/press-announcements/fda-announces-completion-first-ai-assisted-scientific-review-pilot-and-aggressive-agency-wide-ai]
- 135. AI at the FDA: A new era for drug development and ... [https://sanogenetics.com/resources/blog/ai-at-the-fda]