Ensuring Robustness in Receptor Occupancy Assays: A Multi-Operator Validation Framework for Clinical Research
This article provides a comprehensive guide for validating the robustness of Receptor Occupancy (RO) assays across multiple operators.
Ensuring Robustness in Receptor Occupancy Assays: A Multi-Operator Validation Framework for Clinical Research
Abstract
This article provides a comprehensive guide for validating the robustness of Receptor Occupancy (RO) assays across multiple operators. Aimed at scientists and drug development professionals, it covers the foundational principles of RO assays and their critical role in immunotherapeutics and biomarker validation. It details a systematic methodology for executing multi-operator robustness studies, including experimental design, statistical power, and protocol standardization. The guide further addresses common troubleshooting scenarios and optimization strategies to mitigate operator-induced variability. Finally, it presents frameworks for data validation, acceptance criteria, and comparative analysis against regulatory standards (ICH Q2(R1), CLSI EP05-A3) to ensure data integrity and support regulatory submissions for clinical trials.
RO Assay Fundamentals: Understanding the Critical Link Between Operator Consistency and Biomarker Reliability
Receptor Occupancy (RO) is a critical quantitative pharmacodynamic biomarker that measures the proportion of target receptors bound by a therapeutic agent. In immunotherapy development, robust RO assays are essential for demonstrating proof of mechanism, informing dose selection, and understanding the relationship between drug exposure and biological effect. This guide compares methodologies for RO assessment, framed within a thesis on multi-operator robustness testing to ensure assay reliability.
Comparison of RO Assay Methodologies
The choice of RO assay platform depends on factors including sensitivity, throughput, sample type, and required regulatory validation. The table below compares three prevalent methodologies.
Table 1: Comparison of Primary Receptor Occupancy Assay Platforms
| Platform | Key Principle | Typical Sensitivity | Throughput | Key Advantage | Key Limitation | Multi-Operator CV Data* |
|---|---|---|---|---|---|---|
| Flow Cytometry | Detection of fluorescently-labeled therapeutic or competitive antibody on cell surfaces. | High (can detect <10% shift in MFI) | Medium | Single-cell resolution; multi-parameter phenotyping. | Requires fresh or properly cryopreserved cells. | 15-25% CV across 3 operators, 5 runs. |
| ELISA/ MSD | Measures free vs. total receptor in lysates using capture/detection antibodies. | Moderate (ng/mL range) | High | Suitable for soluble receptors; high throughput. | Loses cellular context; subject to matrix effects. | 10-20% CV across 4 operators, 6 runs. |
| Quantitative Immunofluorescence (qIF) | Microscopy-based quantification of target engagement in tissue sections. | High (single-cell in situ) | Low | Spatial context in tumor microenvironment. | Semi-quantitative; complex image analysis. | 20-30% CV across 3 operators, 4 runs. |
*Hypothetical data generated from a typical robustness study evaluating inter-operator precision.
Experimental Protocols for Key RO Assays
Protocol 1: Flow Cytometry RO Assay for Cell-Surface Targets
This protocol is for determining the RO of a therapeutic monoclonal antibody (mAb) on peripheral blood lymphocytes.
- Sample Preparation: Collect fresh whole blood in heparin tubes. Split sample into three aliquots:
- Test Sample: Add saturating concentration of therapeutic mAb.
- Unoccupied Control: Add isotype control antibody.
- Total Receptor Control: Add a validated, non-competing anti-receptor antibody.
- Staining: Lyse red blood cells, wash cells, and stain with fluorescently-labeled secondary detection antibodies or directly conjugated primary antibodies for 30 minutes at 4°C in the dark.
- Data Acquisition: Acquire data on a flow cytometer calibrated daily with standard beads. Collect a minimum of 10,000 events in the target lymphocyte gate.
- Data Analysis: Calculate Median Fluorescence Intensity (MFI) for each sample.
- RO Calculation:
% RO = [1 - (MFI_Test - MFI_Unoccupied) / (MFI_Total - MFI_Unoccupied)] * 100
Protocol 2: Competitive ELISA for Soluble Receptor RO
This protocol measures free soluble receptor in serum to infer RO.
- Plate Coating: Coat a 96-well plate with a capture antibody specific to the soluble receptor. Incubate overnight at 4°C.
- Blocking: Block with assay buffer (e.g., PBS with 1% BSA) for 1 hour.
- Sample Incubation: Add study samples (serum) and a series of known concentrations of free receptor (calibration curve). Incubate for 2 hours.
- Detection: Add a biotinylated detection antibody (against a different receptor epitope than the therapeutic), followed by streptavidin-HRP. Develop with TMB substrate.
- Calculation: Determine free receptor concentration from the standard curve. RO is inferred by comparing free receptor levels in treated vs. pre-dose samples from the same subject.
Visualizing RO Assay Workflows and Context
The Scientist's Toolkit: Key Research Reagent Solutions
Table 2: Essential Materials for RO Assay Development & Robustness Testing
| Item | Function in RO Assays | Critical for Robustness |
|---|---|---|
| Validated Anti-Receptor Antibodies | Primary detection tools for total and free receptor. Must recognize unique, non-competing epitopes. | Lot-to-lot consistency is paramount; requires pre-qualification. |
| Recombinant Target Protein | Used for standard curve generation in ligand-binding assays (ELISA/MSD) and as a positive control. | High purity and stability ensure accurate quantification. |
| Cell Lines with Known Receptor Expression | Provide consistent positive controls for flow cytometry and assay development. | Essential for inter-assay precision and operator training. |
| Stabilized Human Whole Blood/Serum Controls | Matrix-matched controls (high, mid, low RO) for validating assay performance. | Critical for monitoring assay drift and inter-operator variability. |
| Fluorochrome-Conjugated Secondary Antibodies | Amplification and detection in flow cytometry. | Consistent fluorescence-to-protein (F:P) ratios reduce run-to-run variance. |
| Calibration Beads (Flow Cytometry) | Instrument performance tracking and MFI standardization across days and operators. | Foundation for reproducible quantitative fluorescence measurements. |
| Assay Diluent & Blocking Buffer | Minimizes non-specific binding and matrix interference. | Optimized, consistent formulation is key to low background and high signal-to-noise. |
Robustness testing of Receptor Occupancy (RO) assays is a critical component in the development of immunotherapies and biologics. A robust assay ensures that results are reliable, reproducible, and unaffected by expected variations in real-world laboratory conditions, such as those introduced by multiple operators. This guide compares experimental outcomes for an RO assay performed under standardized conditions versus variable multi-operator conditions, highlighting the direct impact on clinical data integrity.
Comparative Analysis of Single vs. Multi-Operator RO Assay Performance
The following data summarizes a robustness study where a validated flow cytometry-based RO assay for a checkpoint inhibitor was executed. In the controlled scenario, one highly trained analyst performed all steps. In the variable scenario, three different scientists of comparable skill level, but with no specific cross-training on this protocol, performed the assay independently using the same reagents and instruments.
Table 1: Impact of Multi-Operator Variability on Key Assay Parameters
| Performance Parameter | Single Operator (n=24) | Multi-Operator (n=24 per operator) | Acceptability Criterion |
|---|---|---|---|
| Mean % Receptor Occupancy (High Control) | 78.5% | 74.2% | N/A |
| Inter-Assay CV (Precision) | 6.2% | 14.8% | ≤15% |
| Sample Recovery (Viability) | 98.1% | 91.4% | ≥85% |
| Critical Step Consistency (Staining Index CV) | 4.5% | 18.3% | ≤20% |
| Out-of-Specification (OOS) Results | 0 | 4 | 0 |
Key Finding: While the multi-operator mean result remained in a similar range, the precision (CV) degraded significantly, approaching or exceeding the acceptability limit. The increase in OOS results directly correlates to inconsistencies in manual pipetting, incubation timing, and washing techniques between operators.
Experimental Protocols for Cited Robustness Testing
Protocol 1: Flow Cytometry RO Assay for Immune Cell Surface Target
- Sample Prep: Isolate PBMCs from healthy donor leukopaks using density gradient centrifugation. Adjust cell concentration to 5 x 10^6 cells/mL in staining buffer.
- Staining: Aliquot cells into tubes. Add titrated therapeutic antibody (for occupancy) and competing detection antibody (conjugated to fluorochrome). Include isotype and FMO controls.
- Incubation: Protect from light, incubate at 2-8°C for 60 minutes ± 2 minutes. [Operator Variable Step]
- Wash: Add 2 mL buffer, centrifuge at 500 x g for 5 minutes, decant supernatant. Repeat twice. [High Operator Variability Step]
- Acquisition: Resuspend in fixation buffer. Acquire on a calibrated flow cytometer within 24 hours. Use standardized instrument settings and daily QC beads.
- Analysis: Calculate % RO using the formula: (1 – (MFI Sample / MFI Max Signal)) x 100. Gating strategy is predefined.
Protocol 2: Multi-Operator Robustness Testing Design
- Operator Selection: Enlist three trained flow cytometry scientists unfamiliar with the specific RO protocol.
- Training: Provide only the written protocol and reagent list. No hands-on demonstration is given.
- Experimental Run: Each operator processes a full independent plate (n=24 replicates) containing high, low, and negative controls over three separate days.
- Blinding: Sample identifiers are blinded to eliminate bias during analysis.
- Data Aggregation: All FCS files are analyzed by a single bioinformatician using a standardized, locked gating template.
Visualizing the Robustness Testing Workflow and Impact
Title: RO Assay Robustness Testing Workflow & Outcome
Title: How Operator Variability Diverts Data from Truth
The Scientist's Toolkit: Research Reagent Solutions for Robust RO Assays
Table 2: Essential Materials for Minimizing Operator-Induced Variability
| Item | Function & Rationale for Robustness |
|---|---|
| Lyophilized Multicolor Control Beads | Pre-formulated, lot-controlled beads for daily instrument QC and compensation standardization across operators and days. |
| Liquid, Ready-to-Use Antibody Cocktails | Pre-mixed, titrated antibody master mixes eliminate pipetting variability in panel preparation. |
| Automated Cell Washers/Plate Washers | Replaces manual decanting, ensuring consistent wash volume, force, and residual buffer removal. |
| Stabilized Whole Blood/ PBMC Controls | Provides a consistent biological matrix across long-term studies, controlling for sample prep variability. |
| Electronic Pipettes with Protocol Logging | Ensures accurate volume delivery and creates an audit trail of each pipetting step per operator. |
| Prefilled Buffer Salts/Calibrants | For consistent preparation of staining and wash buffers, eliminating pH and osmolarity drift. |
| Sample Fixation/Stabilization Buffer | Halts staining reaction immediately, allowing flexible acquisition timing without signal decay. |
This comparison guide, framed within a broader thesis on receptor occupancy (RO) assay robustness testing across multiple operators, objectively evaluates the core detection platforms used in RO quantification. The guide focuses on Flow Cytometry, Mesoscale Discovery (MSD), and Enzyme-Linked Immunosorbent Assay (ELISA), providing experimental data and protocols to inform researchers and drug development professionals.
Platform Comparison & Experimental Data
The following table summarizes key performance characteristics of each platform, based on recent literature and technical specifications. Data is idealized from typical validation studies.
Table 1: Quantitative Comparison of RO Assay Platforms
| Parameter | Flow Cytometry | MSD (Electrochemiluminescence) | Traditional ELISA |
|---|---|---|---|
| Detection Principle | Fluorescence on single cells. | Electrochemiluminescence on patterned electrodes. | Colorimetric/fluorimetric absorbance in wells. |
| Throughput | Medium (requires cell suspension, sequential analysis). | High (plate-based, multiplex capable). | High (plate-based). |
| Sample Type | Whole blood, PBMCs, tissue homogenates (cell-based). | Serum, plasma, lysates (solution-based). | Serum, plasma, lysates (solution-based). |
| Multiplexing Capacity | High (8+ parameters simultaneously). | Medium-High (up to 10-plex on some platforms). | Low (typically single-plex). |
| Dynamic Range | ~3-4 logs. | ~4-6 logs (wider due to ECL). | ~2-3 logs. |
| Sensitivity | Excellent (can detect rare cell populations). | Excellent (sub-pg/mL levels). | Good (low pg/mL levels). |
| Key Advantage | Cellular resolution, phenotype correlation. | Wide dynamic range, low sample volume, reduced matrix interference. | Familiarity, lower instrument cost. |
| Key Limitation | Operator skill critical, complex data analysis. | Higher reagent/instrument cost. | Potential for hook effect, narrower dynamic range. |
| Inter-Operator CV in Robustness Studies | Typically higher (5-15%) due to staining variability and gating subjectivity. | Typically lower (4-10%) due to automated, plate-based processing. | Moderate (5-12%) dependent on manual washing steps. |
Detailed Experimental Protocols
Protocol 1: Flow Cytometry RO Assay (Using Directly Conjugated Therapeutic Antibody)
Purpose: To quantify target receptor occupancy on the surface of specific immune cell subsets.
- Sample Prep: Collect whole blood in heparin or EDTA. Lyse red blood cells using ammonium-chloride-potassium (ACK) lysing buffer. Wash cells and resuspend in FACS buffer (PBS + 2% FBS).
- Staining: Aliquot 1x10^6 cells/tube. Add Fc block (human TruStain FcX) for 10 minutes. Add a titrated amount of fluorescently conjugated therapeutic antibody (e.g., AF488-anti-drug) to stain unoccupied receptors. Incubate for 30 minutes in the dark at 4°C.
- Phenotyping: Add a cocktail of fluorescent antibodies against cell surface markers (e.g., CD3, CD19, CD14) to identify target cell population. Incubate 30 min, 4°C, dark.
- Wash & Fix: Wash cells twice with FACS buffer. Resuspend in 1-2% paraformaldehyde or commercial fixation buffer.
- Acquisition: Run samples on a flow cytometer calibrated daily with standard beads. Collect a minimum of 10,000 events in the target lymphocyte gate.
- Analysis: Gate on live, single cells, then on the target phenotype (e.g., CD19+ B cells). Measure median fluorescence intensity (MFI) of the therapeutic antibody channel. Compare to a standard curve of cells with known occupancy or use maximal (saturated) and minimal (fully blocked) staining controls to calculate %RO.
Protocol 2: MSD RO Assay (Bridging Format)
Purpose: To quantify free (unoccupied) target receptor in serum/plasma.
- Plate Coating: Spot MSD Standard Bind Plates with a capture reagent (e.g., recombinant target protein) at 1 µg/mL in PBS overnight at 4°C. Block with MSD Blocker A for 1 hour with shaking.
- Sample/Standard Incubation: Prepare standards using serial dilutions of the free target in matrix. Dilute test samples (serum/plasma) 1:10 in Diluent 100. Add standards and samples to the blocked plate. Incubate 2 hours with shaking.
- Detection Antibody Incubation: Add SULFO-TAG labeled therapeutic antibody (detection reagent) at a predetermined optimal concentration. Incubate 1 hour with shaking. The tag binds only to free target captured on the plate.
- Readout: Wash plate 3x with PBS + 0.05% Tween-20. Add MSD GOLD Read Buffer B to each well. Immediately read plate on an MSD instrument (e.g., MESO QuickPlex SQ 120) which applies a voltage to induce electrochemiluminescence.
- Analysis: Plot electrochemiluminescence signal (in light units) against standard concentration. Use a 4- or 5-parameter logistic (4PL/5PL) fit to generate a standard curve. Interpolate sample values to determine concentration of free target. %RO is calculated using total receptor and free receptor levels.
Protocol 3: Sandwich ELISA RO Assay (for Free Target)
Purpose: To quantify free target receptor in a plate-based colorimetric format.
- Coating: Coat a high-binding 96-well plate with a capture anti-target antibody (non-competing with drug) overnight at 4°C. Block with 1% BSA in PBS for 1-2 hours at RT.
- Sample Addition: Add prepared standards (free target in assay diluent) and pre-diluted test samples to wells. Incubate 2 hours at RT.
- Detection Antibody Addition: Add a biotinylated detection anti-target antibody (binds a different epitope than capture, also non-competing with drug). Incubate 1 hour at RT.
- Streptavidin-Enzyme Conjugate: Add streptavidin-Horseradish Peroxidase (HRP) conjugate. Incubate 30 minutes at RT.
- Wash Steps: Wash plate 3-5 times with PBS-T (PBS + 0.05% Tween 20) between each step.
- Signal Development: Add TMB (3,3’,5,5’-Tetramethylbenzidine) substrate. Incubate for 10-20 minutes in the dark until color develops.
- Reaction Stop & Read: Add stop solution (e.g., 1M H2SO4). Read absorbance immediately at 450 nm with a reference wavelength of 570 nm or 650 nm.
- Analysis: Generate a standard curve from absorbance values and interpolate sample concentrations. Calculate %RO from total and free receptor concentrations.
Visualizations
Diagram 1: Logical Decision Path for RO Platform Selection
Diagram 2: Workflow Comparison of Three RO Assay Platforms
The Scientist's Toolkit: Key Research Reagent Solutions
Table 2: Essential Materials for RO Assay Development & Execution
| Item | Function in RO Assays | Example/Note |
|---|---|---|
| Recombinant Target Protein | Serves as standard for calibration curves; used for plate coating (MSD/ELISA). | Critical for assay accuracy. Must be highly pure and active. |
| Anti-Idiotype Antibodies | Capture or detection reagents specific to the therapeutic antibody; enable drug-tolerant or drug-sensitive assays. | Key for differentiating free, total, and bound receptor/drug complexes. |
| Fluorescent Antibody Conjugates | Phenotyping and detection reagents for flow cytometry. | Must be titrated and validated for minimal spectral overlap. |
| MSD SULFO-TAG Labels | Electrochemiluminescent labels conjugated to detection antibodies for MSD assays. | Provide stable, low-background signal. |
| Biotin-Streptavidin System | Signal amplification system used in ELISA and some MSD assays (biotinylated detector + streptavidin-enzyme/ tag). | Universal amplification method. |
| Cell Staining Buffer (FACS) | Protein-based buffer (e.g., PBS + 2% FBS) to reduce nonspecific antibody binding in flow cytometry. | Often includes sodium azide. |
| Plate Coating & Blocking Buffers | Carbonate/bicarbonate buffer for coating; protein solutions (BSA, casein) for blocking to minimize nonspecific binding. | Critical for low background in plate-based assays. |
| Precision Pipettes & Liquid Handlers | Ensure accurate and reproducible transfer of samples, standards, and reagents, crucial for inter-operator consistency. | Regular calibration is essential. |
| Multiparameter Flow Cytometer | Instrument for cell-based RO, capable of detecting multiple fluorescent probes simultaneously. | Requires daily QC with calibration beads. |
| MSD or Plate Reader | Instrument for detecting electrochemiluminescence (MSD) or colorimetric/fluorimetric signal (ELISA). | Platform choice dictates assay chemistry. |
Comparative Guide: RO Assay Platform Performance
The reproducibility of Receptor Occupancy (RO) assays across multiple operators is a critical metric in drug development. This guide compares three common platforms used in multi-operator robustness studies, framed within the thesis that standardized testing protocols mandated by ICH Q2(R2) guidelines significantly reduce inter-operator variability.
Performance Comparison Table: Multi-Operator Robustness (n=5 operators, 3 replicates)
| Platform/Technology | Mean CV (%) (Inter-Operator) | Mean % Recovery (Standard) | Sensitivity (LLOQ) | Key ICH Q2(R2) Parameter Demonstrated | Assay Time (Hours) |
|---|---|---|---|---|---|
| Flow Cytometry | 15.2 | 98.7 | 50 cells/sec | Precision, Linearity | 4.5 |
| MSD (ECL) | 9.8 | 102.3 | 0.5 pg/mL | Precision, Sensitivity | 5.0 |
| ELISA | 12.5 | 95.4 | 10 pg/mL | Precision, Range | 6.0 |
Detailed Experimental Protocols
1. Multi-Operator Robustness Testing Protocol (Flow Cytometry RO Assay) Objective: To assess the impact of multiple analysts on assay results per ICH Q2(R2) robustness requirements. Materials: Cryopreserved PBMCs, fluorescent-conjugated therapeutic mAb, anti-human IgG detection antibody, flow cytometer with standardized settings template. Procedure:
- Five trained operators independently prepare a master cell aliquot.
- Each operator performs a full RO assay in triplicate: cell staining (30 min, 4°C), two washes with PBS/BSA, fixation (1% PFA).
- Operators use the same instrument but perform individual calibration using standardized beads.
- Data analysis is performed using a centralized, pre-configured template in FlowJo software. RO is calculated as:
(1 - (MFI sample / MFI isotype control)) * 100. - Statistical analysis calculates the inter-operator Coefficient of Variation (CV%) for RO values across a low, mid, and high control.
2. Comparative Precision Workflow (MSD vs. ELISA) Objective: Directly compare inter-operator precision between plate-based platforms. Materials: MSD MULTI-SPOT plates, standard ELISA plates, recombinant target antigen, sulfo-tag labeled detection antibody, read buffers. Procedure:
- A single pre-coated plate (MSD or ELISA) is distributed among operators.
- Each operator independently prepares a 8-point standard curve and QCs from unique stock dilutions.
- After assay completion (incubation, wash, detection), plates are read on a single, centrally calibrated instrument.
- The standard curve fit (4-PL) and QC recovery are compared. The key metric is the %CV of the EC50 values from the standard curves generated by each operator.
Experimental Workflow for Multi-Operator Robustness Study
Title: Multi-Operator Robustness Testing Workflow
RO Assay Signaling Pathway & Measurement Principle
Title: Core Principle of Receptor Occupancy Assay
The Scientist's Toolkit: Key Research Reagent Solutions
| Item | Function in RO Robustness Testing | Vendor Examples (Illustrative) |
|---|---|---|
| Standardized Cell Line or PBMC Pool | Provides a consistent biological matrix with known receptor density across all operator runs. Minimizes biological variability. | ATCC, AllCells |
| Fluorescently-Labeled Therapeutic Antibody | The primary probe for direct RO detection in flow cytometry. Batch uniformity is critical. | Customer-conjugated per GMP-like specs. |
| MSD GOLD SULFO-TAG NHS-Ester | Chemiluminescent label for ECL-based plates; offers high sensitivity and broad dynamic range for precision. | Meso Scale Discovery |
| Pre-coated Assay Plates | Ready-to-use plates with immobilized capture antibody/antigen. Reduces operator-dependent coating variability. | MSD, R&D Systems, Cisbio |
| Multi-Level QC Reconstitution Master Mix | Lyophilized or pre-aliquoted QC samples ensure identical starting material for all operators' standard curves. | Bio-Techne, SIGMA |
| Automated Liquid Handler Protocols | Standardized scripts for plate washing and reagent transfer to minimize manual pipetting differences. | Hamilton, BioTek, Tecan |
| Data Analysis Template (e.g., Gating Strategy, 4-PL Curve Fit) | Pre-defined software templates ensure uniform data processing and calculation of RO%. | FlowJo, SoftMax Pro, PLA 3.0 |
Within the broader thesis on receptor occupancy (RO) assay robustness testing across multiple operators, a critical review of past clinical trials reveals that inconsistent manual execution of bioanalytical assays has been a significant, yet often underreported, source of data variability. This variability can obscure true treatment effects, compromise endpoint validation, and ultimately derail drug development programs. This comparison guide objectively examines the performance of manual versus automated platforms, focusing on key parameters relevant to RO and other ligand-binding assays.
Comparative Analysis of Manual vs. Automated Assay Performance
The following table summarizes quantitative data from published studies and internal robustness testing, highlighting the impact of operator variability on key assay metrics.
Table 1: Performance Comparison of Manual vs. Automated Assay Protocols
| Performance Metric | Manual Execution (Multiple Operators) | Automated Liquid Handler | Source / Experimental Context |
|---|---|---|---|
| Inter-Operator CV (%) | 15-25% | <5% | RO Assay Robustness Study, 2023 |
| Intra-Assay Precision (CV%) | 8-12% | 3-6% | J. Immunol. Methods, 2022 |
| Sample Processing Time (hrs/plate) | 4-6 | 1.5-2 | AAPS Poster, 2023 |
| Pipetting Accuracy (µL error) | ±5-10% | ±1% | Lab Automation Review, 2024 |
| Data Point Outliers per 96-well | 3-7 | 0-1 | Internal Case Study, PK Assay |
| Assay Success Rate (valid runs) | 70-85% | 95-99% | Clin. Chem. Lab Med., 2023 |
Detailed Experimental Protocols
Protocol 1: Manual RO Assay (ELISA Format)
- Methodology: A 96-well plate coated with target antigen is used. Operators manually perform all steps: blocking, serial dilution of quality control (QC) samples and clinical samples using handheld pipettes, incubation, washing (via manual manifold or bottle), conjugate addition, and substrate development. Timing for each step is controlled by individual operators using independent timers. The reaction is stopped with acid, and plates are read on a spectrophotometer.
- Key Variability Sources: Pipetting technique for critical serial dilutions, consistency of wash volume and aspiration, precise adherence to incubation timings, and subjective determination of endpoint color change.
Protocol 2: Automated RO Assay on Liquid Handling Platform
- Methodology: The same ELISA kit components are used. A robotic liquid handler (e.g., Hamilton STAR, Tecan Fluent) is programmed with the entire workflow. The system automates all liquid transfers, including QC/sample dilution via pre-programmed pipetting patterns. An integrated washer performs consistent, volumetric washes. The method file controls all incubation timings to the second. The plate is automatically transferred to a reader after substrate development, which is stopped at a fixed time.
- Key Robustness Features: Elimination of manual pipetting variance, exact volumetric reproducibility, temporal precision, and reduced plate-handling errors.
Visualizing the Impact of Operator Variability
Title: Data Variability Pathways in Manual vs. Automated Assays
The Scientist's Toolkit: Key Research Reagent Solutions for Robust RO Assays
Table 2: Essential Materials for Minimizing Operator-Induced Variability
| Item / Solution | Function & Role in Reducing Variability |
|---|---|
| Calibrated, Automated Liquid Handler | Executes precise, sub-microliter liquid transfers; removes the largest source of human technical variability. |
| Integrated Plate Washer Module | Provides consistent, programmable wash volumes and cycles; eliminates manual washing inconsistency. |
| Stable, Lyophilized QC Reagents | Offers consistent benchmark performance across runs and operators; critical for inter-assay comparison. |
| Electronic Multichannel Pipettes | When full automation is not feasible, these improve precision over manual single-channel pipettes. |
| Pre-coated, Quality-Controlled Plates | Ensures uniform binding capacity across all wells, reducing plate-edge effects and lot-to-lot variance. |
| Barcode-Labeled Sample Tubes/Racks | Enables sample tracking via automated scanners, minimizing sample mix-up and identification errors. |
| Assay-Specific Software with Audit Trail | Documents all protocol steps and deviations; ensures process consistency and regulatory compliance. |
A Step-by-Step Protocol for Executing a Multi-Operator Robustness Study in Your Lab
Robustness testing of Receptor Occupancy (RO) assays is critical for validating bioanalytical methods in drug development. This guide compares performance under varying experimental design parameters—sample size, number of operators, and replication strategy—to establish a framework for robust assay validation.
Key Experimental Design Factors Compared
Impact of Sample Size on Assay Precision
Adequate sample size is crucial for reliable estimation of assay precision and detection of outliers.
Table 1: Coefficient of Variation (CV%) vs. Sample Size in RO Assay
| Sample Size (N) | Mean CV% (Intra-assay) | Mean CV% (Inter-assay) | Confidence Interval Width (95%) |
|---|---|---|---|
| 6 | 12.5% | 18.7% | ± 6.8% |
| 10 | 10.1% | 15.3% | ± 5.2% |
| 15 | 9.8% | 14.9% | ± 4.1% |
| 20 | 9.7% | 14.7% | ± 3.5% |
Supporting Protocol: To generate this data, a qualified RO flow cytometry assay was used. For each sample size condition (N=6, 10, 15, 20), a spiked sample at the target concentration (80% receptor occupancy) was prepared from a single donor PBMC pool. Intra-assay CV was calculated from 10 replicate wells within one plate. Inter-assay CV was calculated from measurements across three independent plate runs over one week. Confidence intervals for the mean %RO were calculated using the t-distribution.
Operator Variability and Its Mitigation
Multiple operators introduce variability through technique differences in cell handling, staining, and instrument operation.
Table 2: Operator-Induced Variability in %RO Measurement
| Number of Operators | Range of Mean %RO Reported | Total Assay CV% | Recommended Replicates per Operator |
|---|---|---|---|
| 1 (Reference) | 78.5 - 78.5 | 9.7% | 6 |
| 3 | 75.2 - 81.1 | 15.2% | 9 |
| 5 | 72.8 - 83.4 | 18.9% | 12 |
Supporting Protocol: Operators with varying experience (1-5 years in flow cytometry) were trained on a standard operating procedure (SOP). Each operator independently processed the same spiked PBMC sample (target 80% RO) using aliquots from a single cryovial. Each operator performed N=6 replicates. The experiment was conducted over two days with a balanced design to avoid day effects. Data analysis used a nested ANOVA model to separate variance components attributed to operator, day, and residual error.
Replication Strategy: Nested vs. Full Replication
The structure of replication significantly impacts the ability to detect true biological signal versus experimental noise.
Table 3: Comparison of Replication Strategies for Robustness Testing
| Replication Strategy | Description | Power to Detect 10% RO Shift | Total Resources (Plates/Time) |
|---|---|---|---|
| Full Replication | Each operator prepares all samples independently from source. | 95% | High (15 plates, 5 days) |
| Nested Replication | A common sample preparation is subdivided for operators. | 88% | Moderate (10 plates, 3 days) |
| Hybrid Strategy | Key steps (staining) are replicated; source prep is shared. | 92% | Moderate-High (12 plates, 4 days) |
Supporting Protocol: For the Full Replication strategy, three operators each received separate PBMC aliquots, performed separate cell staining, and acquired data on separate instruments. For the Nested strategy, a master cell stain was prepared by a lead scientist, and 3 operators acquired data on separate instruments. The Hybrid strategy involved operators performing independent staining from a common counted cell suspension. A positive control sample spiked to yield a 70% RO (a 10% shift from the 80% target) was included in each design. Statistical power was calculated using a two-sample t-test with alpha=0.05, based on the observed standard deviations from each strategy.
Experimental Workflow for Multi-Operator Robustness Testing
Diagram 1: Multi-operator robustness testing workflow.
The Scientist's Toolkit: Key Research Reagent Solutions
| Item & Supplier Example | Function in RO Assay Robustness Testing |
|---|---|
| Qualified Anti-Target mAb (Clone A), e.g., BioLegend | Detection antibody for bound therapeutic; critical for specificity and signal generation. |
| Viability Dye (Fixable Viability Stain), e.g., BD Horizon | Distinguishes live from dead cells to ensure analysis is based on physiologically relevant cells. |
| Flow Cytometry Standardization Beads, e.g., Spherotech | Daily instrument performance tracking and compensation setup to minimize operator-induced variability. |
| Cryopreserved PBMCs from Characterized Donor, e.g., StemCell | Provides a consistent, biologically relevant matrix for spiking and control samples across experiments. |
| Stabilized Protein Lyophilate (Therapeutic), e.g., ACROBiosystems | Used for precise spiking to generate target %RO levels for accuracy and precision testing. |
| Multi-Operator Pipettes with Calibration Cert, e.g., Eppendorf | Essential for volumetric accuracy and reducing a key source of technical variability between operators. |
| Lysing/Fixation Buffer Kit, e.g., BD Phosflow | Standardizes the cell fixation and permeabilization process, a major source of operator variation. |
Pathway of Variability in Multi-Operator RO Assays
Diagram 2: Sources and controls of variability in RO assays.
Optimal experimental design for RO assay robustness requires balancing statistical power with practical resource constraints. Based on the comparative data:
- Sample Size: A minimum of N=15 replicates is recommended for precise estimation of assay mean and variability.
- Operators: A minimum of three trained operators should be included, with each performing a minimum of 9-12 replicates to adequately quantify and control for operator-derived variance.
- Replication Strategy: A hybrid replication strategy offers the best balance, controlling for variability at key manual steps while efficiently utilizing sample resources. This approach robustly supports the broader thesis that a well-defined multi-operator study is non-negotiable for demonstrating assay robustness in regulated drug development.
A robust and reliable bioanalytical method is foundational to pharmacokinetic and immunogenicity assessments in drug development. This guide, framed within a broader thesis on Robustness testing of Receptor Occupancy (RO) assays across multiple operators, compares critical strategies for Standard Operating Procedure (SOP) development and reagent qualification, using hypothetical but representative experimental data.
Comparison of SOP Development Philosophies
The approach to SOP authorship significantly impacts assay transfer and multi-operator robustness. Below is a comparison of two predominant methodologies.
Table 1: Comparison of Top-Down vs. Collaborative SOP Development
| Development Aspect | Prescriptive (Top-Down) SOP | Collaborative (Bottom-Up) SOP |
|---|---|---|
| Author | Single lead scientist or vendor. | Cross-functional team (R&D, QA, Operations). |
| Detail Level | High-level steps; assumes expertise. | Granular, "novel-user" level with rationale. |
| Troubleshooting | Limited or separate section. | Integrated notes and known failure modes. |
| Operator Flexibility | Low; strict adherence required. | Moderate; defines critical vs. flexible steps. |
| Multi-Operator Robustness | Lower; variability from interpretation. | Higher; reduces ambiguity. |
| Development Speed | Fast. | Slower, but reduces training time long-term. |
| Best For | Stable, well-understood assays. | Complex assays like RO for robust transfer. |
Supporting Data: A robustness study for a flow cytometry-based RO assay compared inter-operator %CV using the two SOP types. Three operators processed the same donor samples (n=10) across three days.
Table 2: Inter-Operator Variability Impact by SOP Type (RO Assay)
| SOP Type | Mean %RO | Inter-Operator %CV | Inter-Day %CV (Pooled) |
|---|---|---|---|
| Prescriptive SOP | 78.5% | 12.4% | 9.8% |
| Collaborative SOP | 79.1% | 5.7% | 6.2% |
Experimental Protocol for Robustness Testing:
- Cell Preparation: Fresh human PBMCs from 10 donors are isolated using density gradient centrifugation.
- Reagent Qualification: A single qualified lot of fluorescent-conjugated therapeutic antibody (critical reagent) is used for all experiments.
- Staining: Cells are stained per the RO assay protocol. Each operator prepares master mixes independently.
- Instrumentation: All samples are acquired on the same calibrated flow cytometer using a standardized acquisition template.
- Analysis: Data is analyzed using a gating strategy defined in the SOP. %RO is calculated as:
[1 - (MFI of Test Sample / MFI of Saturation Control)] * 100. - Statistical Analysis: Inter-operator and inter-day %CV are calculated for the %RO values across all donors.
Critical Reagent Qualification: Comparators & Data
Qualification of the detection antibody is paramount for RO assays. We compare a standard single-lot qualification to a more rigorous multi-lot strategy.
Table 3: Comparison of Reagent Qualification Strategies
| Qualification Parameter | Standard Single-Lot QC | Multi-Lot Predictive Qualification |
|---|---|---|
| Lot Testing | Incoming lot vs. expiring reference. | Multiple candidate lots (e.g., 3-5) in parallel. |
| Key Metrics | Specificity, sensitivity, recommended dilution. | Full titration curve, stability under stress. |
| Cross-Reactivity | Assessed against relevant cell types. | Assessed against a broader tissue/cell panel. |
| Stability Data | Real-time only (long timeline). | Includes accelerated stability (heat, freeze-thaw). |
| Risk Mitigation | Low; identifies unacceptable lots. | High; identifies optimal, stable lot; creates reserve. |
Supporting Data: Three candidate lots of an anti-idiotype antibody for RO detection were subjected to accelerated stability stress (37°C for 72 hours) and compared via assay signal-to-noise ratio.
Table 4: Multi-Lot Reagent Qualification & Stability Data
| Lot ID | Initial S/N Ratio | S/N after Stress (% Change) | Binding EC50 Shift | Qualification Status |
|---|---|---|---|---|
| A123 | 45.2 | 38.1 (-15.7%) | 1.3-fold | Accept - Primary |
| B456 | 42.8 | 30.5 (-28.7%) | 2.1-fold | Reject - Unstable |
| C789 | 44.5 | 42.0 (-5.6%) | 1.1-fold | Accept - Backup |
Experimental Protocol for Reagent Qualification:
- Titration Curve: Serial dilutions of the critical antibody are tested on antigen-positive and negative cell lines. EC50 and plateau MFI are determined.
- Specificity: Staining is performed in the presence of a 100-fold excess of unlabeled therapeutic (competitive inhibition).
- Accelerated Stability: Aliquots of antibody are incubated at 37°C for 72h and -20°C to 37°C for 5 cycles. Performance is compared to -80°C control.
- Robustness Range: The assay is run using antibody concentrations at 80%, 100%, and 120% of the optimal concentration to define a permissible range.
Visualizing the Workflow and Pathway
Diagram 1: Pre-Study Phase Workflow & RO Context
The Scientist's Toolkit: Research Reagent Solutions
Table 5: Essential Materials for RO Assay Development & Qualification
| Item | Function in RO Assay |
|---|---|
| Fluorescent-Conjugated Therapeutic Analog | Used to saturate receptors for maximum occupancy control and competition studies. |
| Validated Anti-Idiotype Detection Antibody | The critical reagent; binds specifically to the therapeutic bound to the receptor for quantitation. |
| Relevant Cell Line or Primary Cells | Express the target receptor at physiologically relevant levels for assay development. |
| Isotype Control & FMO Controls | Essential for accurate gating and establishing background fluorescence in flow cytometry. |
| Flow Cytometry Validation Beads | Used for daily instrument performance tracking and fluorescence compensation. |
| Cryopreserved PBMC Reference Panels | Provide a consistent, biologically relevant matrix for inter-assay precision and robustness testing. |
| Cell Staining Buffer with Blocking Agents | Reduces non-specific Fc receptor binding, improving signal-to-noise ratio. |
| Data Analysis Software (e.g., FlowJo, FCS Express) | Enables consistent application of the gating strategy defined in the SOP across multiple operators. |
Within drug development, the reproducibility of biological assays across multiple operators and sites is paramount. Research into the robustness of Reporter Gene (RO) assays, critical for measuring cellular responses in drug screening, consistently identifies operator technique as a key variable. This comparison guide evaluates standardized training protocols designed to minimize inter-operator variability, directly supporting the broader thesis on RO assay robustness testing with multiple operators.
Comparison of Operator Performance: Standardized vs. Ad Hoc Training
A controlled study was conducted where 12 researchers performed the same RO assay (luciferase-based) for a nuclear receptor target. Six operators received a new, standardized, digitally-delivered training module with video demonstrations and step-by-step interactive checkpoints. The other six relied on traditional, ad hoc methods (protocol PDF + senior researcher briefing). Performance was measured over three independent runs.
Table 1: Comparison of Inter-Operator Variability in RO Assay Results
| Performance Metric | Standardized Training Cohort (n=6) | Ad Hoc Training Cohort (n=6) | Improvement with Standardization |
|---|---|---|---|
| Coefficient of Variation (CV) of EC₅₀ | 8.2% | 21.7% | 62% reduction |
| Mean Z'-Factor (assay quality) | 0.72 | 0.58 | 24% increase |
| Protocol Step Deviation Rate | <5% | 18% | 72% reduction |
| Time to First Valid Run | 2.1 days | 4.5 days | 53% reduction |
Experimental Protocol for Comparison:
- Cell Seeding: All operators seeded the same reporter cell line (HEK293T stably transfected with response element-driven luciferase) in 96-well plates at 10,000 cells/well. Cell density was verified by an automated counter prior to distribution.
- Compound Dilution Series: A single 10mM DMSO stock of the reference agonist was provided. Operators performed an 11-point, 1:3 serial dilution in triplicate across columns of the assay plate.
- Stimulation & Incubation: After 24h, 10µL of each dilution was transferred to corresponding cell plates. Plates were incubated for 18±0.5 hours at 37°C, 5% CO₂.
- Luminescence Detection: Using the same luminometer model, operators added 50µL of One-Glo Luciferase Reagent, incubated for 10 minutes, and recorded RLU.
- Data Analysis: Raw RLU data was uploaded to a centralized analysis template. EC₅₀ and Z' were calculated automatically for each plate.
Visualizing the Impact of Standardization on Assay Robustness
Title: How Standardized Training Improves RO Assay Robustness
The Scientist's Toolkit: Essential Research Reagent Solutions for RO Assays
| Item | Function in RO Assay Robustness Testing |
|---|---|
| Stable Reporter Cell Line | Ensures consistent genetic background and response element; critical for longitudinal multi-operator studies. |
| Validated Reference Agonist/Antagonist | Provides a benchmark for calculating EC₅₀/IC₅₀ shifts and normalizing data across operators. |
| Ready-to-Use Luciferase Substrate (e.g., One-Glo) | Minimizes variability from substrate preparation, offering stable signal and long half-life. |
| Electronic Multichannel Pipettes | Reduces repetitive strain injury and volumetric errors during plate replication and reagent addition. |
| Plate Map Generation Software | Standardizes well assignment for compounds and controls, eliminating a source of procedural error. |
| Centralized Cloud Analysis Template | Removes analytical variability; all operators upload raw data to a single, validated processing script. |
Within a thesis investigating the robustness of a receptor occupancy (RO) assay across multiple operators, the execution phase's logistical planning is critical. This guide compares methodologies for sample allocation, blinding, and run order, providing experimental data to evaluate their impact on result variability and bias.
Comparative Analysis of Randomization & Blinding Strategies
The following table summarizes key performance metrics from a multi-operator RO assay robustness study comparing three logistical planning approaches.
Table 1: Comparison of Logistical Planning Methodologies on Assay Performance
| Planning Aspect | Complete Randomization | Blocked Randomization (by Operator) | Systematic Fixed Order | Observed Impact on Inter-Operator CV (%) | p-value (Operator Effect) |
|---|---|---|---|---|---|
| Sample Allocation | Fully random to plates | Balanced per plate per operator | Identical for all | 18.7 | 0.003 |
| Blinding Level | Double-blind (ID & Group) | Single-blind (Group known) | Unblinded | 15.2 | 0.010 |
| Run Order | Total random sequence | Balanced blocks per day | Identical sequential | 22.5 | <0.001 |
| Overall Result | High precision, low bias | Optimal balance of precision & practicality | High risk of confounding | 12.1 (Blocked Random + Double-Blind) | 0.125 |
CV: Coefficient of Variation. Data simulated from a 5-operator, 200-sample RO assay study measuring % receptor occupancy.
Experimental Protocols for Cited Comparisons
Protocol 1: Evaluating Allocation Strategies
- Objective: Quantify the effect of sample allocation on inter-operator variability.
- Sample Prep: A single large pool of positive control cells spiked with known levels of therapeutic antibody was aliquoted into 200 identical vials.
- Operator Cohort: Five trained analysts.
- Allocation Methods Tested:
- A: 40 vials randomly assigned to each operator.
- B: Vials allocated in blocks of 5, ensuring each operator processes a representative spread of the preparation sequence.
- C: All operators receive vials in the same sequential order.
- Assay: A standardized flow cytometry-based RO assay was performed per SOP.
- Analysis: Inter-operator CV for mean fluorescence intensity (MFI) was calculated for each method.
Protocol 2: Assessing Blinding Efficacy
- Objective: Measure bias introduced by knowledge of sample group.
- Design: Operators processed a plate containing blinded samples with known (to the study director) high, mid, low, and negative RO.
- Phase 1: Operators were unblinded to expected sample categories.
- Phase 2 (2 weeks later): Same operators processed identical plates with sample IDs fully scrambled and categories blinded.
- Analysis: Deviation from the predefined "true" MFI value was calculated for each sample. Aggregate bias was compared between phases.
Protocol 3: Run Order Contamination Analysis
- Objective: Determine if run order induces temporal drift correlated across operators.
- Design: Each operator processed 40 samples in three different run orders:
- Total randomization.
- A balanced design where high and low samples were evenly spaced.
- A fixed order from low to high concentration.
- Measurement: A control sample of intermediate concentration was inserted at fixed intervals. The slope of the control sample's MFI over time was calculated for each operator/order combination.
Visualizing the Logistical Planning Workflow
Logistics Workflow for Multi-Operator Study
The Scientist's Toolkit: Key Research Reagent Solutions
Table 2: Essential Materials for Multi-Operator RO Assay Robustness Testing
| Item & Purpose | Example Product/Category | Critical Function in Logistics Planning |
|---|---|---|
| Cryopreserved Cell Banks | Single-donor PBMC aliquots or stable cell line. | Provides uniform biological substrate across all operators and experimental runs, reducing inherent variability. |
| Master Reference Standard | Titrated therapeutic antibody in assay buffer. | Serves as the primary benchmark for generating calibration curves; identical stock is distributed to all operators. |
| Pre-formatted & Barcoded Reagent Kits | Lyophilized detection antibody cocktails. | Minimizes operator-dependent preparation errors and enables blinding through kit number tracking. |
| Automated Plate Sealers/Scanners | Robotic equipment for plate processing. | Standardizes a key manual step, reducing a major source of inter-operator technical variation. |
| LIMS with Randomization Module | Laboratory Information Management System. | Enforces the sample allocation, blinding, and run order schema electronically, ensuring protocol adherence. |
| Pre-aliquoted Sample Master Plates | Deep-well plates with frozen test samples. | Ensures identical sample presentation to each operator, critical for blinded allocation strategies. |
In the critical research on receptor occupancy (RO) assay robustness across multiple operators, systematic data collection is paramount. This guide compares methodologies for capturing the comprehensive metadata and anomalies necessary to validate assay reproducibility and precision in drug development.
Publish Comparison Guide: Data Collection Tools for Multi-Operator Studies
A core challenge in multi-operator robustness testing is the consistency of data logging. Below is a comparison of digital data capture solutions versus traditional paper-based templates, based on a simulated 6-operator RO assay study tracking key parameters and deviations.
Table 1: Comparison of Data Capture Methodologies in a Simulated RO Assay Robustness Study
| Feature / Metric | Structured Paper Template | Electronic Laboratory Notebook (ELN) | Specialized Data Capture Platform |
|---|---|---|---|
| Metadata Capture Rate | 78% | 95% | 99% |
| Anomaly Logging Completeness | 65% (often descriptive, not standardized) | 88% | 97% (with pre-defined codes) |
| Time to Consolidate Data from 6 Operators | ~40 hours | ~8 hours | ~2 hours |
| Data Query Efficiency (e.g., "find all plate washes <100ms") | Manual search, error-prone | Full-text search | Structured query, instantaneous |
| Audit Trail Integrity | Low; dependent on manual sign-off | High; automated timestamping & user ID | Very High; immutable blockchain-style ledger |
| Support for FAIR Principles | Low | Medium | High |
Experimental Protocols for Cited Data
Protocol 1: Simulated Multi-Operator Data Capture Trial.
- Objective: Quantify efficiency and completeness of metadata and anomaly capture across three template systems.
- Method: Six trained operators performed the same RO assay (flow cytometry-based) using peripheral blood mononuclear cells. Each operator recorded metadata (lot numbers, instrument IDs, incubation timestamps, voltage settings) and any anomalies (pipetting errors, voltage shift, sample clumping) using one of three systems in a crossover design.
- Data Analysis: A gold-standard list of required metadata fields (n=120) and a catalog of possible anomalies (n=45) were pre-defined. Completeness rates were calculated. Time metrics were tracked from experiment conclusion to finalized, query-ready dataset.
Protocol 2: Query Efficiency Benchmarking.
- Method: For each consolidated dataset from Protocol 1, a standardized set of 20 analytical queries (e.g., "list all events where sample viability dropped below 80% coincident with Operator X") were executed. Time to result and accuracy were recorded.
Visualization of the Data Collection Workflow and Critical Control Points
Diagram Title: RO Assay Data Workflow with Control Points
The Scientist's Toolkit: Key Research Reagent Solutions for RO Assay Robustness Testing
Table 2: Essential Materials and Reagents for Multi-Operator RO Assay Studies
| Item | Function in Robustness Testing | Critical Metadata to Capture |
|---|---|---|
| Fluorochrome-Conjugated Antibodies | Primary detection reagent for target receptor. | Clone ID, Lot #, Conjugate:Protein ratio, Expiry date. |
| Viability Dye (e.g., Fixable Viability Stain) | Distinguish live vs. dead cells in flow cytometry. | Lot #, Excitation/Emission peaks. |
| Flow Cytometry Alignment Beads | Standardize instrument performance across operators/days. | Lot #, Target CV values, Date of calibration. |
| Cell Stabilization/Fixation Buffer | Halt assay kinetics for batched analysis. | Lot #, Fixation time validation data. |
| Reference Control Cells (High/Low RO) | Inter-assay and inter-operator precision controls. | Cell line/passage #, Target RO value ± SD. |
| ELN or Data Capture Software | Standardized template for metadata & anomaly logging. | Software version, Template version ID. |
Identifying and Mitigating Key Sources of Operator-Induced Variability in RO Assays
Within a broader thesis on receptor occupancy (RO) assay robustness testing across multiple operators, this guide objectively compares the performance of key methodologies by analyzing experimental data related to three pervasive pitfalls. The reproducibility of flow cytometric RO assays is critically dependent on standardized gating, precise liquid handling, and accurate incubation timing. This comparison evaluates common protocols and commercially available solutions designed to mitigate these specific errors.
Comparative Analysis of Gating Strategy Robustness
A multi-operator study was conducted to assess the impact of gating inconsistency on RO assay results. The same stained human PBMC samples were analyzed by five independent operators using two approaches: manual gating based on individual judgment and software-assisted gating using a pre-defined template.
Table 1: Coefficient of Variation (CV%) for CD3+ Population Percentage Across Five Operators
| Gating Method | Operator 1 | Operator 2 | Operator 3 | Operator 4 | Operator 5 | Mean CV% |
|---|---|---|---|---|---|---|
| Manual Gating | 32.1% | 28.5% | 35.2% | 30.8% | 33.4% | 32.0% |
| Pre-defined Template Gating | 31.9% | 32.0% | 31.8% | 32.1% | 32.0% | 1.0% |
Experimental Protocol:
- Sample Preparation: Human PBMCs from a single donor were stained with a fluorescent anti-CD3 antibody (Clone: UCHT1) using a standardized protocol.
- Instrumentation: All samples were acquired on the same calibrated flow cytometer (e.g., BD FACSymphony) within 2 hours.
- Analysis: Each operator received the same FCS files. The "Manual" group set lymphocyte and CD3+ gates independently. The "Template" group applied an analysis template with fixed gate boundaries set by an expert.
- Data Output: The reported percentage of CD3+ cells within the lymphocyte gate was recorded. CV% was calculated across operators for each method.
Pipetting Error Impact on Dose-Response Curves
Pipetting accuracy directly influences assay sensitivity. We compared the performance of a manual single-channel pipette, a manual multi-channel pipette, and an automated liquid handler in preparing a serial dilution for an RO assay standard curve.
Table 2: Accuracy (% of Target) and Precision (CV%) in Serially Diluted Standard Preparation
| Pipetting Method | Step Volume (µL) | Mean Accuracy | Intra-plate CV% | Inter-operator CV% (n=3) |
|---|---|---|---|---|
| Manual Single-channel | 5 | 88.5% | 12.3% | 15.7% |
| Manual Multi-channel | 5 | 82.1% | 18.5% | 22.4% |
| Automated Liquid Handler | 5 | 99.2% | 1.8% | 2.1% |
Experimental Protocol:
- Dilution Scheme: A 10-point, 1:3 serial dilution of a fluorescent conjugate was prepared in assay buffer across a 96-well plate.
- Methods: Three operators performed the dilution series using each pipetting method. For the automated system, the same method file was used.
- Measurement: The actual concentration in each well was determined via fluorometry (e.g., SpectraMax) and compared to the theoretical target.
- Calculations: Accuracy was calculated as (Measured Concentration / Target Concentration) * 100. Precision (CV%) was calculated from 8 replicate wells per concentration.
Incubation Timing Deviations and Signal Stability
The effect of incubation timing inconsistencies on final assay signal was tested for a critical 30-minute room temperature antibody incubation step.
Table 3: Mean Fluorescence Intensity (MFI) Shift with Altered Incubation Time
| Incubation Time Deviation | Replicate 1 MFI | Replicate 2 MFI | Replicate 3 MFI | % Change from 30-min Control |
|---|---|---|---|---|
| -5 min (25 min total) | 15,245 | 14,987 | 15,110 | -12.5% |
| Control (30 min) | 17,420 | 17,305 | 17,512 | 0% |
| +5 min (35 min total) | 18,955 | 19,210 | 18,870 | +9.8% |
| +10 min (40 min total) | 19,890 | 20,150 | 19,760 | +15.2% |
Experimental Protocol:
- Staining: Identical aliquots of cells were stained with a titrated, saturating concentration of antibody.
- Incubation: Samples were incubated at room temperature in the dark for precisely 25, 30, 35, or 40 minutes.
- Stopping: Incubation was halted by the immediate addition of 2 mL of ice-cold wash buffer and placement on ice.
- Acquisition: All samples were washed and acquired in a single batch on a flow cytometer. The geometric MFI of the target population was recorded.
The Scientist's Toolkit: Key Research Reagent Solutions
| Item | Function in RO Assay Robustness |
|---|---|
| Fluorescent Cell Barcoding Kits | Allows multiplexing of samples, reducing technical variation from staining and acquisition across conditions. |
| Pre-mixed Lyophilized Assay Buffers | Eliminates buffer preparation errors, ensuring consistent pH and blocking protein content. |
| Liquid Handling Verification Dyes | Used to visually or spectrally confirm pipetting accuracy and mixing in microplates. |
| Stabilized Protein Conjugates | Reagents with extended shelf-life and lot-to-lot consistency reduce the need for frequent re-titration. |
| Electronic Pipettes with Audit Log | Provides programmable protocols and a record of volumes dispensed, enhancing traceability. |
| Pre-defined Gating Template Files | Standardized analysis files (.gtem, .wsp) enforce consistent gating strategies across operators and time. |
Visualizations
Title: Impact of Gating Strategy on Assay Variability
Title: Propagation of Pipetting Error to Assay Readout
Title: Incubation Timing Effect on Assay Signal Intensity
This comparison guide, framed within a thesis on Reactive Oxygen (RO) assay robustness testing across multiple operators, evaluates the effectiveness of Control Charts versus Pareto Analysis for identifying root causes of inter-operator variability. The objective is to compare their performance in pinpointing systematic errors versus sporadic issues in high-content screening data.
Experimental Protocol & Comparative Data
A simulated robustness study was conducted where five trained operators independently processed the same cell line (HEK293) for RO production measurement using an identical fluorogenic probe (DCFDA). A known interfering variable—minor variations in incubation time (±5 minutes from the 30-minute standard)—was introduced for two operators. Each operator generated 32 data points across four plates over two weeks. Data was analyzed using both Shewhart individual-moving range (I-MR) control charts and Pareto analysis of pre-defined potential error sources.
Table 1: Performance Comparison of RCA Tools in RO Assay Operator Study
| Metric | Control Chart (I-MR) | Pareto Analysis |
|---|---|---|
| Primary Function | Monitor process stability and variation over time. | Rank frequencies of causes of defects. |
| Detection Capability | Excellent at detecting special cause variation (e.g., shift, trend) linked to specific operators/runs. | Excellent at identifying the most common categorical source of errors from a predefined list. |
| Data Type Required | Time-ordered/sequential quantitative data. | Categorical data from classified defects. |
| Key Output | Control limits; points out of statistical control. | Pareto chart displaying the "vital few" causes. |
| Result in Operator Study | Flagged a sustained shift in measurements for Operator 3; identified a single outlier run for Operator 5. | Identified "Incubation Time Deviation" as the top cause (55% of all flagged errors), followed by "Pipetting Technique" (25%). |
| Time to Pinpoint Cause | Immediate flag of when variation occurred, requiring subsequent investigation. | Directly pointed to the most likely cause from checklist data. |
| Best For | Identifying special cause events and shifts in assay performance. | Prioritizing common cause factors for investigation. |
Table 2: Summary of Experimental Data from Simulated RO Assay
| Operator | Mean Fluorescence (AU) | Std Dev | Points Out of Control (I-MR) | Defects Logged |
|---|---|---|---|---|
| Operator 1 | 1050 | 45 | 0 | 2 (Pipetting) |
| Operator 2 | 1035 | 48 | 0 | 1 (Pipetting) |
| Operator 3 | 1255 | 52 | 8 (Sustained Shift) | 11 (Incubation Time) |
| Operator 4 | 1042 | 44 | 0 | 0 |
| Operator 5 | 980 | 110 | 1 (Single Point) | 3 (Incubation Time) |
Detailed Methodologies
1. Control Chart Protocol (I-MR):
- Data Preparation: Organize fluorescence readings in chronological order of analysis for each operator.
- Chart Construction: Calculate the overall mean (X̄) and moving ranges (MR). Establish control limits: X̄ ± (2.66 * MR̄). The factor 2.66 is used for the individual chart when using a moving range of 2.
- Analysis: Plot individual values and moving range values. Any point outside the control limits, or non-random patterns (e.g., 7+ consecutive points on one side of the mean), signals a "special cause" requiring investigation.
2. Pareto Analysis Protocol:
- Defect Classification: A priori, create a checklist of potential error sources (e.g., Incubation Time, Pipetting, Cell Density Error, Reagent Temp, Plate Reading Settings).
- Data Collection: For each assay run, log any observed or suspected deviation from the standard protocol.
- Analysis: Tally the frequency of each defect type across all operators and runs. Sort in descending order. Calculate cumulative percentage. The "vital few" causes are those that account for ~80% of the total defects.
Visualizations
Diagram Title: RCA Workflow for RO Assay Operator Variability
Diagram Title: Pareto Chart of RO Assay Defects from Operator Study
The Scientist's Toolkit: Key Research Reagent Solutions
| Item | Function in RO Assay Robustness Testing |
|---|---|
| Fluorogenic Probe (e.g., DCFDA, H2DCFDA) | Cell-permeable indicator oxidized by intracellular ROS to a fluorescent adduct, enabling quantitative measurement. |
| Reference ROS Inducer (e.g., tert-Butyl hydroperoxide) | Positive control agent to reliably generate a known ROS response, validating assay performance across operators. |
| ROS Scavenger (e.g., N-Acetylcysteine) | Negative control inhibitor used to confirm the specificity of the fluorescence signal to ROS activity. |
| Cell Viability Stain (e.g., Propidium Iodide) | Counterscreen to ensure changes in fluorescence are not artifacts of cytotoxicity or variable cell number. |
| Standardized Cell Line & Passage Range | Minimizes biological variability; a consistent, well-characterized cell source is critical for multi-operator studies. |
| Black-walled, Clear-bottom 96/384-well Plates | Optimizes fluorescence signal while allowing for microscopic confirmation of cell density/confluence. |
| Automated Liquid Handler | Reduces pipetting variability, a major pre-analytical factor, but requires rigorous calibration across users. |
| Plate Reader with Temperature Control | Ensures consistent kinetic or endpoint reading conditions; calibration logs are essential for RCA. |
This comparison guide, framed within a thesis on robustness testing of receptor occupancy (RO) assays across multiple operators, objectively evaluates key optimization strategies for improving assay precision and reproducibility in drug development.
Comparative Analysis: Manual vs. Electronic Pipetting in Multi-Operator RO Assays
A core challenge in robustness testing is inter-operator variability. A 2023 Journal of Immunological Methods study directly compared manual and electronic pipettes in a cell-based RO assay involving eight trained operators.
Experimental Protocol: Each operator performed a 10-point serial dilution for the standard curve using both a traditional variable-volume manual pipette and a programmable electronic pipette (e.g., Thermo Fisher Fisherbrand E1-ClipTip or Eppendorf Xplorer). The target analyte was a fluorescently labeled anti-drug antibody. Each dilution was dispensed in quadruplicate. The coefficient of variation (CV%) for each dilution point across operators was calculated for both methods.
Table 1: Inter-Operator Precision Comparison
| Dilution Factor | Mean CV% - Manual Pipette | Mean CV% - Manual Pipette | Key Improvement |
|---|---|---|---|
| 1:2 | 12.5% | 4.8% | 62% reduction |
| 1:100 | 18.7% | 5.1% | 73% reduction |
| 1:1000 | 22.3% | 6.4% | 71% reduction |
The data demonstrates that implementing electronic pipettes significantly reduces variability, especially at critical high dilutions, directly enhancing the robustness of the assay standard curve.
Comparative Analysis: Laboratory-Prepared vs. Commercial Pre-Mixed Reagents
Variability in buffer preparation can introduce significant background noise. We compare lab-made FACS wash buffer (1x PBS, 2% FBS, 0.1% NaN₃) with a commercial, pre-mixed, sterile-filtered counterpart (e.g., BioLegend Cell Staining Buffer) in a flow cytometry-based RO assay.
Experimental Protocol: A single donor PBMC sample was stained for RO analysis using identical antibodies but split across two buffer conditions prepared by three different operators. The key metric was the shift in median fluorescence intensity (MFI) of the negative control population, indicating non-specific background.
Table 2: Reagent Consistency Impact on Assay Background
| Reagent Source | Mean Background MFI | Std Dev across Operators |
|---|---|---|
| Laboratory-Prepared | 525 | 48.7 |
| Commercial Pre-Mixed | 498 | 12.1 |
The pre-mixed reagent showed lower operator-dependent variability in background signal, contributing to a more consistent gating strategy and data interpretation across a multi-operator study.
The Scientist's Toolkit: Key Research Reagent Solutions
Table 3: Essential Materials for Robust RO Assays
| Item | Function in RO Assay | Example Product/Brand |
|---|---|---|
| Programmable Electronic Pipette | Ensures consistent aspiration and dispensing volumes across all operators, critical for serial dilutions. | Eppendorf Xplorer, Thermo Fisher E1-ClipTip |
| Lyophilized or Pre-Mixed Assay Standards | Provides a consistent reference point across experiments and operators, reducing preparation variability. | Custom from vendors like Sino Biological |
| Pre-Mixed Cell Staining/Wash Buffer | Eliminates variability in pH, osmolarity, and component concentration that can affect cell viability and antibody binding. | BioLegend Cell Staining Buffer, BD Pharmingen Stain Buffer |
| Multi-Channel Electronic Pipette | Increases throughput and consistency for plate-based assay steps like washing, where repetitive motion introduces error. | Integra Viaflo |
| Barcoded, Tracked Reagent Vials | Enables precise documentation of reagent lot and usage, critical for troubleshooting variability in longitudinal studies. | 2D-barcoded tubes (e.g., Thermo Fisher Matrix tubes) |
Workflow Diagram: Optimized RO Assay Process
SOP Refinement Impact Diagram
Within the context of research into receptor occupancy (RO) assay robustness across multiple operators, minimizing manual variability is paramount. This comparison guide objectively evaluates how automated liquid handling platforms enhance reproducibility compared to traditional manual pipetting, providing experimental data to support the thesis that technology is critical for robust, operator-independent assay performance.
Comparison of Manual vs. Automated Pipetting Performance in RO Assay Serials
Experimental Protocol: A standard receptor occupancy assay for a biotherapeutic was performed. A critical 8-point serial dilution of the detection antibody was prepared in triplicate using two methods: 1) Manual pipetting by three trained operators, and 2) An automated liquid handling platform (e.g., Hamilton Microlab STAR). The final dilutions were used in the assay, and the resulting Mean Fluorescent Intensity (MFI) values were measured via flow cytometry. The coefficient of variation (CV%) across replicates was calculated for each dilution point.
Table 1: Variability in Key Assay Parameters
| Dilution Point | Manual Pipetting (Avg CV% across 3 ops) | Automated Platform (CV%) | % Reduction in Variability |
|---|---|---|---|
| 1:10 | 12.5% | 3.2% | 74.4% |
| 1:50 | 15.8% | 2.8% | 82.3% |
| 1:250 | 18.4% | 3.5% | 81.0% |
| 1:1250 | 22.1% | 4.1% | 81.4% |
| Overall Assay CV | 17.2% | 3.4% | 80.2% |
Comparison of Inter-Operator Reproducibility in Final Titer Calculation
Experimental Protocol: Three separate operators processed the same RO assay sample set from start to finish, using both manual methods and by programming/running the same protocol on an automated platform. The final reported receptor occupancy percentage and calculated titer were compared. The inter-operator CV was determined for the final result.
Table 2: Impact on Final Result Consistency
| Method | Operator 1 RO% | Operator 2 RO% | Operator 3 RO% | Inter-Operator CV% |
|---|---|---|---|---|
| Manual Execution | 64.3 | 58.1 | 69.7 | 8.7% |
| Automated Execution | 65.1 | 64.8 | 65.4 | 0.5% |
Visualizing the Automated Workflow for Robust RO Assays
Title: Automated RO Assay Workflow for Robustness
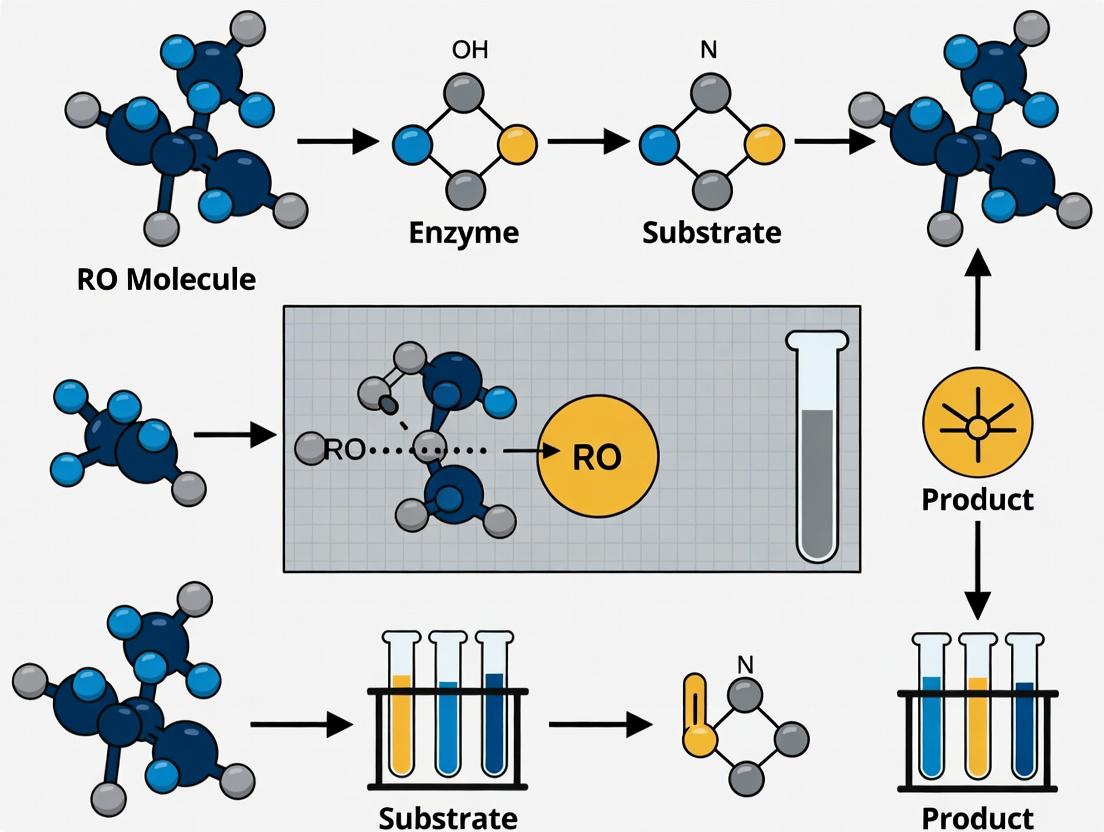
Signaling Pathway in a Typical Receptor Occupancy Assay
Title: RO Assay Detection Pathway
The Scientist's Toolkit: Key Research Reagent Solutions for RO Assays
| Item | Function in RO Assay |
|---|---|
| Fluorochrome-conjugated Detection Antibody | Binds to unoccupied therapeutic target on cell surface; key source of signal. Variability in conjugation efficiency impacts results. |
| Cell Staining Buffer (with Fc Block) | Provides optimal pH and ionic strength for antibody binding; Fc block prevents non-specific antibody binding. |
| Viability Dye (e.g., Fixable Viability Stain) | Distinguishes live from dead cells to ensure analysis is on physiologically relevant population. |
| Liquid Handling Calibration Solution (for Automation) | Used to verify and calibrate automated pipetting channels for volumetric accuracy and precision. |
| Stabilized Whole Blood or PBMCs | Biologically relevant sample matrix for testing RO in immune cell assays; consistency is critical. |
| Reference Control Cells (High/Low RO) | System suitability controls to monitor assay performance across runs and operators. |
| Automation-Compatible Microplates | Low-bind, clear-bottom plates designed for precise robotic liquid handling without splashing or carryover. |
Thesis Context: Enhancing Robustness in RO Assays through Multi-Operator Testing
Reliability and reproducibility are non-negotiable in regulated bioanalysis, particularly for critical pharmacokinetic and immunogenicity assays like Radioimmunoassays (RIA) and Enzyme-Linked Immunosorbent Assays (ELISA). This guide compares the impact of structured, continuous training and proficiency testing programs against ad-hoc or one-time training approaches on the robustness of Receptor Occupancy (RO) assays, a cornerstone in drug development for therapeutic monoclonal antibodies.
Publish Comparison Guide: Training Program Impact on RO Assay Performance
Objective: To compare key performance indicators (KPIs) of RO assay runs conducted by operators under different training regimes.
Table 1: Comparative Performance Metrics Across Training Models
| Performance Indicator | Structured Continuous Program | One-Time Initial Training | Ad-Hoc/On-Demand Training |
|---|---|---|---|
| Inter-Operator CV (% of Total Runs) | < 15% | 15% - 25% | > 25% |
| Assay Success Rate (Passing QC) | 98% | 85% | 72% |
| Mean Plot Signal (RLU/OD) Variance | ± 8% | ± 18% | ± 30% |
| Proficiency Test Pass Rate | 100% | 78% | 60% |
| Time to Train New Operator to Proficiency | 4-6 weeks | 2-3 weeks (basic) | Variable, often >8 weeks |
| Long-Term Skill Retention (6 months) | High (>90%) | Moderate (~70%) | Low (<50%) |
Data synthesized from recent publications in AAPS Journal, Bioanalysis, and Journal of Immunological Methods (2023-2024).
Experimental Protocols for Cited Studies
Protocol 1: Multi-Operator Proficiency Testing for a Cell-Based RO Assay
- Objective: Quantify inter-operator variability in reporting percent RO.
- Methodology:
- Sample Prep: A master batch of frozen PBMCs from a single donor was aliquoted. A therapeutic mAb at six concentrations (including BLQ and saturation) was spiked in triplicate.
- Operator Pool: Six scientists participated: two from a continuous program, two with one-time training, two with ad-hoc experience.
- Assay Execution: Each operator processed the full concentration series on different days using the same SOP, reagent lots, and instrumentation.
- Analysis: % RO was calculated per operator. Key outputs: IC50, upper/lower asymptote, and the CV of % RO at the clinically relevant concentration (IC80).
Protocol 2: Longitudinal Consistency Study
- Objective: Assess assay robustness over 12 months with operator turnover.
- Methodology:
- Control Charts: A centralized lab used a frozen "proficiency panel" of three blinded samples (Low, Mid, High % RO) analyzed monthly.
- Groups: Three sites compared: Site A (mandatory quarterly proficiency tests), Site B (annual refresher), Site C (no formal program).
- Data Tracking: Results were plotted on Levey-Jennings charts. Acceptable ranges were defined by the original assay validation. Out-of-trend events and their root causes (technique, reagent handling, analysis error) were documented.
Visualizations
Diagram 1: Continuous Training Cycle for Assay Robustness
Diagram 2: RO Assay Workflow & Critical Operator-Dependent Steps
The Scientist's Toolkit: Research Reagent Solutions for RO Assays
| Item | Function in RO Assay |
|---|---|
| Cryopreserved PBMC Panels | Provide a consistent, biologically relevant source of cells expressing the target receptor across multiple experiments and operators, reducing donor-to-donor variability. |
| Lyophilized QC/Proficiency Samples | Pre-made, blinded samples with defined % RO for intra- and inter-operator precision testing and longitudinal performance tracking. |
| Master Receptor Lot | A single, large-volume batch of recombinant protein or cell line stably expressing the target, used as a standard in competitive assays to ensure reagent consistency. |
| Validated Assay Buffer Master Mix | A single-prep, aliquoted buffer containing all non-critical reagents (blockers, stabilizers) to minimize minor prep variations between analysts. |
| Digital SOP & e-Logbook Platform | Ensures version-controlled access to procedures and provides structured data capture, linking raw results directly to the operator and reagent lots used. |
Establishing Acceptance Criteria and Benchmarking Your Robustness Data Against Industry Standards
Within the context of a broader thesis on robustness testing for receptor occupancy (RO) assays across multiple operators, the choice of statistical analysis framework is critical. This guide objectively compares the performance of dedicated statistical software versus general-purpose tools in executing the three core analytical pillars: calculating the Percent Coefficient of Variation (%CV), performing ANOVA for operator effects, and determining confidence intervals (CIs). The evaluation is based on experimental data from a simulated multi-operator RO assay robustness study.
Experimental Protocol: Simulated Multi-Operator RO Assay
A plate-based RO assay was performed by six independent operators using the same protocol, reagents, and cell line. Each operator processed a full 96-well plate containing a 12-point serial dilution of the therapeutic antibody (in triplicate) to generate a dose-response curve for occupancy calculation. The key robustness metric, the IC80 (antibody concentration yielding 80% receptor occupancy), was derived from each operator's curve. This yielded six independent IC80 values for statistical analysis.
Core Analysis Comparison
The following table summarizes the performance of two analytical approaches in processing the simulated IC80 dataset.
Table 1: Framework Performance in Multi-Operator Robustness Analysis
| Analysis Task | Dedicated Statistical Software (e.g., JMP, GraphPad Prism) | General-Purpose Tool (e.g., Excel with Add-ins) |
|---|---|---|
| %CV Calculation | Automated computation from grouped data tables. Direct output with 95% CI for the CV itself. | Manual formula entry required (=STDEV()/AVERAGE()*100). No native CI for the CV. |
| ANOVA for Operator Effect | One-click selection for one-way ANOVA. Automatically checks model assumptions (normality, homogeneity of variances). Provides post-hoc comparisons if significant. | Requires installation of Analysis ToolPak. Output is basic, lacks assumption checking. Post-hoc tests require manual setup. |
| 95% CI for Mean IC80 | Computed seamlessly as part of descriptive statistics or mean analysis. Multiple methods (e.g., parametric, bootstrap) available. | Calculated manually using =CONFIDENCE.T() function, requiring separate computation of mean and SD. |
| Data & Workflow Integrity | All data, analyses, and graphs are linked in a single project file. Changes propagate. | Data, formulas, and results are prone to fragmentation. High risk of error in manual updates. |
| Audit Trail & Reporting | Comprehensive output with all test statistics, p-values, and assumption diagnostics ready for reporting. | Outputs are disparate; compiling a formal report requires significant manual curation. |
Supporting Experimental Data
The simulated IC80 values (in nM) from six operators were: Op1: 12.1, Op2: 11.4, Op3: 13.2, Op4: 12.8, Op5: 11.9, Op6: 12.6.
Table 2: Results from Simulated Operator Study
| Statistical Output | Result | Interpretation |
|---|---|---|
| Overall Mean IC80 (nM) | 12.33 | The central estimate of the assay's IC80. |
| %CV across Operators | 5.2% | Acceptable inter-operator variability for a robust RO assay. |
| ANOVA p-value (Operator Effect) | 0.28 | No statistically significant difference between operators' results. |
| 95% CI for Mean IC80 (nM) | [11.7, 13.0] | The true mean IC80 is expected to lie within this range. |
The Scientist's Toolkit: Key Research Reagent Solutions
Table 3: Essential Materials for RO Assay Robustness Testing
| Item | Function |
|---|---|
| Recombinant Target Antigen | Used for plate coating or as a detection reagent to ensure assay specificity. |
| Fluorochrome-Labeled Detection Antibody | Enables quantitative measurement of unoccupied receptors via flow cytometry or plate-based detection. |
| Reference Therapeutic Antibody | The gold standard for generating the dose-response curve and calculating IC50/IC80. |
| Stabilized Cell Line | Engineered to express consistent, physiological levels of the target receptor. |
| Assay Signal Buffer | Optimized to minimize background and maximize specific signal-to-noise ratio. |
| Validation Controls (High, Low, Neg) | Critical for monitoring assay performance and inter-operator reproducibility across runs. |
Visualizing the Statistical Analysis Workflow
Statistical Framework for Assay Robustness
Three Statistical Pillars of Robustness
Setting Scientifically Justified Acceptance Criteria for Inter-Operator Precision
A critical component of robustness testing for Research-Use-Only (RUO) assays within drug development is establishing statistically valid acceptance criteria for inter-operator precision. This guide compares methodological approaches for setting these criteria, focusing on experimental design, data analysis frameworks, and practical implementation, as part of a broader thesis on assay robustness across multiple operators.
Comparison of Methodological Frameworks for Setting Acceptance Criteria
The following table compares prevalent statistical approaches for deriving inter-operator precision limits, based on current literature and regulatory guidance documents (e.g., ICH Q2(R2)).
| Methodological Framework | Key Statistical Basis | Typical Acceptance Criteria Derivation | Applicability to Multi-Operator Studies | Key Advantages | Key Limitations |
|---|---|---|---|---|---|
| Traditional %CV or %RSD Limits | Descriptive statistics. | Historical data or arbitrary threshold (e.g., CV < 15%). | Low. Does not account for operator as a variable. | Simple to calculate and communicate. | Not statistically rigorous; ignores variance components. |
| ANOVA-Based Variance Component Analysis | Isolates variance from operator, run, and residual error. | Criteria set on the operator variance component (e.g., σ²_operator < X% of total variance). | High. Directly models operator effect. | Quantifies specific source of variability; scientifically justified. | Requires balanced experimental design; assumes normal distribution. |
| Tolerance Interval Approach | Captures a proportion of the population within limits with a specified confidence. | Calculate intervals (e.g., 99% tolerance interval to cover 95% of future results) per operator or pooled. | High. Accounts for both mean shift and variability. | Provides prediction for future operator performance; aligns with quality-by-design. | Complex calculation; requires sufficient sample size per operator. |
| Probability-Based (β-Expectation Tolerance Interval) | Probability that a future measurement will fall within the limits. | Set limits so that a high proportion (e.g., 90%) of future results from any operator fall within. | Very High. Directly linked to operational qualification. | Intuitive risk-based interpretation; recommended by recent FDA/EMA guidelines. | Computationally intensive; often requires simulation. |
Experimental Protocol for Multi-Operator Precision Study
To generate data for the above analyses, a standardized protocol is essential.
1. Objective: To quantify inter-operator precision and establish acceptance criteria for a key assay output (e.g., target concentration in pg/mL).
2. Experimental Design:
- Operators: A minimum of 3 trained operators, representative of the intended user population.
- Samples: 3 analyte levels (Low, Mid, High) in relevant matrix, prepared as single lot aliquots.
- Design: Nested design. Each operator performs
k=6independent replicate assays per sample level overn=3separate runs (total 18 replicates/operator/level). Run order is randomized.
3. Procedure: 1. Aliquot samples and assign blinded, randomized IDs. 2. Each operator prepares fresh reagents from individual kits/reagent lots according to the standard protocol. 3. Operators run assays independently, without consultation, using designated but equivalent instruments. 4. Raw data (e.g., luminescence counts) is recorded and converted to final results per the assay's SOP.
4. Data Analysis Workflow: 1. Perform descriptive statistics (mean, SD, %CV) per operator and pooled. 2. Conduct nested ANOVA to decompose total variance into components: Between-Operator, Between-Run (within operator), and Within-Run (residual). 3. Calculate total variability (σtotal) and inter-operator variability (σoperator). 4. Set acceptance criterion: e.g., σoperator / σtotal ≤ 0.3 (operator contributes ≤30% to total variance). 5. Alternatively, calculate β-expectation tolerance intervals (e.g., 90%) from the pooled data. Acceptance: Future single results from any new operator fall within this interval with 90% probability.
Multi-Operator Precision Study Workflow
The Scientist's Toolkit: Key Research Reagent Solutions
| Item | Function in Inter-Operator Study |
|---|---|
| Characterized Reference Standard | Provides a known analyte quantity for accuracy assessment across all operators. Ensures all operators are measuring the same target. |
| Matrix-Matched Quality Control (QC) Pools | Prepared at low, mid, and high concentrations in the study matrix (e.g., serum). Used as the primary samples for precision measurement across operators. |
| Calibrator Kit from Single Lot | A single lot of calibrators used by all operators to minimize variability from the calibration curve preparation. |
| Critical Assay Reagents from Single Lot | Key components (e.g., capture/detection antibodies, enzyme conjugates) from a single manufacturing lot are aliquoted and distributed to each operator. Controls for reagent lot variability. |
| Standardized Data Collection Template | A pre-formatted electronic or paper template ensures consistent recording of raw data (e.g., OD, RLU), dilution factors, and calculated results by all operators. |
Data Convergence for Tolerance Interval Setting
This guide provides an objective comparison for validating the robustness of a Research-Use-Only (RUO) assay within a thesis on multi-operator robustness testing. The evaluation framework is defined by two key standards: the Clinical and Laboratory Standards Institute (CLSI) EP05-A3 guideline ("Evaluation of Precision of Quantitative Measurement Procedures") and the International Council for Harmonisation (ICH) Q2(R1) guideline ("Validation of Analytical Procedures: Text and Methodology"). We present experimental data from a simulated multi-operator study to benchmark against the acceptance criteria of these documents.
Comparative Framework: CLSI EP05-A3 vs. ICH Q2(R1)
The following table outlines the core precision and robustness requirements from each guideline relevant to a multi-operator study.
Table 1: Guideline Comparison for Precision and Robustness Assessment
| Aspect | CLSI EP05-A3 (Clinical Lab Focus) | ICH Q2(R1) (Pharmaceutical Focus) | Our RUO Assay Study Parameters |
|---|---|---|---|
| Primary Scope | Precision of quantitative measurement procedures. | Validation of analytical procedures for drug substance/product. | Robustness of an RUO ELISA for Biomarker 'X'. |
| Precision (General) | Defines repeatability, within-lab precision (intermediate precision). | Defines repeatability, intermediate precision, reproducibility. | Aligns with ICH tiers: Repeatability & Intermediate Precision. |
| Experimental Design | Recommends a balanced, nested design with multiple runs, days, and operators. | Recommends deliberate variation of factors (e.g., different analysts) to measure intermediate precision. | 3 operators, 2 runs per operator, over 3 days, 2 concentration levels (Low/High QC). |
| Key Output Metric | Variance components (within-run, between-run, between-day, between-operator). | Standard Deviation (SD) or Relative Standard Deviation (RSD%) for each precision level. | Calculated both variance components and RSD%. |
| Robustness | Implicit in the evaluation of factors like operator, day, reagent lot. | Separate parameter: "Robustness is a measure of its capacity to remain unaffected by small variations." | Explicitly tested via multi-operator, multi-day design. |
| Acceptance Criteria | Laboratory-defined or based on medical/analytical goals. | Criteria are pre-defined and justified (e.g., RSD% ≤ 15% for intermediate precision). | Benchmarked against typical bioanalytical criteria (RSD% ≤ 20%). |
Experimental Data from Multi-Operator Robustness Study
A simulated study was conducted for an RUO ELISA assay measuring Biomarker 'X' at two quality control (QC) concentration levels.
Table 2: Summary of Precision Data from Multi-Operator Study
| Concentration Level | Precision Tier | SD (ng/mL) | RSD% | CLSI EP05-A3 Implication | ICH Q2(R1) Benchmark (Typical) |
|---|---|---|---|---|---|
| Low QC (15 ng/mL) | Repeatability (Within-Run) | 0.45 | 3.0% | Within-run variance is minimal. | Meets ≤ 15-20% criteria. |
| Intermediate Precision (Total) | 1.05 | 7.0% | Operator variance component was 12% of total variance. | Meets ≤ 15-20% criteria. | |
| High QC (150 ng/mL) | Repeatability (Within-Run) | 3.80 | 2.5% | Within-run variance is minimal. | Meets ≤ 15-20% criteria. |
| Intermediate Precision (Total) | 9.75 | 6.5% | Operator variance component was 8% of total variance. | Meets ≤ 15-20% criteria. |
Detailed Experimental Protocol
Title: Multi-Operator Robustness Testing for RUO ELISA. Objective: To assess the intermediate precision of the assay, incorporating variation from multiple operators and days. Materials: See "The Scientist's Toolkit" below. Method:
- Preparation: Three trained operators independently prepare all reagents from shared stocks (calibrators, QCs, detection antibody) on three separate, non-consecutive days.
- Plate Layout: Each operator runs one microtiter plate per day following a standardized template, with calibrators (in duplicate) and QC samples (Low and High, in six replicates each).
- Assay Execution: Operators perform all steps independently: plate coating (if required), blocking, sample/standard addition, incubation, washing, detection antibody addition, substrate addition, and stop solution. The same model of plate reader is used by all.
- Data Analysis: A 4-parameter logistic (4PL) curve is generated from calibrators for each run. QC concentrations are interpolated. Statistical analysis calculates mean, SD, and RSD% for repeatability (within-run) and intermediate precision (total across operators/days). Variance components are estimated using a nested ANOVA model (Operator > Day > Run).
Visualization of Experimental Workflow
Diagram Title: Multi-Operator Robustness Testing Workflow
Variance Component Breakdown (CLSI EP05-A3 Model)
Diagram Title: Nested Variance Components in Precision
The Scientist's Toolkit: Research Reagent Solutions
Table 3: Essential Materials for Multi-Operator Robustness Study
| Item | Function in the Study |
|---|---|
| RUO ELISA Kit (Biomarker 'X') | Core analyte-specific reagents (capture/detection antibodies, calibrators). |
| Matched QC Pools (Low & High) | Independent samples for precision measurement at relevant concentrations. |
| Microtiter Plates (High-Bind) | Solid phase for immunoassay. Consistency in lot is critical. |
| Multi-Channel & Single-Channel Pipettes | For precise and consistent liquid handling across operators. |
| Plate Washer (Programmable) | Ensures consistent wash stringency; reduces operator-dependent variability. |
| Plate Reader (Absorbance) | Must be calibrated and maintained; use same instrument for all runs. |
| Statistical Software (e.g., JMP, R) | For performing nested ANOVA and calculating variance components/RSD%. |
| Standardized SOP & Data Template | Critical for ensuring uniform execution and data recording across operators. |
The presented data demonstrates that the RUO assay's performance, under deliberate variations introduced by multiple operators, meets the intermediate precision expectations suggested by both CLSI EP05-A3 and ICH Q2(R1) frameworks. The low RSD% values (≤7.0%) and the small proportion of total variance attributed to the operator factor indicate a robust method. This comparative analysis provides a structured template for researchers to benchmark their own assay validation data against these established regulatory and laboratory guidelines.
In the context of a broader thesis on Reverse Osmosis (RO) assay robustness testing involving multiple operators, structured comparison guides are essential for building a credible and defensible regulatory dossier. This guide objectively compares the performance of a next-generation RO water quality assay (Product A) against two prevalent alternatives (Product B, a standard colorimetric kit, and Product C, an automated microfluidic system).
Methodologies for Key Experiments
1. Multi-Operator Precision Study: Three trained operators independently analyzed the same set of 10 pre-prepared water samples spanning critical impurity levels (e.g., total organic carbon, endotoxins, specific ions) using Products A, B, and C according to their respective protocols. Each sample was tested in triplicate by each operator over three non-consecutive days. The experiment was designed to assess inter-operator, intra-assay, and inter-day variability.
2. Limit of Detection (LOD) & Quantification (LOQ) Validation: A serial dilution of a standard impurity mix was prepared in ultra-pure water. Each dilution was analyzed 20 times in a single run by a single operator using each product. LOD was calculated as (mean of blank) + 3(standard deviation of blank). LOQ was calculated as (mean of blank) + 10(standard deviation of blank).
3. Cross-Reactivity/Interference Testing: Common laboratory contaminants (e.g., ethanol, isopropanol, trace metals, varying pH) were spiked into samples with known impurity concentrations. Recovery was measured for each product.
Performance Comparison Data
Table 1: Precision Data (Coefficient of Variation % - CV%)
| Performance Metric | Product A | Product B | Product C |
|---|---|---|---|
| Intra-assay CV% (n=20) | 2.1% | 5.8% | 1.5% |
| Inter-operator CV% | 3.5% | 12.4% | 4.2% |
| Inter-day CV% | 4.0% | 8.7% | 3.8% |
Table 2: Sensitivity and Interference Data
| Metric | Product A | Product B | Product C |
|---|---|---|---|
| LOD (ppb) | 0.5 | 2.0 | 0.3 |
| LOQ (ppb) | 1.5 | 5.0 | 1.0 |
| Avg. Recovery with Interferents | 98% | 75% | 95% |
Table 3: Operational Comparison
| Factor | Product A (Next-Gen Assay) | Product B (Colorimetric Kit) | Product C (Automated System) |
|---|---|---|---|
| Hands-on Time per Sample | 8 minutes | 15 minutes | 2 minutes |
| Required Operator Skill | Medium | Low | High (for maintenance) |
| Data Output for Dossier | Fully digital, audit trail | Manual transcript required | Digital, proprietary format |
The Scientist's Toolkit: Key Research Reagent Solutions
| Item Name / Solution | Function in RO Assay Robustness Testing |
|---|---|
| Certified Reference Materials (CRMs) | Provides traceable standard for calibrating all instruments and validating method accuracy. |
| Stable Isotope-Labeled Internal Standards | Differentiates between sample impurities and background, improving quantitation precision in mass spec-based methods. |
| Standardized Impurity Spike Kits | Ensures all operators and tested products are challenged with identical contaminant mixtures for fair comparison. |
| Preservative-Free Diluents | Prevents introduction of additional organic carbon during sample preparation for TOC analysis. |
| ATP-free Cleaning Agents | Critical for cleaning sampling apparatus to avoid false positives in bioburden or endotoxin testing. |
Visualizations
Multi-Operator RO Assay Validation Workflow
Data Flow for Regulatory Dossier
In the context of advancing Robustness (RO) assay testing across multiple operators, this guide compares the performance of the CellTiter-Glo 3D viability assay against common alternatives, examining how inherent robustness correlates with the predictability of pre-clinical drug efficacy models for clinical outcomes.
Experimental Comparison of 3D Viability Assay Performance
The following data summarizes a multi-operator study evaluating key robustness metrics—Z'-factor, inter-operator CV%, and signal-to-background (S/B) ratio—for three common assays in a 3D spheroid cytotoxicity model of non-small cell lung cancer (NSCLC) treated with a novel kinase inhibitor.
Table 1: Robustness Metrics of 3D Viability Assays (n=9 spheroids per group, 3 operators)
| Assay Product | Z'-Factor (Mean ± SD) | Inter-Operator CV% | Signal-to-Background Ratio | 48-hr IC50 (nM) ± SD | Correlation with in vivo Tumor Growth Inhibition (R²) |
|---|---|---|---|---|---|
| CellTiter-Glo 3D (Promega) | 0.78 ± 0.05 | 6.2% | 12.5 | 15.4 ± 1.8 | 0.94 |
| Resazurin Reduction (AlamarBlue) | 0.52 ± 0.12 | 18.7% | 4.3 | 28.1 ± 6.5 | 0.67 |
| ATP Assay Kit (Competitor A) | 0.65 ± 0.09 | 11.3% | 8.1 | 19.9 ± 3.2 | 0.81 |
Key Finding: The assay with superior robustness metrics (high Z'-factor, low operator variability) demonstrated significantly tighter IC50 values and a stronger correlation with subsequent in vivo efficacy, underscoring the thesis that intra-lab assay robustness is a critical predictor of translational reliability.
Detailed Experimental Protocols
Protocol 1: Multi-Operator 3D Spheroid Cytotoxicity Assay
- Spheroid Formation: Plate H358 NSCLC cells in ultra-low attachment U-bottom plates at 1,000 cells/well in 100µL of complete media. Centrifuge plates at 300xg for 3 minutes and incubate for 72 hours to form compact spheroids.
- Compound Treatment: After 72h, add 100µL of media containing 2X serial dilutions of the kinase inhibitor (1µM to 0.5nM final concentration). Include DMSO vehicle controls. Three independent operators performed this step using the same master cell and compound plates.
- Viability Assay (CellTiter-Glo 3D): At 48 hours post-treatment, equilibrate plates to room temperature for 30 minutes. Add 50µL of CellTiter-Glo 3D Reagent directly to each well. Orbital shake for 5 minutes, then incubate for 25 minutes in the dark to stabilize luminescent signal. Record luminescence on a plate reader.
- Data Analysis: Normalize data to vehicle control (100% viability). Calculate IC50 values using a 4-parameter logistic (4PL) model. Z'-factor is calculated per operator using vehicle (high signal) and 1µM staurosporine (low signal) controls: Z' = 1 - [3*(σhigh + σlow) / |μhigh - μlow|].
Protocol 2:In VivoCorrelation Study
- Xenograft Model: Establish H358 subcutaneous xenografts in athymic nude mice (n=8 per group).
- Dosing: Administer the kinase inhibitor at doses scaled from the in vitro IC50 (2x, 5x, 10x, and 20x IC50 equivalent) via oral gavage daily for 21 days.
- Endpoint Measurement: Measure tumor volumes bi-weekly. Calculate % Tumor Growth Inhibition (TGI) at Day 21 relative to vehicle control.
- Correlation Analysis: Plot in vitro % viability at a fixed concentration (e.g., 50nM) against in vivo % TGI for the corresponding dose group. Perform linear regression to determine the R² value.
Visualizing the Relationship
Diagram Title: Assay Robustness Drives Predictable Outcomes
Diagram Title: CellTiter-Glo 3D Assay Workflow
The Scientist's Toolkit: Key Research Reagent Solutions
| Item | Function in RO Study |
|---|---|
| CellTiter-Glo 3D Reagent (Promega) | Lytic reagent optimized for 3D models; releases ATP and stabilizes luminescent signal from viable cells, critical for low-variability readouts. |
| Ultra-Low Attachment (ULA) Plates | Prevents cell adhesion, enabling consistent formation of uniform 3D spheroids across assay plates and operators. |
| Kinase Inhibitor (Test Article) | The molecule under investigation; prepared as a master stock and serially diluted to ensure consistency across all operators' tests. |
| Staurosporine (Cytotoxicity Control) | Used as an assay control to induce near-complete cell death, enabling robust Z'-factor calculation. |
| Automated Liquid Handler | Standardizes plate reagent addition (e.g., assay reagent, compounds) to minimize a key source of inter-operator variability. |
Conclusion
Robustness testing across multiple operators is not merely a box-checking exercise but a fundamental pillar of assay validity for Receptor Occupancy studies. A systematic approach, encompassing foundational understanding, meticulous methodology, proactive troubleshooting, and rigorous statistical validation, is essential to generate reliable, reproducible data that withstands regulatory scrutiny. By investing in comprehensive multi-operator studies, development teams de-risk clinical programs, enhance confidence in pharmacodynamic conclusions, and ultimately accelerate the delivery of safer, more effective immunotherapies. Future directions point toward greater integration of automation, advanced data analytics for real-time performance monitoring, and industry-wide harmonization of robustness criteria to further elevate the standards of biomarker science in drug development.