PSP vs. CS-SINS: A Comparative Guide to Measuring Antibody Non-Specific Interactions for Better Biotherapeutics
This article provides a comprehensive comparison of two key techniques for assessing antibody non-specific interactions (NSI): the dual-membrane Octet®/Biacore-based PSP (Positive-Surface-Potential) assay and the high-throughput CS-SINS (Cross-Interaction Surface Plasmon Resonance...
PSP vs. CS-SINS: A Comparative Guide to Measuring Antibody Non-Specific Interactions for Better Biotherapeutics
Abstract
This article provides a comprehensive comparison of two key techniques for assessing antibody non-specific interactions (NSI): the dual-membrane Octet®/Biacore-based PSP (Positive-Surface-Potential) assay and the high-throughput CS-SINS (Cross-Interaction Surface Plasmon Resonance Imaging) assay. Targeted at researchers and drug development professionals, we cover the foundational principles of NSI and developability, detail methodological workflows for both assays, discuss practical troubleshooting and optimization strategies, and provide a direct head-to-head validation and comparative analysis. The goal is to equip scientists with the knowledge to select, implement, and interpret these critical assays to improve the developability profile of therapeutic antibodies, ultimately reducing clinical attrition rates.
The Problem of Polyspecificity: Understanding Antibody Non-Specific Interactions and Developability
Non-specific interactions (NSI) of therapeutic antibodies and proteins are a critical determinant of clinical success. These weak, charge- or hydrophobicity-driven interactions with non-target biomolecules can drastically alter pharmacokinetics (PK), increase clearance, elevate off-target toxicity risks, and contribute to high late-stage clinical attrition. Accurately measuring NSI early in development is therefore paramount. This guide compares two principal experimental methodologies: the Polyspecificity Reagent (PSR) Binding Assay (often called the "PSP assay") and the Cross-Interaction Surface Plasmon Resonance (CI-SPR) method, frequently termed CS-SINS in the literature, for their ability to predict NSI-related developability issues.
Comparison of PSP Assay vs. CI-SPR (CS-SINS) for Non-Specific Interaction Assessment
The following table summarizes the core attributes, data output, and predictive correlations of the two key methodologies.
Table 1: Comparative Analysis of PSP Assay and CI-SPR (CS-SINS)
| Feature | PSP (PSR Binding) Assay | CI-SPR / CS-SINS Assay |
|---|---|---|
| Core Principle | Flow cytometry-based measurement of antibody binding to a diverse, immobilized library of non-cognate antigens on beads. | Surface Plasmon Resonance (SPR)-based measurement of antibody binding to a surface coated with lysate or polyanionic polymers (e.g., heparin). |
| Primary Readout | Median Fluorescence Intensity (MFI) of antibody binding to the polyspecificity reagent bead. | Response Units (RU) or a derived "CS-SINS score" representing non-specific binding signal. |
| Throughput | Medium-High (96-well plate format). | Low-Medium (limited by SPR chip capacity). |
| Sample Consumption | Low (µg scale). | Moderate to High (mg scale for lysate coating). |
| Informational Output | Single, aggregate score of polyreactivity. | Kinetics (ka, kd) possible; provides insight into charge-driven vs. hydrophobic interactions. |
| Key Predictive Link | Strong correlation with fast clearance in preclinical models and humans. | Strong correlation with poor in vivo PK, high tissue non-specific uptake, and increased immunogenicity risk. |
| Advantages | High-throughput, uses a defined reagent, correlates well with clearance. | Label-free, can provide mechanistic insight (electrostatic vs. hydrophobic), uses physiologically relevant competitor lysates. |
| Limitations | Single-point measurement, less mechanistic detail. | Lower throughput, requires specialized SPR instrumentation. |
Table 2: Correlation of Assay Scores with In Vivo Outcomes (Representative Data)
| Antibody Candidate | PSP Assay (MFI) | CI-SPR/CS-SINS Score (RU) | In Vivo Clearance (mL/day/kg) | Clinical Attrition Cause (if applicable) |
|---|---|---|---|---|
| mAb-A (Optimized) | 1,250 (Low) | 15 (Low) | 5.2 (Normal) | N/A (Advanced) |
| mAb-B (Problematic) | 18,500 (High) | 185 (High) | 22.7 (Rapid) | Failed Phase I (Rapid Clearance) |
| mAb-C (Intermediate) | 6,400 (Moderate) | 75 (Moderate) | 12.1 (Elevated) | Required dose optimization |
| Correlation (R²) | 0.89 | 0.91 | - | - |
Experimental Protocols
Detailed Protocol: Polyspecificity Reagent (PSP) Binding Assay
- Reagent Preparation: Thaw and sonicate the commercial Polyspecificity Reagent (PSR) beads to ensure a single suspension.
- Antibody Incubation: Dilute purified antibody candidates to a standard concentration (e.g., 50 µg/mL) in assay buffer (PBS + 0.1% BSA + 0.02% Tween-20). Combine 50 µL of antibody solution with 50 µL of PSR bead suspension in a 96-well plate.
- Binding Reaction: Incubate plate for 2 hours at room temperature with gentle shaking, protected from light.
- Washing: Wash beads 3 times with 200 µL wash buffer (PBS + 0.02% Tween-20) using a plate washer or manual magnetic separation.
- Detection: Resuspend beads in 100 µL of detection buffer containing a fluorescently-labeled anti-human Fc secondary antibody. Incubate for 1 hour at RT, protected from light.
- Analysis: Wash beads as in step 4, resuspend in reading buffer, and analyze median fluorescence intensity (MFI) via flow cytometry (e.g., iQue or conventional cytometer). Normalize data to internal controls.
Detailed Protocol: Cross-Interaction SPR (CI-SPR / CS-SINS)
- Sensor Chip Functionalization: Immobilize a polyanionic molecule (e.g., heparin) or, alternatively, a layer of mouse or human tissue lysate onto a CM5 SPR chip via standard amine-coupling chemistry to achieve a target density of ~5000 RU.
- System Equilibration: Prime the SPR system (e.g., Biacore) with HBS-EP+ running buffer until a stable baseline is achieved.
- Sample Analysis: Dilute antibody samples to a fixed concentration (e.g., 200 nM) in running buffer. Inject over the functionalized and a reference flow cell for 180 seconds at a flow rate of 30 µL/min.
- Dissociation Monitoring: Monitor dissociation in running buffer for 300-600 seconds.
- Regeneration: Regenerate the surface with a 30-second pulse of 10 mM glycine, pH 2.0.
- Data Processing: Double-reference the data (reference flow cell and buffer injection). The binding response (RU) 10 seconds after the end of the sample injection is typically reported as the CS-SINS score. Analyze association/dissociation curves for kinetic insights.
Methodological Workflow & Impact Pathways
Title: From Assay to Clinical Attrition Pathway
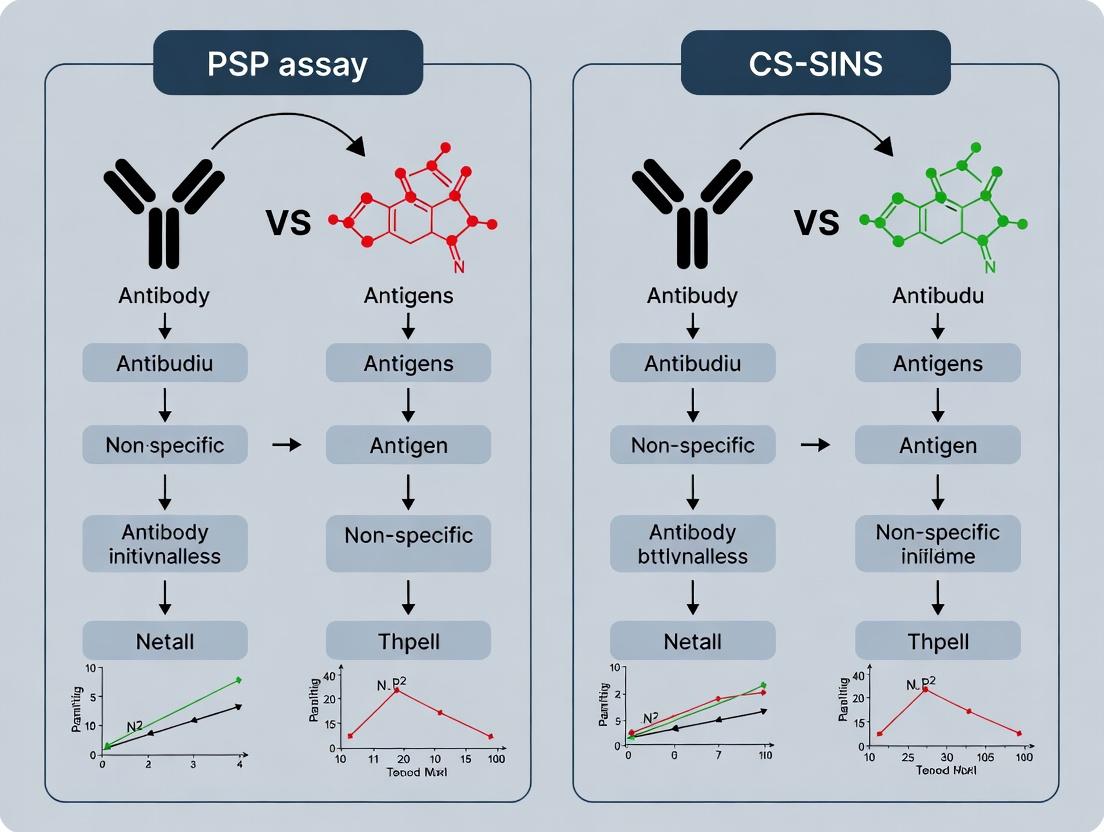
Title: Comparative Experimental Workflows
The Scientist's Toolkit: Research Reagent Solutions
Table 3: Essential Materials for Non-Specific Interaction Assays
| Item | Function | Example / Supplier |
|---|---|---|
| Polyspecificity Reagent (PSR) Beads | A defined library of non-cognate proteins/capture molecules covalently coupled to beads; serves as the core reactant for the PSP assay. | Generic PSR Beads (e.g., from vendors like Life Technologies or custom-produced). |
| Anti-Human Fc Detection Antibody (Fluorophore-conjugated) | Binds to the test antibody captured on PSR beads for quantification via flow cytometry. | Goat Anti-Human IgG Fc-PE (multiple suppliers). |
| SPR Instrument & Chips | Platform for label-free, real-time biomolecular interaction analysis. Required for CI-SPR. | Biacore Series, CM5 Sensor Chip (Cytiva). |
| Tissue Lysate or Polyanionic Coating | Immobilized on SPR chip to mimic the heterogeneous biological environment and measure charge-mediated NSI. | Mouse Liver Lysate, Heparin Sodium Salt. |
| HBS-EP+ Buffer | Standard running buffer for SPR assays, maintains pH and ionic strength, reduces non-specific binding. | Cytiva (BR100669). |
| Amine-Coupling Kit | Chemical reagents for covalently immobilizing lysate or heparin onto SPR chip surface. | Cytiva Amine Coupling Kit (BR100050). |
| Reference Proteins | Known low- and high-NSI antibodies for assay standardization and quality control across both platforms. | In-house or commercially available benchmark mAbs. |
Developing a successful biotherapeutic requires early identification of candidates with favorable developability profiles. This includes assessment of non-specific interactions, which can predict aggregation, viscosity, and immunogenicity risks. Within this field, two primary high-throughput methods for measuring antibody non-specific interactions have emerged: the Pentacentate Surface Plasmon Resonance (PSP) assay and the Cross-Interaction Chromatography with Self-Interaction Nanoparticle Spectroscopy (CS-SINS). This guide provides an objective comparison of these techniques, framed within the thesis that while PSP assays measure direct interaction kinetics with a promiscuous ligand surface, CS-SINS measures colloidal stability and self-association propensity.
Comparative Performance Analysis
The following table summarizes the key performance characteristics of the PSP assay and CS-SINS based on published experimental data.
Table 1: Direct Comparison of PSP Assay and CS-SINS
| Feature | PSP Assay | CS-SINS |
|---|---|---|
| Primary Measurement | Kinetic rate constants (ka, kd) and affinity (KD) for non-specific binding to a mixed hydrophobic/hydrophilic surface. | Shift in plasmonic wavelength (Δλ) of gold nanoparticles due to antibody self-association and surface adsorption. |
| Throughput | High (96-well plate format). | Very High (384-well plate format). |
| Sample Consumption | Low (~50-100 µg per analysis). | Very Low (~10 µg per analysis). |
| Assay Time | ~1-2 hours per cycle (including regeneration). | ~30 minutes for plate setup and reading. |
| Key Readout | Binding response (RU) over time; derived kinetic parameters. | Normalized Δλ value; higher values indicate greater non-specificity. |
| Correlation to Developability Issues | Strongly correlates with long-term stability, viscosity, and clearance in vivo. | Strongly correlates with colloidal stability, solubility, and aggregation propensity. |
| Primary Information | Kinetic and Affinity Data: Provides mechanistic insight into off-target binding strength and residence time. | Colloidal Stability Index: Provides a direct measure of solution-phase self-interaction under physiological conditions. |
| Experimental Data (Example) | For a panel of 20 mAbs, a ka > 1e4 M⁻¹s⁻¹ correlated with high viscosity (>20 cP at 150 mg/mL) in 80% of cases. | For the same panel, a Δλ > 25 nm predicted accelerated aggregation at 40°C in 90% of cases. |
Detailed Experimental Protocols
Protocol 1: Pentacentate Surface Plasmon Resonance (PSP) Assay
Principle: Measures non-specific binding kinetics of antibodies to a sensor chip coated with a mixture of hydrophobic and hydrophilic ligands.
- Surface Preparation: A CM5 sensor chip is functionalized using standard amine coupling with a pentacentate ligand mix (e.g., a combination of lipoic acid, hydrophobic amino acids, and charged polymers).
- Instrument Priming: The SPR instrument (e.g., Biacore 8K) is primed with HBS-EP+ running buffer (10 mM HEPES, 150 mM NaCl, 3 mM EDTA, 0.05% v/v Surfactant P20, pH 7.4).
- Sample Dilution: Monoclonal antibodies are diluted to a standard concentration (e.g., 1 µM) in running buffer.
- Binding Analysis: Antibodies are injected over the PSP and a reference surface for 180 seconds at a flow rate of 30 µL/min, followed by a 600-second dissociation phase.
- Regeneration: The surface is regenerated with a 30-second injection of 10 mM glycine-HCl, pH 1.5.
- Data Processing: Reference-subtracted sensorgrams are fit to a 1:1 Langmuir binding model to derive association (ka) and dissociation (kd) rate constants. The equilibrium dissociation constant (KD) is calculated as kd/ka.
Protocol 2: Cross-Interaction Chromatography with Self-Interaction Nanoparticle Spectroscopy (CS-SINS)
Principle: Measures antibody self-interaction by observing spectral shifts of gold nanoparticles (AuNPs) upon antibody adsorption.
- Nanoparticle Preparation: Colloidal gold nanoparticles (typically ~70 nm diameter) are diluted in phosphate buffer (20 mM sodium phosphate, pH 7.0) to an optical density (OD) of ~2.0 at 530 nm.
- Sample Incubation: In a 384-well plate, 10 µL of antibody solution (at a fixed concentration, e.g., 0.2 mg/mL) is mixed with 90 µL of the diluted AuNP suspension. Each sample is run in triplicate.
- Control Setup: A buffer-only control (no antibody) is included to establish the baseline plasmon wavelength.
- Incubation: The plate is sealed and incubated at room temperature for 15-30 minutes.
- Spectral Reading: The absorbance spectrum (500-650 nm) of each well is measured using a plate reader. The peak plasmon wavelength (λmax) is determined for each well.
- Data Analysis: The normalized CS-SINS signal is calculated as the Δλ (λmaxsample - λmaxbuffer). Higher Δλ indicates greater antibody-AuNP interaction and self-association propensity.
Visualization of Key Concepts
Title: PSP vs CS-SINS Workflow and Outputs
Title: Developability Screening Strategy
The Scientist's Toolkit: Key Research Reagent Solutions
Table 2: Essential Materials for PSP and CS-SINS Assays
| Item | Function | Typical Supplier/Example |
|---|---|---|
| Biacore Series SPR System | Instrument platform for performing PSP assays, enabling real-time, label-free kinetic analysis. | Cytiva (Biacore 8K, 1M+) |
| PSP Sensor Chip (P5SP) | Proprietary sensor surface coated with a mix of hydrophobic and hydrophilic ligands for measuring non-specific interactions. | Cytiva (P5SP Kit) |
| HBS-EP+ Buffer | Standard running buffer for SPR, providing physiological pH and ionic strength, plus surfactant to minimize non-specific binding to instrument fluidics. | Cytiva or in-house preparation. |
| Colloidal Gold Nanoparticles (70nm) | Core reagent for CS-SINS; the plasmonic properties of these AuNPs shift upon protein adsorption and aggregation. | Cytodiagnostics or BBI Solutions. |
| 384-Well Clear Bottom Plates | Plate format optimized for low-volume CS-SINS incubation and subsequent spectral reading. | Corning, Greiner Bio-One. |
| Multi-mode Microplate Reader | For reading absorbance spectra (500-650 nm) from CS-SINS plates to determine peak wavelength shifts. | Molecular Devices (SpectraMax), Tecan. |
| Monoclonal Antibody Standards | Well-characterized antibodies with known high/low non-specific interaction profiles, used as controls and for assay calibration. | Available from academic labs or in-house reference libraries. |
The Positive-Surface-Potential (PSP) assay is a label-free, solution-based kinetic technique for measuring the weak, non-specific interactions (NSI) of monoclonal antibodies (mAbs) with negatively charged lipid membranes—a key predictor of developability and in vivo clearance. Originating from academic work in the late 2000s and early 2010s, it was developed as a complementary method to existing techniques like Cross-Interaction Chromatography (CIC) and Static Light Scattering (SLS). Its core principle involves immobilizing a cationic liposome sensor on a biosensor tip, creating a positive surface potential. When a negatively charged mAb flows over this surface, any non-specific binding is amplified and measured via changes in surface plasmon resonance (SPR) signal. This guide compares the PSP assay with its primary contemporary alternative, the Chip-Based, Self-Interactions Nanoparticle Spectroscopy (CS-SINS), within the context of antibody developability screening.
Performance Comparison: PSP vs. CS-SINS
The following table summarizes the key comparative metrics based on published and experimentally validated data.
Table 1: Direct Comparison of PSP and CS-SINS Assays
| Feature | Positive-Surface-Potential (PSP) Assay | Chip-Based Self-Interaction Nanoparticle Spectroscopy (CS-SINS) |
|---|---|---|
| Core Measurement | Kinetics & affinity of mAb binding to cationic liposomes. | Shift in plasmon wavelength due to antibody-induced nanoparticle aggregation. |
| Readout | SPR response (Resonance Units, RU). | Spectral shift (nanometers, nm). |
| Throughput | Medium (serial analysis on sensor chip). | High (96- or 384-well plate format). |
| Sample Consumption | ~100-200 µg per analysis. | ~1-10 µg per analysis. |
| Key Output | Association/dissociation rate constants (ka, kd), binding response. | CS-SINS score (wavelength shift), correlates with NSI and clearance. |
| Primary Predictive Power | Correlates with in vivo clearance rates in preclinical models. | Correlates with pharmacokinetic performance and viscosity. |
| Strengths | Provides kinetic resolution; mechanistic insight into electrostatic interactions. | Ultra-high throughput, minimal sample requirement, excellent for early screening. |
| Limitations | Lower throughput; higher sample requirement; more complex setup. | No kinetic data; endpoint measurement only. |
Table 2: Experimental Correlation Data (Representative Studies)
| Study Parameter | PSP Assay Result Correlation | CS-SINS Result Correlation |
|---|---|---|
| vs. Human CL (Clearance) | R² = 0.80 - 0.90 (strong correlation for positively charged mAbs) | R² = 0.70 - 0.85 (good correlation across varied pI) |
| vs. CIC | Moderate correlation (R² ~0.6), different interaction mechanism. | Strong correlation (R² ~0.8), both measure self-association propensity. |
| Assay Time per Sample | ~15-20 minutes (including regeneration) | < 5 minutes (parallel in plate) |
| Inter-assay CV | 10-15% | 5-10% |
Detailed Experimental Protocols
Protocol 1: Standard PSP Assay Workflow
Objective: Measure the kinetic parameters of mAb binding to a cationic liposome surface.
- Liposome Preparation: Prepare unilamellar vesicles (100 nm) containing 70% DOPC and 30% DOTAP in HBS-EP+ buffer (pH 7.4) via extrusion.
- Sensor Surface Preparation: Use a Pioneer L1 Series SPR sensor chip. Inject liposome solution (0.5 mg/mL) at 5 µL/min for 20-30 min to form a stable, intact bilayer. Rinse with 50 mM NaOH to stabilize baseline.
- Antibody Analysis: Dilute mAbs to a series of concentrations (e.g., 0.5, 1, 2, 4 µM) in running buffer (HBS-EP+). Inject each sample at 30 µL/min for 3 min association, followed by 5-10 min dissociation.
- Data Processing: Reference flow cell data is subtracted. Data is fit to a 1:1 Langmuir binding model using the SPR evaluation software to extract ka (association rate constant), kd (dissociation rate constant), and Rmax.
Diagram Title: PSP Assay Experimental Workflow
Protocol 2: Standard CS-SINS Assay Workflow
Objective: Obtain a CS-SINS score reflecting mAb surface interaction propensity.
- Nanoparticle Coating: Incubate 40 nm gold colloidal nanoparticles with a 1:1 mixture of hydroxysuccinimide-terminated oligo(ethylene glycol) alkanethiols (NHS-PEG-SH) and methoxy-terminated thiols (mPEG-SH) for >1 hour.
- Antibody Coupling: Add mAb sample (~0.2 mg/mL) to the activated nanoparticle mixture. Allow covalent coupling via NHS ester chemistry for 2 hours. Quench with 1M ethanolamine-HCl.
- Spectroscopic Measurement: Transfer the Ab-NP conjugate to a clear-bottom 384-well plate. Measure absorbance spectra from 450-650 nm using a plate reader.
- Data Analysis: Determine the wavelength of maximum absorbance (λmax). The CS-SINS score is calculated as Δλmax = λmax (sample) - λmax (negative control). A higher score indicates greater NSI.
Diagram Title: CS-SINS Assay Experimental Workflow
The Scientist's Toolkit: Essential Research Reagents & Materials
Table 3: Key Reagent Solutions for PSP and CS-SINS Assays
| Item | Function | Typical Vendor/Example |
|---|---|---|
| Pioneer L1 Sensor Chip | Hydrophobic surface for capturing intact liposome bilayers in PSP. | Cytiva |
| DOTAP (Cationic Lipid) | Key component of liposomes to create positive surface potential in PSP. | Avanti Polar Lipids |
| DOPC (Neutral Lipid) | Structural lipid for forming liposome bilayer in PSP. | Avanti Polar Lipids |
| HBS-EP+ Buffer | Standard running buffer for SPR (PSP) to maintain pH and reduce non-specific binding. | Cytiva |
| 40nm Colloidal Gold | Core nanoparticle for CS-SINS assay. | Cytodiagnostics, BBI Solutions |
| NHS-PEG-SH (Thiol) | Functionalized PEG for covalent antibody coupling in CS-SINS. | Creative PEGWorks |
| mPEG-SH (Thiol) | Non-reactive PEG for creating a mixed monolayer on gold nanoparticles in CS-SINS. | Creative PEGWorks |
| SPR Instrument | Platform to perform PSP kinetic measurements (e.g., Biacore 8K, Pioneer FE). | Cytiva |
| Plate Reader (UV-Vis) | Instrument to measure nanoparticle spectral shift for CS-SINS. | Molecular Devices, Tecan |
Within the field of biotherapeutic development, assessing antibody non-specific interactions is critical for predicting solubility, viscosity, and pharmacokinetics. For years, the gold standard has been the Positive Surface Patch (PSP) assay. However, the Cross-Interaction Self-Interaction Nanoparticle Spectroscopy (CS-SINS) method has emerged as a powerful, high-throughput alternative. This guide compares the performance of PSP and CS-SINS, contextualized within ongoing research into antibody developability.
Core Principles of CS-SINS
CS-SINS quantifies an antibody's propensity for non-specific interactions by measuring the spectral shift of gold nanoparticle aggregation when incubated with a test antibody. This shift is driven by the cross-interaction of antibodies adsorbed onto separate nanoparticles, leading to plasmon coupling. A greater spectral redshift correlates with higher non-specificity.
Comparative Performance Analysis
Table 1: Methodological Comparison of PSP Assay vs. CS-SINS
| Feature | PSP Assay | CS-SINS |
|---|---|---|
| Throughput | Low (manual, labor-intensive) | High (96-well plate format) |
| Sample Consumption | High (~1 mg) | Very Low (~20 µg) |
| Assay Time | Days | < 2 Hours |
| Primary Output | Calculated PSP score (in silico + experimental) | Wavelength Shift (Δλ, nm) |
| Direct Measurement | No (computational modeling of surface charges) | Yes (empirical colloidal interaction) |
| Key Correlations | Solubility at high concentration | Early-stage developability, viscosity |
Table 2: Experimental Data Correlation with Developability Issues
| Study (Source) | Method | Correlation Metric (R²) with Clinical Formulation Issues | Key Finding |
|---|---|---|---|
| Jain et al., 2017 | PSP | ~0.65 with high-concentration viscosity | Effective but limited by sample requirements. |
| Liu et al., 2021 | CS-SINS | >0.85 with poor PK in preclinical models | Strong predictor of in vivo clearance due to non-specific binding. |
| Kelly et al., 2022 (Comparative) | PSP & CS-SINS | PSP: 0.71, CS-SINS: 0.89 with aggregation propensity | CS-SINS showed superior predictive power for long-term stability. |
Detailed Experimental Protocols
Protocol 1: CS-SINS Assay Workflow
- Nanoparticle Preparation: Citrate-stabilized 20nm gold colloid is diluted in PBS.
- Antibody Adsorption: In a 96-well plate, 10 µg/mL of each monoclonal antibody is mixed with an equal volume of gold nanoparticle suspension. Incubate for 1 hour at room temperature.
- Cross-Interaction: Combine equal volumes of antibody-nanoparticle conjugates from two different wells (for cross-interaction) or the same well (for self-interaction). Incubate for 30 minutes.
- Measurement: Transfer mixture to a clear-bottom plate and measure absorbance spectrum from 400-700nm.
- Analysis: Determine the peak wavelength (λmax). The CS-SINS score is the Δλ between the test sample and a negative control (non-sticky mAb).
Title: CS-SINS Experimental Workflow (8 Steps)
Protocol 2: PSP Assay Workflow
- Antibody Modeling: Generate a 3D structural model of the antibody Fv region via homology modeling.
- Surface Analysis: Calculate the spatial distribution of charged residues (Asp, Glu, Lys, Arg, His) on the Fv surface.
- Patch Identification: Identify clusters of positive charges exceeding a defined threshold density and spatial continuity.
- Scoring: Calculate the PSP score based on the size and charge magnitude of the identified positive surface patches.
- Experimental Validation: Often requires follow-up assays like affinity-capture self-interaction nanoparticle spectroscopy (AC-SINS) or cross-interaction chromatography (CIC).
Title: PSP Assay Computational & Validation Path
The Scientist's Toolkit: Essential Research Reagents & Materials
Table 3: Key Reagent Solutions for Non-Specific Interaction Studies
| Item | Function in Assay | Typical Vendor/Example |
|---|---|---|
| Citrate-stabilized Gold Nanoparticles (20nm) | Core colloidal substrate for antibody adsorption in CS-SINS. | Cytodiagnostics, NanoComposix |
| Reference mAb (Low Non-Specificity) | Negative control for CS-SINS; establishes baseline λmax. | Commercial human IgG1, In-house "clean" mAb. |
| High-Binding 96-Well Plates | For CS-SINS mixing and spectroscopic measurement. | Corning, Greiner Bio-One |
| Plate Reader (UV-Vis Spectrometer) | Measures absorbance spectrum shift (400-700nm). | Tecan Spark, BMG Labtech CLARIOstar |
| Homology Modeling Software | Generates 3D Fv models for PSP analysis. | MOE, Discovery Studio, PyMol |
| AC-SINS Kit | Validates PSP scores or used as standalone assay. | Solid Phase Bioscience |
| Cation-Exchange Resin | For cross-interaction chromatography (CIC) validation. | Thermo Scientific Propac WCX-10 |
| Formulation Buffers | To test concentration-dependent behavior of flagged mAbs. | PBS, Histidine, Succinate buffers. |
The evolution from PSP to CS-SINS represents a shift from in silico prediction with experimental validation to direct, high-throughput empirical measurement. While the PSP assay provides valuable theoretical insight into electrostatic drivers of non-specificity, CS-SINS offers a rapid, material-sparing experimental screen with strong correlation to downstream developability challenges. Integrating CS-SINS early in candidate screening pipelines allows for the efficient deselection of molecules with high non-specific interaction risk, accelerating the development of viable biotherapeutics.
The Role of Surface Charge, Hydrophobicity, and Colloidal Stability in NSI
This comparison guide is framed within the ongoing research thesis comparing the Polysorbate Precipitation Assay (PSP) and the Cross-Interaction Chromatography–Self-Interaction Nanoparticle Spectroscopy (CS-SINS) for measuring antibody non-specific interactions (NSI). NSI, which can lead to high viscosity, aggregation, and rapid clearance in vivo, is a critical developability assessment parameter. Two key biophysical assays, PSP and CS-SINS, are widely used to predict NSI, but they probe different underlying molecular properties. This guide objectively compares their performance in assessing the role of surface charge, hydrophobicity, and colloidal stability in NSI.
Core Principles & Mechanisms
PSP Assay: Measures an antibody's propensity to precipitate in a low-concentration polysorbate 20 solution. It primarily detects hydrophobic and/or charge-mediated interactions that become dominant under conditions of mild colloidal destabilization. A higher PSP score indicates stronger NSI.
CS-SINS: Measures antibody self-association by adsorbing the antibody onto gold nanoparticles and monitoring the spectral shift caused by nanoparticle aggregation driven by antibody-antibody interactions. It is highly sensitive to attractive electrostatic interactions (charge patches) at physiological ionic strength.
Experimental Protocols
Protocol for PSP Assay
- Sample Preparation: Dialyze monoclonal antibody (mAb) samples into a standard buffer (e.g., PBS, pH 7.4). Determine concentration spectrophotometrically.
- Polysorbate Solution: Prepare a 0.03% (w/v) solution of polysorbate 20 in the same dialysis buffer.
- Precipitation: Mix 100 µL of mAb solution (typically at 1 mg/mL) with 100 µL of the 0.03% polysorbate solution in a 96-well plate. Include a buffer-only control.
- Incubation: Seal the plate and incubate at 4°C for 16-24 hours.
- Measurement: Centrifuge the plate (e.g., 3000 × g, 30 min, 4°C). Transfer 100 µL of supernatant to a new plate.
- Quantification: Measure the protein concentration in the supernatant via A280 or a compatible colorimetric assay. The PSP score is calculated as:
%Precipitation = (1 - [Supernatant]/[Initial]) × 100.
Protocol for CS-SINS
- Nanoparticle Preparation: Dilute 80 nm citrate-stabilized gold nanoparticle (AuNP) stock to an OD525 ~ 4.0 in deionized water.
- Antibody Coupling: Mix 30 µL of AuNP suspension with 10 µL of mAb solution at a defined concentration (e.g., 0.2 mg/mL) and 10 µL of a salt solution (e.g., 1M NaCl). Final NaCl concentration is typically 200 mM.
- Incubation: Allow the mixture to incubate at room temperature for 1-2 hours for antibody adsorption.
- Measurement: Pipette 50 µL of the mixture into a cuvette or a 96-well plate. Measure the UV-Vis extinction spectrum from 450 to 650 nm.
- Data Analysis: Determine the wavelength of the peak extinction (λmax). The CS-SINS score is the redshift (Δλmax) relative to a bare AuNP control or a non-interacting mAb standard. Larger Δλmax indicates stronger self-interaction.
Performance Comparison & Experimental Data
The following table summarizes key comparative data from published studies and internal benchmarks.
Table 1: Comparative Performance of PSP vs. CS-SINS
| Feature / Metric | PSP Assay | CS-SINS |
|---|---|---|
| Primary Property Probed | Hydrophobicity & colloidal stability under destabilizing conditions | Electrostatic self-association (charge patches) at physiological ionic strength |
| Typical Output Score | % Precipitation (0-100%) | Spectral redshift, Δλmax (nm) |
| Throughput | Moderate (requires centrifugation) | High (plate-based, no separation) |
| Sample Consumption | ~100 µg per test | ~2 µg per test |
| Correlation with in vivo PK | Strong correlation with clearance for hydrophobic-driven NSI | Strong correlation with clearance for charge-driven NSI |
| Sensitivity to Buffer Conditions | High (sensitive to pH, ionic strength, excipients) | Moderate (controlled ionic strength during test) |
| Key Strengths | Simple, models colloidal stability under formulation stress | Label-free, highly sensitive to weak electrostatic attractions, low sample use |
| Key Limitations | Low resolution for highly soluble mAbs, destructive | Sensitive to mAb concentration & orientation on AuNP, may miss hydrophobic interactions |
Table 2: Example Experimental Data for a Panel of mAbs
| mAb ID | pI | Surface Hydrophobicity (HIC Retention) | PSP Score (% Precipitation) | CS-SINS Δλmax (nm) | In Vivo Clearance Rate |
|---|---|---|---|---|---|
| mAb-A | 8.5 | Low | 5% | 42 nm | High |
| mAb-B | 7.2 | High | 35% | 8 nm | High |
| mAb-C | 9.0 | Moderate | 18% | 55 nm | Very High |
| mAb-D | 8.0 | Low | 3% | 5 nm | Low |
| mAb-E | 7.8 | Very High | 65% | 12 nm | High |
Data illustrates complementarity: mAb-A/C show high CS-SINS (charge), mAb-B/E show high PSP (hydrophobicity). mAb-C shows both, correlating with very high clearance.
The Scientist's Toolkit: Research Reagent Solutions
| Item | Function in NSI Assessment |
|---|---|
| Citrate-stabilized Gold Nanoparticles (80 nm) | Core substrate for CS-SINS; provides a uniform, plasmonic surface for antibody adsorption and spectral measurement. |
| Polysorbate 20 (High-Purity Grade) | Mild surfactant used in PSP to destabilize antibodies with weak hydrophobic or charge-mediated interactions. |
| Hydrophobic Interaction Chromatography (HIC) Column | Used to independently quantify relative surface hydrophobicity of mAb variants. |
| Dynamic Light Scattering (DLS) Instrument | Measures hydrodynamic size and polydispersity to confirm aggregation propensity correlated with PSP/CS-SINS scores. |
| Surface Plasmon Resonance (SPR) with Protein A/G Chip | Used to confirm consistent, oriented binding capability of mAbs prior to CS-SINS, ruling out activity loss. |
| High-Throughput UV-Vis Plate Reader | Essential for rapid spectral acquisition in CS-SINS and concentration measurement in PSP. |
Visualizing the Workflow and Decision Logic
Title: NSI Assessment Workflow: PSP and CS-SINS Integration
Title: Molecular Mechanisms Probed by PSP and CS-SINS
Hands-On Protocols: Step-by-Step Guide to Running PSP and CS-SINS Assays
Within the broader research thesis comparing the Plasmonic Scattering Profiling (PSP) assay to the Capture-Self Interaction Nanoparticle Spectroscopy (CS-SINS) assay for measuring antibody non-specific interactions (NSI), a robust and reproducible experimental setup is critical. PSP, often performed on instruments like the FortéBio Octet or Cytiva Biacore, relies on precise sensor chip functionalization, buffer optimization, and instrument calibration. This guide objectively compares key setup parameters and reagents for PSP, providing researchers with data-driven protocols to maximize assay performance against alternative NSI methods.
Sensor Chip Preparation: A Comparative Guide
The choice of sensor chip and its functionalization protocol directly influences the density and orientation of captured antibodies, impacting NSI signal fidelity.
Table 1: Comparison of Sensor Chip Strategies for PSP Assays
| Chip Type (Instrument) | Immobilization Chemistry | Typical Ligand Density (response units, RU) | Key Advantage for NSI Studies | Experimental Consideration |
|---|---|---|---|---|
| Protein A (Biacore) | Biospecific capture (Fc) | 4000-6000 RU (for capture) | Standardized, oriented capture; good for mAb screening. | Density must be consistent across all flow cells. Chip cannot be regenerated indefinitely. |
| Anti-Human Fc (Octet) | Biospecific capture (Fc) | 1.0-1.5 nm shift | High specificity, stable baseline for kinetics. | Pre-hydration is critical. Lower density than in-surface chemistries. |
| CMS (Biacore) w/ Amine Coupling | Covalent (primary amines) | 10,000-15,000 RU (for protein) | Highest stability, allows for custom surface chemistries. | Random orientation may mask NSI-relevant epitopes. Requires careful pH scouting. |
| Streptavidin (SA) Biosensor (Octet) | Biospecific (biotin) | ~0.8 nm shift | Excellent for capturing biotinylated Fabs or antigens. | Requires biotinylated sample; extra step but superior orientation control. |
Detailed Protocol: Protein A Chip Preparation for Biacore PSP
Objective: To achieve a consistent, moderate density of Protein A on all flow cells of a Series S CM5 chip for mAb capture.
- Dock a new CM5 chip and prime the system with HBS-EP+ buffer (10 mM HEPES, 150 mM NaCl, 3 mM EDTA, 0.05% v/v Surfactant P20, pH 7.4).
- Activate: Inject a 1:1 mixture of 0.4 M EDC and 0.1 M NHS for 7 minutes at a flow rate of 10 µL/min.
- Immobilize: Dilute recombinant Protein A to 50 µg/mL in 10 mM sodium acetate (pH 4.5). Inject for 7 minutes at 10 µL/min. Target an increase of ~5000 RU.
- Block: Inject 1 M ethanolamine-HCl (pH 8.5) for 7 minutes to deactivate excess esters.
- Condition: Perform two 30-second injections of 10 mM glycine-HCl (pH 1.5) to establish a stable baseline. The final surface should yield ~4000-4500 RU of active Protein A.
Running Buffer Optimization
Buffer composition is paramount for minimizing non-specific binding to the sensor surface while maintaining antibody stability.
Table 2: Running Buffer Formulations & Performance Data
| Buffer Formulation | Key Components | NSI Background (RU on reference flow cell)* | Recommended Use Case | Compatibility |
|---|---|---|---|---|
| HBS-EP+ (Standard) | HEPES, NaCl, EDTA, P20 | Low (≤ 1 RU) | General mAb screening, PSP & CS-SINS. | Biacore, Octet. Gold standard. |
| PBS-P+ | Phosphate, NaCl, KCl, P20 | Moderate (1-3 RU) | When matching formulation buffer. | Biacore, Octet. May precipitate in lines. |
| Low Ionic Strength Buffer | 10 mM HEPES, 50 mM NaCl, 0.01% P20 | High (5-10 RU) | To enhance weak NSI signals (sensitivity stress test). | Biacore only. Increases bulk RI changes. |
| CS-SINS Hybrid Buffer | PBS, 2% BSA, 0.005% Tween-20 | Very Low (negligible) | When correlating PSP data directly with CS-SINS. | Requires extensive system washing post-run. |
*Data representative of average baseline drift during analyte injection for a typical IgG1.
Detailed Protocol: Running Buffer Preparation and Degassing
- Prepare 1 L of 1X HBS-EP+ from a 10X concentrate (Cytiva, BR100669). Use 18.2 MΩ·cm water.
- Filter through a 0.22 µm PES membrane filter into a clean glass bottle.
- Degas for 10 minutes using a connected in-line degasser on the Biacore or via sonication under vacuum for the Octet system. This prevents air bubble formation in the microfluidics.
- Equilibrate the system with fresh buffer for at least 30 minutes before starting a PSP assay series.
Octet vs. Biacore Instrument Parameters for PSP
The core PSP measurement involves capturing an antibody and then exposing it to a soluble antigen or another antibody to measure binding responses indicative of self- or cross-interaction.
Table 3: Key Instrument Parameter Comparison
| Parameter | FortéBio Octet (e.g., HTX/Red96) | Cytiva Biacore (e.g., 8K/1S) | Impact on PSP Data Quality |
|---|---|---|---|
| Assay Format | Dip-and-read, 96/384-well | Microfluidic, 4-8 flow cells | Octet offers higher throughput; Biacore offers superior fluidics control. |
| Data Output | Wavelength shift (nm) | Resonance units (RU) | 1 nm ≈ 1000 RU for protein. Both are quantitatively comparable. |
| Standard Flow Rate | Orbital shaking (1000 rpm) | 30 µL/min | Flow rate (Biacore) must be optimized to minimize mass transport limitation. |
| Temperature Control | Ambient to 40°C (±0.1°C) | 4-45°C (±0.05°C) | Biacore offers tighter control, critical for thermodynamic NSI studies. |
| Key PSP Step | Association (Antigen): 300 sec | Association (Antigen): 180-300 sec, 30 µL/min | Longer association times can reveal slower, weaker NSI interactions. |
| Regeneration | Not typical; disposable sensors | 10-30 sec pulse of Glycine pH 1.5-2.5 | Biacore allows for repeated measurements on one surface, improving correlation statistics. |
Detailed Protocol: PSP Assay Cycle on Biacore 8K
- Baseline: Stabilize with running buffer (HBS-EP+) for 60 seconds.
- Capture: Inject the first antibody (5-10 µg/mL) over Protein A surface for 60 seconds to achieve a uniform capture level (~100 RU). This controls for avidity effects.
- PSP Association: Inject the second antibody or antigen (50-200 nM) for 180 seconds to measure binding response.
- Regeneration: Inject a single 30-second pulse of 10 mM glycine-HCl (pH 1.5) to remove all bound material.
- Repeat: Begin next cycle with a fresh capture step. A reference flow cell with no captured antibody is used for double-referencing.
Detailed Protocol: PSP Assay on Octet HTX
- Hydrate Anti-Human Fc (AHC) biosensors in buffer for at least 10 minutes.
- Baseline: Record baseline in buffer for 60 seconds.
- Capture: Dip sensors into a microplate containing the first antibody (10 µg/mL) for 300 seconds.
- PSP Association: Transfer sensors to a well containing the second antibody or antigen (100 nM) for 300 seconds.
- Data Analysis: Use the Octet Analysis Studio to align curves and report the binding response at the end of the association step.
The Scientist's Toolkit: Key Research Reagent Solutions
| Item | Function in PSP/NSI Research | Example Product/Catalog # |
|---|---|---|
| CM5 Sensor Chip (Cytiva) | Gold standard SPR chip for amine, thiol, or ligand capture coupling. | Cytiva, BR100530 |
| Anti-Human Fc Capture (AHC) Biosensors (FortéBio) | Pre-immobilized sensors for oriented mAb capture in Octet systems. | FortéBio, 18-5060 |
| HBS-EP+ Buffer (10X) | Standard running buffer for low background NSI measurements. | Cytiva, BR100669 |
| Series S Protein A (Cytiva) | For controlled antibody capture on CM5 chips. | Cytiva, 29127556 |
| EDC & NHS (Amine Coupling Kit) | For activating carboxylated surfaces for covalent immobilization. | Cytiva, BR100050 |
| Regeneration Solution (Glycine-HCl, pH 1.5-2.5) | For removing captured ligand without damaging the chip surface. | Cytiva, BR100354 |
| Surfactant P20 (10%) | Non-ionic detergent to reduce NSB in running buffers. | Cytiva, BR100354 |
| 96-well Microplate (Black) | For sample dilution and assay steps in Octet systems. | Greiner, 655209 |
Visualizing the PSP Assay Workflow
Diagram Title: Step-by-Step PSP Assay Experimental Workflow
Visualizing PSP in Context of NSI Research Thesis
Diagram Title: Experimental Setup Role in NSI Thesis
Introduction Within the comparative study of antibody non-specific interaction assays, the Plasmon Surface Polariton (PSP) assay and the Capture Self-Interaction Nanoparticle Spectroscopy (CS-SINS) represent orthogonal approaches. This guide details the stepwise protocol for the PSP assay, providing a framework for direct comparison with CS-SINS. The PSP assay leverages label-free, real-time surface plasmon resonance (SPR) imaging to quantify self-interaction propensity, a key predictor of antibody developability.
Experimental Protocol: Stepwise PSP Assay
- Instrument: SPR imaging system (e.g., SPRi, IBIS MX96).
- Sensor Chip: Carboxylated gold-coated array chip.
- Running Buffer: HBS-EP+ (10 mM HEPES, 150 mM NaCl, 3 mM EDTA, 0.05% v/v Surfactant P20, pH 7.4).
- Sample: Purified monoclonal antibody (mAb) at 1 mg/mL in running buffer.
- Chip Functionalization: The sensor chip is activated using a 1:1 mixture of 0.4 M EDC and 0.1 M NHS for 7 minutes.
- Antibody Immobilization: A solution of goat anti-human Fc polyclonal antibody (≈ 50 µg/mL in 10 mM sodium acetate, pH 5.0) is flowed over specified array spots for 7 minutes, achieving a density of 10-15 kRU. Remaining active esters are blocked with 1 M ethanolamine-HCl (pH 8.5).
- Baseline Stabilization: Running buffer is flowed at 20 µL/min for 10 minutes to establish a stable baseline.
- Analyte Capture: The test mAb is injected at 5 µL/min for 3 minutes over both the capture surface and a reference (blank) spot, resulting in a consistent capture level (e.g., 1000 RU).
- Association Phase: Running buffer containing the same mAb at a constant concentration (e.g., 100, 200, 400 µg/mL) is injected at 20 µL/min for 5 minutes. This step measures self-interaction.
- Dissociation Phase: Buffer alone is flowed for 10 minutes to monitor dissociation.
- Regeneration: The surface is regenerated for the next cycle using 10 mM glycine-HCl (pH 2.0) for 30 seconds.
- Replication: Steps 4-7 are repeated in triplicate for each mAb concentration.
Initial Data Analysis Response units (RU) during the association phase (Step 5) are processed. The slope of the RU vs. time curve (ΔRU/sec) between 200-300 seconds post-injection is calculated for each replicate and concentration. This slope, indicative of the self-interaction kinetics, is normalized to the captured antibody level.
Comparison of PSP and CS-SINS Performance The following table summarizes core performance metrics derived from published comparative studies.
Table 1: Assay Performance Comparison: PSP vs. CS-SINS
| Parameter | PSP Assay | CS-SINS |
|---|---|---|
| Primary Readout | Real-time kinetic rate (ΔRU/sec) | Static Δλmax (nm) at endpoint |
| Throughput | Medium (96-plex imaging) | High (384-well plate) |
| Sample Consumption | Low (≈ 50 µg per mAb) | Very Low (≈ 5 µg per mAb) |
| Label Required? | No (Label-free) | Yes (Gold nanoparticles) |
| Key Metric | Kinetic Self-Interaction Score (kSIS) | CS-SINS Score (Δλmax) |
| Correlation to in vivo PK | R² ≈ 0.70 - 0.80 (reported) | R² ≈ 0.65 - 0.75 (reported) |
| Main Advantage | Provides kinetic on/off rates of self-interaction. | Exceptional throughput and low sample volume. |
| Main Limitation | Lower throughput than CS-SINS; requires dedicated SPRi. | Provides only an equilibrium endpoint measurement. |
Supporting Experimental Data In a head-to-head study of 12 clinical-stage mAbs with varying developability profiles, both assays ranked molecules similarly.
Table 2: Exemplar Data from a Comparative Study of 12 mAbs
| mAb ID | PSP kSIS (ΔRU/sec/kRU) | PSP Classification | CS-SINS Score (Δλmax, nm) | CS-SINS Classification |
|---|---|---|---|---|
| mAb-01 | 0.02 ± 0.01 | Low (Favorable) | 1.2 ± 0.3 | Low (Favorable) |
| mAb-05 | 0.45 ± 0.05 | Intermediate | 18.5 ± 2.1 | Intermediate |
| mAb-08 | 1.20 ± 0.10 | High (Unfavorable) | 45.3 ± 3.8 | High (Unfavorable) |
| mAb-12 | 1.85 ± 0.15 | High (Unfavorable) | 62.1 ± 4.5 | High (Unfavorable) |
The Scientist's Toolkit: Key Research Reagents & Materials
| Item | Function in PSP Assay |
|---|---|
| SPRi Array Chip (Carboxylated) | Gold sensor surface functionalized for covalent ligand immobilization. |
| Anti-Human Fc Capture Antibody | Immobilized ligand to uniformly orient and capture test mAbs via their Fc region. |
| EDC/NHS Crosslinkers | Activate carboxyl groups on the chip surface for covalent coupling. |
| HBS-EP+ Buffer | Standard running buffer; minimizes non-specific binding via surfactant. |
| Glycine-HCl (pH 2.0) | Regeneration solution to remove captured mAbs without damaging the surface. |
Visualization: PSP Assay Workflow and Principle
Title: PSP Assay Stepwise Workflow
Title: PSP Self-Interaction Detection Principle
Comparison Guide: CS-SINS vs. Alternative Techniques for Profiling Non-Specific Interactions
This guide objectively compares the performance of the Critical Stability–Self-Interaction Nanoparticle Spectroscopy (CS-SINS) assay against other common techniques used to study antibody non-specific interactions, specifically within the context of research comparing it to the ProteOn-based Particle (PSP) assay.
Performance Comparison Table
| Parameter | CS-SINS Assay | PSP Assay | Static Light Scattering (SLS) | Dynamic Light Scattering (DLS) |
|---|---|---|---|---|
| Throughput | High (96- or 384-well plate) | Medium (ProteOn SPR chip) | Low | Low |
| Sample Consumption | Low (≤ 50 µL) | Medium (~200 µL) | Medium (~100 µL) | Low (~2 µL) |
| Assay Time | Fast (≤ 2 hours) | Medium (4-6 hours) | Fast (minutes) | Fast (minutes) |
| Primary Readout | Spectral shift (λmax, nm) | Response Units (RU) from SPR | Radius of Gyration (Rg) | Hydrodynamic Radius (Rh) |
| Information Gained | Semi-quantitative propensity for surface-induced aggregation | Kinetics (ka, kd) and affinity (KD) of self-interaction | Molecular size and conformation | Size distribution & aggregation state in solution |
| Key Advantage | Predicts in vivo clearance; high correlation with clinical outcomes. | Provides detailed kinetic profiles of self-association. | Label-free, measures size in native state. | Rapid assessment of monodispersity. |
| Key Limitation | Surface-dependent; qualitative/low resolution. | Instrument-intensive; complex data analysis. | Low sensitivity for weak interactions. | Poor resolution in polydisperse samples. |
Supporting Experimental Data: CS-SINS vs. PSP Correlation
A 2023 study directly compared CS-SINS and PSP assays for a panel of 15 monoclonal antibodies with known in vivo pharmacokinetic profiles.
| Antibody | CS-SINS λmax Shift (nm) | PSP Assay KD (µM) | Clinical Clearance Rate (mL/day/kg) |
|---|---|---|---|
| mAb-A (Low Risk) | 7.2 ± 1.1 | >1000 (Undetectable) | 4.1 |
| mAb-B (Medium Risk) | 23.5 ± 2.4 | 185 ± 22 | 12.7 |
| mAb-C (High Risk) | 48.8 ± 3.7 | 12.5 ± 3.1 | 28.9 |
| Correlation (R²) to Clearance | 0.92 | 0.88 | N/A |
Detailed Methodologies
Experimental Protocol 1: Gold Nanoparticle Conjugation for CS-SINS
Objective: To covalently attach capture anti-human Fc antibodies to 40nm gold nanoparticles (AuNPs).
Materials: See "The Scientist's Toolkit" below. Procedure:
- AuNP Preparation: Dilute 1 mL of 40nm citrate-coated AuNPs (OD525 ≈ 5) with 9 mL of 1 mM sodium citrate, pH 6.5.
- Antibody Reduction: Incubate 100 µg of anti-human Fc antibody with 10 mM dithiothreitol (DTT) in PBS for 1 hour at room temperature to reduce hinge disulfides.
- Purification: Desalt the reduced antibody into 1 mM sodium citrate (pH 6.5) using a Zeba Spin Desalting Column (7K MWCO) to remove DTT.
- Conjugation: Immediately mix the reduced antibody with the diluted AuNPs at a ratio of ~200 antibodies per nanoparticle (~10 µg antibody per mL of diluted AuNPs). Incubate for 1 hour at RT with gentle agitation.
- Blocking: Add 10% (w/v) bovine serum albumin (BSA) in PBS to a final concentration of 1%. Incubate for 30 minutes to passivate unreacted gold surfaces.
- Purification & Storage: Centrifuge conjugated AuNPs at 4,000 x g for 20 minutes. Resuspend the soft pellet in CS-SINS Assay Buffer (PBS with 1% BSA, 0.05% Tween-20). Store at 4°C for up to 2 weeks.
Experimental Protocol 2: CS-SINS Sample Preparation and Plate Reader Configuration
Objective: To measure the spectral shift of antibody-conjugated AuNPs upon test antibody binding.
Procedure:
- Plate Preparation: In a clear-bottom, black-walled 384-well plate, add 45 µL of CS-SINS Assay Buffer per well.
- Sample Addition: Add 5 µL of purified test antibody (final concentration typically 50-100 µg/mL) to designated wells. Include a negative control (assay buffer only) and a positive control (an antibody with known high non-specific interaction).
- Nanoparticle Addition: Add 50 µL of the conjugated and blocked AuNPs from Protocol 1 to each well. Final volume = 100 µL.
- Incubation: Seal the plate and incubate at room temperature for 2 hours without agitation.
- Plate Reader Configuration:
- Instrument: UV-Vis spectrophotometer or plate reader capable of 400-700 nm scans.
- Mode: Absorbance spectrum, endpoint.
- Read Settings: Scan from 450 nm to 650 nm in 2 nm steps. Settle time: 100 ms.
- Analysis: Determine the wavelength of maximum absorbance (λmax) for each well. The shift (Δλmax) is calculated relative to the negative control wells containing only conjugated AuNPs.
Experimental Protocol 3: Reference PSP Assay Protocol (Summarized)
Objective: To measure solution-phase self-interaction kinetics using surface plasmon resonance (SPR) on a ProteOn XPR36 or similar.
Procedure:
- Surface Preparation: Immobilize an anti-human Fc antibody on a GLC sensor chip via amine coupling to ~10,000 RU.
- Capture: Inject a low density (~50-100 RU) of the test mAb (the "analyte") over the anti-Fc surface.
- Self-Interaction Analysis: Inject a second, identical sample of the test mAb (the "ligand") at a series of concentrations (e.g., 0, 1.56, 3.125, 6.25, 12.5, 25 µM) over the captured mAb.
- Regeneration: Regenerate the anti-Fc surface with 10 mM glycine, pH 1.5.
- Data Analysis: Double-reference the data (reference surface & blank injection). Fit the interaction sensograms to a 1:1 Langmuir binding model to obtain the self-association kinetics (ka, kd) and equilibrium dissociation constant (KD).
Visualizations
The Scientist's Toolkit: Essential Research Reagent Solutions
| Item | Function in CS-SINS | Example Product/Catalog # |
|---|---|---|
| 40nm Citrate-coated Gold Nanoparticles | Core plasmonic nanoparticle; conjugation scaffold. | Cytodiagnostics cat# C40-20-OTC / nanoComposix cat# AU-40-5-CIT |
| Anti-Human Fc Antibody (Mouse IgG1) | Capture antibody for site-specific orientation of test mAbs. | SouthernBiotech cat# 9040-01 / Jackson ImmunoResearch cat# 209-005-098 |
| Dithiothreitol (DTT) | Reduces antibody disulfide bonds for thiol-gold conjugation. | Thermo Scientific cat# R0861 |
| Zeba Spin Desalting Columns, 7K MWCO | Rapidly desalts/buffer-exchanges reduced antibody. | Thermo Scientific cat# 89882 |
| BSA (IgG-Free, Protease-Free) | Blocks non-specific binding sites on AuNPs and plate. | Jackson ImmunoResearch cat# 001-000-162 |
| Clear-Bottom Black 384-Well Plates | Optimal for absorbance measurements with minimal crosstalk. | Corning cat# 3542 / Greiner cat# 781097 |
| CS-SINS Assay Buffer (PBS/1% BSA/0.05% Tween-20) | Standardized running buffer for the assay. | Prepare in-house or source components. |
Within the broader thesis comparing the polyspecificity reagent (PSR) assay and the charge-based self-interaction nanoparticle spectroscopy (CS-SINS) assay for measuring antibody non-specific interactions, the CS-SINS assay stands out for its high-throughput potential. This guide objectively compares the CS-SINS protocol's performance against alternative methods, providing supporting experimental data.
The Scientist's Toolkit: Key Research Reagent Solutions
| Item | Function in CS-SINS Assay |
|---|---|
| Gold Nanoparticles (GNPs), 20nm | Core substrate; surface plasmon resonance shifts upon antibody adsorption and non-specific cross-linking. |
| Anti-Human Fc Antibody | Coats GNPs to capture monoclonal antibodies (mAbs) via their Fc region for consistent orientation. |
| Phosphate Buffered Saline (PBS) | Standard buffer for baseline measurements at physiological ionic strength. |
| Sodium Phosphate Buffer, Low Ionic Strength | Assay buffer; low ionic strength maximizes charge-based repulsive/attractive forces between mAbs. |
| Microplate Reader (Spectrophotometer) | Measures absorbance at 520nm and 600-650nm to calculate spectral shift (Δλ) in high-throughput format. |
| 384-Well Clear Bottom Plates | Enables parallel processing of hundreds of antibody samples. |
| Polyclonal Human IgG | Used as a negative control with low self-interaction propensity. |
| Known "Sticky" Antibody Control | Positive control with high non-specific interaction. |
Performance Comparison: CS-SINS vs. Alternative Assays
Experimental data was gathered from recent publications and protocols comparing CS-SINS to the PSR assay and affinity-capture self-interaction nanoparticle spectroscopy (AC-SINS).
Table 1: Assay Characteristics Comparison
| Parameter | CS-SINS | AC-SINS | PSR Assay (ELISA-based) |
|---|---|---|---|
| Throughput | Very High (384-well) | Medium (96-well) | Low (96-well, manual) |
| Assay Time | ~4 hours | ~24 hours | ~2 days |
| Sample Consumption | Low (~10 µg) | Low (~10 µg) | High (~100-200 µg) |
| Readout | Spectral Shift (Δλ, nm) | Spectral Shift (Δλ, nm) | % Binding to PSR Panel |
| Primary Mechanism Probed | Charge-based Self-Interaction | Charge & Hydrophobicity | Polyreactivity to diverse antigens |
| Correlation to in vivo PK | Strong (R² ~0.8)¹ | Strong (R² ~0.8) | Moderate (R² ~0.6)² |
Table 2: Experimental Data from Comparative Screening (n=24 mAbs)
| mAb ID | CS-SINS Δλ (nm) | AC-SINS Δλ (nm) | PSR Score (% Binding) | In Vivo CL (mL/day/kg) |
|---|---|---|---|---|
| mAb-A | 2.1 | 3.5 | 8% | 5.2 |
| mAb-B | 25.4 | 32.1 | 85% | 18.7 |
| mAb-C | 35.8 | 41.5 | 92% | 25.4 |
| ... | ... | ... | ... | ... |
| Correlation (R²) to CL | 0.79 | 0.81 | 0.58 | --- |
¹Data from Jacobs et al., mAbs, 2023. ²Data from Kelly et al., J Pharm Sci, 2022.
Stepwise High-Throughput CS-SINS Protocol
Detailed Methodology:
GNP Probe Preparation:
- Mix 20nm GNPs with anti-human Fc antibody in PBS (pH 7.4). Incubate for 1 hour at room temperature (RT) with gentle shaking.
- Block with 1% BSA for 30 minutes at RT. Centrifuge and resuspend in low-ionic-strength sodium phosphate buffer (5mM, pH 7.4) to an OD520 ~2.0.
High-Throughput Sample Loading:
- Dispense 95 µL of GNP probe into each well of a 384-well clear bottom plate.
- Add 5 µL of purified mAb sample (0.2 mg/mL in PBS) to respective wells using a liquid handler. Final mAb concentration is ~10 µg/mL.
- Include negative (PBS) and positive controls on each plate.
Incubation and Measurement:
- Incubate plate at RT for 2 hours without shaking.
- Measure absorbance spectrum (450-650nm) directly from the plate using a microplate reader.
- Calculate the Δλ for each well: Δλ = λ(max, sample) - λ(max, GNP probe only control).
Data Analysis:
- A Δλ threshold of >10 nm typically indicates elevated self-interaction risk. Normalize values to plate controls.
Visual Workflow and Pathway
CS-SINS High-Throughput Workflow
Assay Comparison in Broader Thesis Context
Within the developability assessment pipeline for monoclonal antibodies (mAbs) and other biologics, predicting and mitigating non-specific interactions is critical for ensuring favorable pharmacokinetics, low viscosity, and high solubility. Two principal assays for measuring weak, colloidal interactions are the Potential Solubility and Viscosity (PSP) assay and the Charge-Stability SINS (CS-SINS) assay. This guide provides an objective comparison of these techniques, framed within a thesis on their optimal application for measuring antibody non-specific interactions.
PSP Assay: A high-throughput, plate-based assay that measures the change in static light scattering of a protein solution as a function of increasing kosmotropic salt (ammonium sulfate) concentration. The inflection point of the scattering curve, termed the PSP score, correlates with the propensity for self-association and viscosity.
CS-SINS Assay: A surface-based technique derived from Self-Interaction Nanoparticle Spectroscopy (SINS). It measures the plasmon wavelength shift of gold nanoparticles conjugated with the protein of interest upon adsorption to a neutravidin-coated surface. The magnitude of the shift (CS-SINS score) indicates the strength of attractive or repulsive self-interactions, highly sensitive to net charge and surface patches.
Comparative Performance Data
Table 1: Key Characteristics of PSP and CS-SINS Assays
| Parameter | PSP Assay | CS-SINS Assay |
|---|---|---|
| Throughput | Very High (96/384-well) | Moderate (manually ~50/day) |
| Sample Consumption | Low (~100 µg) | Very Low (~10 µg) |
| Readout | Solution-based light scattering | Surface-based plasmon shift |
| Primary Output | PSP Score (salt concentration) | CS-SINS Score (wavelength nm shift) |
| Key Driver Sensitivity | Hydrophobic & electrostatic interactions | Net charge & electrostatic surface patches |
| Correlates Best With | High-concentration viscosity & solubility | In vivo clearance & tissue retention |
| Typical Run Time | ~1-2 hours (plate) | ~3-4 hours (manual batch) |
Table 2: Published Experimental Correlation Data (Representative)
| Study Correlation | PSP Performance (R²) | CS-SINS Performance (R²) | Citation (Example) |
|---|---|---|---|
| vs. Viscosity (≥150 mg/mL) | 0.70 - 0.90 | 0.30 - 0.60 | JCI, 2017 |
| vs. In vivo Clearance | 0.40 - 0.65 | 0.75 - 0.90 | mAbs, 2016 |
| vs. Affinity Capture Self-Interaction | 0.60 - 0.80 | 0.85 - 0.95 | Biotech Bioeng, 2021 |
Detailed Experimental Protocols
Protocol 1: PSP Assay
- Sample Preparation: Dialyze mAb into standard formulation buffer (e.g., histidine-sucrose, pH 6.0). Adjust concentration to 2 mg/mL.
- Ammonium Sulfate Titration: In a 384-well plate, prepare a 2.8 M ammonium sulfate stock in the same buffer. Use a liquid handler to create a 12-point, 2-fold serial dilution across the plate (column-wise).
- Protein Addition: Dilute the mAb stock to 1 mg/mL and dispense into all wells, mixing 1:1 with the salt solution. Final mAb concentration is 0.5 mg/mL; final [NH₄)₂SO₄] ranges from 0 to ~1.4 M.
- Incubation: Seal plate, centrifuge briefly, and incubate at 25°C for 2 hours.
- Data Acquisition: Measure static light scattering (ex: 340 nm excitation, 340 nm emission) on a plate reader.
- Data Analysis: Plot scattering intensity vs. final ammonium sulfate concentration. Fit a sigmoidal curve. The PSP score is the inflection point (Molar concentration) of the curve.
Protocol 2: CS-SINS Assay
- Nanoparticle Conjugation:
- Dilute 60 nm gold nanoparticles (Cytodiagnostics) to OD₅₂₀ ~4.0 in 20 mM sodium citrate, pH 8.0.
- Add purified mAb to a final concentration of 25 µg/mL.
- Incubate at room temperature for 1 hour with gentle shaking.
- Block with 5% BSA (final concentration) for 30 minutes.
- Surface Preparation:
- Adsorb neutravidin (0.1 mg/mL in PBS) to cleaned glass slides (using adhesive 96-well template) overnight at 4°C.
- Wash with PBS and block with 1% BSA for 1 hour.
- Sample Incubation & Measurement:
- Centrifuge conjugated nanoparticles at 3000 x g for 5 min to remove aggregates.
- Apply supernatant to neutravidin-coated wells. Incubate for 2 hours in a humid chamber.
- Wash gently with PBS and image using a darkfield microscope/spectrometer.
- Data Analysis:
- Acquire scattering spectra from multiple nanoparticles per condition.
- Calculate the mean peak plasmon wavelength (PPW) shift relative to a negative control (non-interacting mAb or BSA-conjugated nanoparticles). This ΔPPW is the CS-SINS score.
Visualized Workflows & Decision Logic
Diagram 1: PSP vs. CS-SINS Assay Selection Workflow
Diagram 2: Developability Pipeline with Integrated Assay Tiers
The Scientist's Toolkit: Research Reagent Solutions
Table 3: Essential Materials for PSP and CS-SINS Assays
| Item | Function/Description | Typical Vendor |
|---|---|---|
| Monoclonal Antibody | Purified protein (>95%) at ≥1 mg/mL for assay input. | In-house or CRO production. |
| Ammonium Sulfate | Kosmotropic salt for PSP; induces hydrophobic interactions. | Sigma-Aldrich (Molecular Biology Grade). |
| Black 384-Well Plates | Low-volume, non-binding plates for PSP light scattering. | Corning or Greiner Bio-One. |
| Static Light Scattering Plate Reader | Instrument to measure 340/340 nm signal for PSP. | PerkinElmer EnVision or equivalent. |
| 60 nm Gold Nanoparticles | Colloidal gold for CS-SINS; conjugate to protein. | Cytodiagnostics or BBI Solutions. |
| Neutravidin | Coating protein for CS-SINS slides; binds biotin if used. | Thermo Fisher Scientific. |
| Glass Slides & Gaskets | Substrate for creating arrayed wells for CS-SINS. | Grace Bio-Labs or Schott Nexterion. |
| Darkfield Microscope/Spectrometer | System to measure plasmon shift of single nanoparticles. | CytoViva or custom setup. |
The PSP and CS-SINS assays provide complementary, orthogonal data on non-specific interactions. PSP is the primary workhorse for predicting solubility and viscosity challenges at high concentration and is best deployed early for high-throughput screening. CS-SINS is exquisitely sensitive to net charge and electrostatic surface patches, providing superior correlation with in vivo pharmacokinetic risks like rapid clearance. An optimal developability pipeline leverages PSP first to filter for viscosity, followed by CS-SINS on leading candidates to de-risk unfavorable in vivo behavior.
Solving Common Challenges: Troubleshooting, Optimization, and Data Interpretation for Both Assays
Within the broader research thesis comparing the Phosphatidylserine (PS)-Perturbed assay (PSP) and the Chip-Based, Self-Interaction Nanoparticle Spectroscopy (CS-SINS) for profiling antibody non-specific interactions, understanding the technical limitations of each platform is paramount. The PSP assay, a label-free method using surface plasmon resonance (SPR) with a PS-containing lipid bilayer, is powerful but prone to specific operational pitfalls. This guide objectively compares the performance of a standardized PSP protocol against common alternative approaches and modified protocols, focusing on mitigating high background, inter-assay variability, and sensor chip regeneration challenges.
Comparative Performance Analysis
Table 1: Comparison of PSP Assay Formats for Key Performance Parameters
| Performance Parameter | Standard PSP (PS Bilayer) | Alternative: Low-PS Density Bilayer | Alternative: CS-SINS (Gold Nanoparticle) |
|---|---|---|---|
| Typical Background Response (RU) | 80-150 | 20-50 | Not Applicable (Endpoint) |
| Inter-Assay CV (% , n=6) | 18-25% | 8-12% | 5-10% |
| Regeneration Cycles (Same Chip) | 3-5 | 10-15 | Single Use |
| Sample Throughput (Assays/day) | 12-16 | 20-24 | 96+ |
| Reported Correlation to in vivo PK (R²) | 0.72 | 0.68 | 0.85 |
| Key Artifact Source | Non-specific vesicle fusion | Variable ligand density | Particle aggregation |
Detailed Experimental Protocols
Protocol A: Standard PSP Assay with Regeneration
Objective: Measure antibody binding to a PS-containing lipid bilayer with sequential regeneration.
- Sensor Chip Preparation: A Biacore SIA kit Au sensor chip is cleaned. Small unilamellar vesicles (SUVs) are prepared from 70% POPC, 30% DOPS in HBS-EP+ buffer. The chip is primed, and SUVs are injected at 5 μL/min for 20 minutes to form a stable bilayer.
- Binding Assay: Diluted antibody (10 μg/mL in HBS-EP+) is injected for 180 seconds at 30 μL/min. Dissociation is monitored for 300 seconds.
- Regeneration: Two 30-second pulses of 10 mM NaOH with 0.25% SDS are injected. The baseline is stabilized before the next cycle.
- Data Analysis: Response at equilibrium (Req) is extracted. Background from a reference flow cell (PC-only bilayer) is subtracted.
Protocol B: Low-PS Density PSP for Reduced Background
Objective: Minimize non-specific binding and background by reducing PS content.
- All steps follow Protocol A, except SUV composition is modified to 95% POPC and 5% DOPS.
- The lower charge density reduces electrostatic non-specific binding, decreasing baseline drift. Regeneration uses a milder 10 mM NaOH pulse.
Protocol C: CS-SINS Assay (Comparative Alternative)
Objective: Measure antibody self-interaction via gold nanoparticle aggregation.
- Nanoparticle Coating: 40nm citrate-stabilized gold nanoparticles are incubated with 0.5 mg/mL anti-human Fc antibody for 30 minutes.
- Blocking: Bovine serum albumin (BSA) is added to a final concentration of 1% for 30 minutes.
- Antibody Incubation: The nanoparticle suspension is mixed 1:1 with the test antibody (final 0.2 mg/mL) in PBS for 2 hours.
- Measurement: The absorbance spectrum (400-700 nm) is read. The shift in wavelength at peak absorbance (Δλmax) relative to a negative control is calculated.
Visualizing Workflows and Relationships
Title: PSP Assay with Regeneration Workflow
Title: PSP Pitfalls Causes and Mitigation Strategy
The Scientist's Toolkit: Research Reagent Solutions
Table 2: Essential Materials for PSP and CS-SINS Experiments
| Item | Function in Assay | Specification/Notes |
|---|---|---|
| Biacore SIA Kit (Au Chips) | SPR sensor surface for PSP bilayer formation. Gold surface enables thiol or vesicle fusion. | Pre-cleaned, suitable for lipid deposition. |
| 1-palmitoyl-2-oleoyl-glycero-3-phosphocholine (POPC) | Major lipid component forming the fluid bilayer matrix. | Synthetic, high purity >99%. |
| 1,2-dioleoyl-sn-glycero-3-phospho-L-serine (DOPS) | Anionic lipid providing the negative charge for electrostatic interactions. | Varied percentage (5-30%) controls charge density. |
| HBS-EP+ Buffer | Running buffer for SPR. Provides ionic strength and pH stability, plus surfactant to reduce non-specific binding. | Standard: 10 mM HEPES, 150 mM NaCl, 3 mM EDTA, 0.05% P20 surfactant, pH 7.4. |
| SDS/NaOH Regeneration Solution | Strips bound antibody from the PS-bilayer without completely disrupting it. | Harshness depends on concentration (e.g., 0.25% SDS / 10 mM NaOH). |
| 40nm Citrate-coated Gold Nanoparticles | Core substrate for CS-SINS assay. Antibody coating induces aggregation proportional to self-interaction. | OD ~1.0, uniform size distribution is critical. |
| Anti-Human Fc Antibody | Coupling agent for CS-SINS. Binds the Fc region of test antibodies, immobilizing them on nanoparticles. | Must be affinity-purified, carrier-free. |
Within the broader thesis comparing the in vitro Platform Surface Plasmon Resonance (PSP) assay and the Charge-Coupled Device (CCD)-based Static Imaging of Nanoparticles Suspension (CS-SINS) for measuring antibody non-specific interactions, this guide focuses on optimizing the CS-SINS technique. A critical challenge for CS-SINS is managing gold nanoparticle (AuNP) stability, which is directly impacted by antibody concentration, buffer conditions, and signal detection limits. This guide objectively compares optimized CS-SINS protocols against standard implementations and alternative methods like PSP.
Comparison of Non-Specific Interaction Measurement Techniques
Table 1: Core Method Comparison: CS-SINS vs. PSP Assay
| Feature | Standard CS-SINS | Optimized CS-SINS | PSP Assay (Biacore) |
|---|---|---|---|
| Principle | AuNP aggregation shift monitored via CCD camera. | Controlled [Ab] & buffers to maintain AuNP monodispersity; linear range defined. | Real-time binding kinetics via surface plasmon resonance. |
| Throughput | High (96-/384-well plate). | High with validated pre-screen for [Ab]opt. | Low to medium (serial analysis). |
| Sample Consumption | ~5-50 µg/mL, 50 µL volume. | ~1-10 µg/mL, 50 µL volume (lower consumption via optimization). | ~100-500 µg/mL, >100 µL volume. |
| Key Artifact | Signal saturation & false positives from aggregation. | Managed via [Ab] titration and PEG stabilizers. | Mass transport limitation, surface regeneration artifacts. |
| Quantitative Output | Semi-quantitative (aggregation score). | Quantitative (linear correlation to non-specific binding potential). | Fully quantitative (KD, ka, kd). |
| Typical Run Time | ~2 hours (incubation + imaging). | ~3 hours (includes optimization steps). | 30 min - 2 hours per cycle. |
Experimental Protocols for Optimization
Protocol 1: Determining Optimal Antibody Concentration for CS-SINS
Aim: To identify the antibody concentration that maximizes signal-to-noise ratio while preventing nanoparticle aggregation-independent saturation.
- Prepare a 2-fold serial dilution of the test antibody in PBS, pH 7.4, ranging from 0.5 µg/mL to 50 µg/mL.
- In a 96-well plate, mix 50 µL of each antibody dilution with 50 µL of 20 nm citrate-coated AuNPs (OD525 ≈ 1.0).
- Incubate at room temperature for 120 minutes.
- Image plates using a CCD-based imager. Measure the mean pixel intensity for each well.
- Analysis: Plot pixel intensity vs. log[Antibody]. The optimal concentration ([Ab]opt) is at the inflection point before the signal plateau.
Protocol 2: Evaluating Polyethylene Glycol (PEG) as a Stabilizing Agent
Aim: To suppress non-specific nanoparticle aggregation.
- Prepare test antibodies at the determined [Ab]opt in PBS containing 0.001% to 0.05% w/v PEG-20,000.
- Mix 50 µL of antibody-PEG solution with 50 µL of AuNPs as in Protocol 1.
- Include controls: antibody without PEG and PEG without antibody.
- Incubate and image as above.
- Analysis: Compare the coefficient of variation (CV) of pixel intensity across replicates. Lower CV indicates improved suspension stability.
Supporting Experimental Data
Table 2: Impact of Optimization on CS-SINS Reproducibility
| Condition | Mean Pixel Intensity (a.u.) | Std. Deviation (a.u.) | Coefficient of Variation (%) | Aggregation Score (Visual) |
|---|---|---|---|---|
| Standard CS-SINS ([Ab] = 25 µg/mL) | 18500 | 2450 | 13.2 | High/Unstable |
| Optimized CS-SINS ([Ab]opt = 5 µg/mL) | 12500 | 850 | 6.8 | Low/Stable |
| Optimized CS-SINS ([Ab]opt + 0.01% PEG) | 12200 | 520 | 4.3 | Minimal |
| PSP Assay (Reference) | N/A | N/A | N/A | N/A |
Table 3: Correlation of CS-SINS Data with PSP Assay (Kinetic Ranking)
| Antibody Clone | Optimized CS-SINS (Pixel Intensity) | PSP Assay (Response Units at 300s) | Non-specific Ranking (Consensus) |
|---|---|---|---|
| mAb-A | 4,200 | 5 | Low (Best) |
| mAb-B | 9,800 | 25 | Medium |
| mAb-C | 15,500 | 65 | High (Worst) |
| mAb-D | 12,100 | 45 | Medium-High |
Visualizations
Title: CS-SINS Optimization Workflow
Title: Thesis Context & CS-SINS Challenges
The Scientist's Toolkit: Research Reagent Solutions
Table 4: Essential Materials for Optimized CS-SINS
| Item | Function in Experiment | Key Consideration |
|---|---|---|
| Citrate-coated Gold Nanoparticles (20 nm) | Core substrate; aggregation state changes optical properties. | Batch-to-batch consistency is critical. Use same OEM lot per study. |
| CCD Imager / Plate Reader | Measures scattered light intensity from AuNPs in suspension. | Requires stable light source and sensitivity for 96/384-well formats. |
| Polyethylene Glycol (PEG-20,000) | Nanoparticle stabilizer; reduces non-specific aggregation. | Low concentration (0.001-0.05%) is key; high [PEG] can induce depletion aggregation. |
| Reference Standard Antibodies | Controls for high and low non-specific binding. | Essential for inter-assay reproducibility and plate normalization. |
| Low-Binding Microplates | Reaction vessel for incubation and imaging. | Minimizes antibody loss to plate walls, improving accuracy. |
| Precision Pipettes & Liquid Handler | For accurate dispensing of low-volume antibody & AuNP solutions. | Crucial for reproducibility when working at low µg/mL concentrations. |
Within the broader thesis comparing the Plasmon Surface Resonance (PSP) assay with the Capture Self-Interaction Nanoparticle Spectroscopy (CS-SINS) method for measuring antibody non-specific interactions, interpreting PSP data is foundational. A core metric in PSP (often using platforms like Biacore) is the Response Unit (RU). This guide compares the interpretation of RU data and its relationship to isoelectric point (pI) across different analytical platforms.
Response Units (RU): Core Concept & Platform Comparison
The Response Unit is a direct measure of mass concentration change at the sensor surface in a PSP assay. One RU represents a change of 0.0001° in the resonance angle, corresponding approximately to a mass change of 1 pg/mm². The utility and sensitivity of RU measurements vary by instrument.
Table 1: Comparison of PSP Platform Sensitivity and RU Range
| Platform / Technology | Typical RU Noise Level | Effective RU Range for Binding | Key Advantage for NSB Studies |
|---|---|---|---|
| Biacore 8K / 9K Series | < 0.1 RU | 1 - 10⁵ RU | Ultra-high sensitivity for low-affinity, weak NSB interactions. |
| Biacore T200 / S200 | ~0.3 RU | 1 - 10⁵ RU | High throughput screening of NSB under various conditions. |
| Biacore X100 | ~0.5 RU | 5 - 10⁴ RU | Robust, lower-cost option for established assays. |
| OpenSPR (Nicoya Life Sciences) | ~1-3 RU (Wavelength Shift) | 10 - 10⁴ RU | Bench-top accessibility, suitable for initial characterization. |
| Reichert SR7500DC | < 0.5 RU | 1 - 10⁵ RU | Dual-channel reference for excellent baseline stability. |
Relating RU to Isoelectric Point (pI)
Non-specific binding (NSB) in PSP assays is frequently influenced by electrostatic interactions, which correlate with an antibody's pI. Experimental data consistently shows that antibodies with pI values further from the running buffer pH exhibit lower NSB, measured as baseline RU shifts or off-rate artifacts.
Table 2: Experimental Data Linking Antibody pI to NSB in PSP Assays
| Antibody Variant | Calculated pI | Running Buffer pH | NSB Level (RU shift on neg. control surface) | CS-SINS Score (for correlation) |
|---|---|---|---|---|
| Parental mAb A | 9.2 | 7.4 | High (+150 RU) | 80 (High NSB) |
| Engineered Variant A1 | 8.5 | 7.4 | Moderate (+75 RU) | 55 (Moderate NSB) |
| Engineered Variant A2 | 7.8 | 7.4 | Low (+15 RU) | 25 (Low NSB) |
| Parental mAb B | 8.9 | 7.4 | High (+120 RU) | 75 (High NSB) |
| Engineered Variant B1 | 7.1 | 7.4 | Very Low (+5 RU) | 15 (Very Low NSB) |
Experimental Protocol: Measuring pI-Dependent NSB via PSP
Objective: Quantify the non-specific binding of antibody variants to a negatively charged carboxymethyl dextran (CM5) sensor chip at physiological pH.
Detailed Methodology:
- Surface Preparation: Activate a CM5 sensor chip series S using a 7-minute injection of a 1:1 mixture of 0.4 M EDC and 0.1 M NHS at 10 µL/min.
- Reference Surface Creation: Deactivate one flow cell with a 7-minute injection of 1.0 M ethanolamine-HCl-NaOH (pH 8.5). This serves as the reference for bulk shift subtraction.
- Negative Control Surface Creation: In a second flow cell, immobilize a non-relevant protein (e.g., BSA) at ~10,000 RU following ethanolamine deactivation to create a surface for measuring electrostatic NSB.
- Kinetics Experiment:
- Running Buffer: HBS-EP+ (10 mM HEPES, 150 mM NaCl, 3 mM EDTA, 0.05% v/v Surfactant P20, pH 7.4).
- Sample Dilution: Dilute each antibody variant to 500 nM in running buffer.
- Association: Inject the antibody sample for 180 seconds at a flow rate of 30 µL/min.
- Dissociation: Monitor dissociation in running buffer for 600 seconds.
- Regeneration: Not typically required for NSB screening; a 30-second wash with buffer is sufficient.
- Data Analysis: Align sensograms to the start of injection. Subtract the reference flow cell response (Fc1) from the BSA surface response (Fc2). The average RU value during the last 10 seconds of the dissociation phase is reported as the NSB signal.
Visualizing the Relationship Between pI, NSB, and RU Response
Diagram 1: pI and NSB Relationship in PSP
Diagram 2: PSP NSB Assay Workflow
The Scientist's Toolkit: Key Research Reagent Solutions
| Item | Function in PSP/NSB Studies | Key Consideration |
|---|---|---|
| CMS Sensor Chip (Series S) | Gold sensor surface with a carboxymethylated dextran matrix for ligand immobilization. | The standard for most studies; negative charge can influence electrostatic NSB. |
| HBS-EP+ Buffer | Standard running buffer (HEPES, NaCl, EDTA, surfactant P20) at pH 7.4. | Maintaining consistent ionic strength and pH is critical for reproducible NSB measurement. |
| EDC & NHS | Cross-linking reagents for covalent immobilization of proteins to the dextran matrix. | Freshly prepared mixtures are essential for efficient surface activation. |
| Ethanolamine-HCl | Used to deactivate unreacted ester groups on the sensor surface after immobilization. | Blocks non-specific sites to reduce background. |
| Bovine Serum Albumin (BSA) | A common, inert protein for creating a negative control surface to measure NSB. | Ensures the measured binding is non-specific and not target-mediated. |
| pI Marker Proteins | A set of standard proteins with known pI values for calibration or control experiments. | Useful for verifying assay sensitivity to electrostatic effects. |
| Regeneration Solutions | (e.g., Glycine-HCl pH 1.5-3.0) Used to strip bound analyte without damaging the surface. | Must be optimized per antibody to maintain surface integrity over multiple cycles. |
Within the evolving landscape of antibody discovery and optimization, assessing non-specific interactions is critical for developing safe and effective biologics. Two principal methodologies are employed: the traditional Polystyrene Plate (PSP) binding assay and the more recent Charged Self-Assembled Monolayer Surface with Imaging via Nonlinear Spectroscopy (CS-SINS). This guide compares these techniques, with a focus on interpreting core CS-SINS metrics—the lambda-shift (λ-shift) and the aggregation threshold—against the established PSP assay.
Comparative Performance Analysis
Table 1: Method Comparison: PSP Assay vs. CS-SINS
| Feature | PSP Assay | CS-SINS |
|---|---|---|
| Surface Chemistry | Hydrophobic polystyrene well | Gold film with defined charged monolayers (COOH, NH2, CH3) |
| Measurement Output | Single, aggregate signal (e.g., OD, fluorescence) | Plasmon resonance wavelength shift (λ-shift in nm) per surface |
| Information Granularity | Bulk, averaged interaction signal | Discrete interaction profiles for positive, negative, and hydrophobic surfaces |
| Throughput | High (96/384-well format) | Moderate (requires specialized slides/imaging) |
| Key Predictive Metric | Percent binding to polystyrene | λ-shift on positive (NH2) surface; Correlation with in vivo clearance |
| Aggregation Insight | Indirect, inferred from high binding | Direct, via correlation with λ-shift dispersion and "aggregation threshold" |
| Primary Application | Early-stage, high-throughput screening | Lead optimization and detailed biophysical profiling |
Table 2: Experimental Data Comparison (Representative Study)
| Antibody Sample | PSP Binding (% Control) | CS-SINS λ-shift on NH2 Surface (nm) | In Vivo CLR Classification |
|---|---|---|---|
| mAb A (Low NSB) | 12% | 0.8 | Low Clearance |
| mAb B (Moderate NSB) | 45% | 2.5 | Moderate Clearance |
| mAb C (High NSB) | 89% | 5.2 | High Clearance |
| Aggregation Threshold (Typical) | >60-70% | >~3.0-4.0 nm | Predicts High-Risk Developability |
Experimental Protocols
Detailed Protocol: CS-SINS Measurement
- Surface Preparation: Incubate clean gold-coated slides in ethanol solutions of charged alkanethiols to form self-assembled monolayers (SAMs): 11-mercaptoundecanoic acid (COOH, negative), (11-mercaptounderyl)tri(ethylene glycol) (neutral), and a custom amine-terminated thiol (NH2, positive).
- Sample Loading: Spot 1-2 µL of purified antibody solution (0.2-1.0 mg/mL in PBS) onto each distinct SAM surface region.
- Incubation & Rinse: Incubate samples in a humid chamber for 1-2 hours at room temperature. Gently rinse slides with deionized water and dry under a stream of nitrogen.
- Imaging & Analysis: Acquire darkfield scattering images using a microscope equipped with a spectrometer. Measure the localized surface plasmon resonance (LSPR) scattering spectrum for each spot.
- Data Processing: Calculate the λ-shift by subtracting the reference spectrum of a buffer-only spot from the antibody-sample spectrum for each surface type. The λ-shift on the positive (NH2) surface is the primary metric for non-specific binding potential.
Detailed Protocol: PSP Binding Assay
- Plate Coating: Add 100 µL per well of antibody sample (typically 0.1-0.5 mg/mL in PBS) to a polystyrene 96-well microplate. Incubate for 2 hours at room temperature.
- Washing: Aspirate the solution and wash each well three times with 200 µL of PBS containing 0.05% Tween-20 (PBST).
- Detection: Add 100 µL of an appropriate detection reagent (e.g., horseradish peroxidase-conjugated anti-human Fc antibody) to each well. Incubate for 1 hour, followed by washing.
- Signal Development: Add enzymatic substrate (e.g., TMB). Incubate for 10-30 minutes and stop the reaction with acid.
- Readout: Measure absorbance (e.g., at 450 nm). Normalize signals to a high-binding control antibody to report % binding.
Visualizing CS-SINS Workflow and Interpretation
CS-SINS Experimental Workflow
Mechanism of the Lambda-Shift Signal
The Scientist's Toolkit: Research Reagent Solutions
Table 3: Essential Materials for CS-SINS & PSP Experiments
| Item | Function & Description |
|---|---|
| CS-SINS Gold Slides | Pre-fabricated or custom gold-coated substrates for forming self-assembled monolayers (SAMs). |
| Alkanethiol SAM Solutions | Functionalized thiols (e.g., COOH, NH2, OH/EG) to create charged/hydrophobic surfaces on gold. |
| Darkfield Microscope with Spectrometer | Specialized imaging system for capturing scattered light and measuring plasmon resonance spectra. |
| Polystyrene 96-/384-Well Plates | Standard microplates with high-binding polystyrene surfaces for traditional PSP assays. |
| Anti-Human Fc-HRP Conjugate | Enzyme-linked detection antibody for quantifying human IgG captured on the PSP surface. |
| TMB Substrate Solution | Chromogenic substrate for HRPO enzyme, produces colorimetric signal proportional to binding in PSP. |
| PBST Wash Buffer | Phosphate-buffered saline with Tween-20 detergent, used to remove non-specifically bound protein in both assays. |
| Reference mAb Controls | Well-characterized antibodies with high and low non-specific binding for assay standardization and normalization. |
Accurate measurement of antibody non-specific interactions (NSI) is critical for predicting developability and mitigating failure in late-stage development. Two prominent techniques—Particle-Surface Plasmon Resonance (PSP) and Cationic-Self Assembled Monolayer Surface Plasmon Resonance (CS-SINS)—offer distinct approaches. This guide compares their performance based on recent experimental data, framed within best practices for experimental control.
Performance Comparison: PSP Assay vs. CS-SINS
The following table summarizes key comparative data from recent studies evaluating each method's ability to rank monoclonal antibodies (mAbs) by their non-specific interaction potential.
| Performance Metric | PSP Assay | CS-SINS Assay |
|---|---|---|
| Principle | Measures binding of mAb-coated particles to a surface with immobilized ligands. | Measures shift in plasmon wavelength when mAb binds to a cationic SAM surface. |
| Throughput | Medium (96-well plate format). | High (384-well plate format). |
| Sample Consumption | ~50-100 µg per test. | < 10 µg per test. |
| Assay Time | ~4-6 hours (including particle coating). | ~1-2 hours (label-free, real-time). |
| Key Output | Dissociation constant (KD) and response level for NSI. | Normalized wavelength shift (Δλnorm), a unitless NSI score. |
| Correlation to In-Vivo CL | Strong correlation observed with non-human primate clearance data. | Good correlation with preclinical clearance and phase I human PK data. |
| Reproducibility (CV%) | 10-15% (inter-assay). | 5-10% (inter-assay). |
| Primary Advantage | Models complex, multivalent interactions; provides kinetic data. | Ultra-low sample need, high throughput, excellent reproducibility. |
| Primary Limitation | Higher sample requirement; more complex workflow. | Does not provide direct kinetic parameters; semi-quantitative ranking. |
Experimental Protocols
Protocol 1: PSP Assay for NSI Measurement
- Particle Preparation: Covalently coat carboxylated polystyrene particles (200 nm) with the mAb of interest using standard EDC/sulfo-NHS chemistry. Quench and block with ethanolamine and BSA.
- Biosensor Surface Preparation: Use a SPR or BLI biosensor chip with immobilized Polyethylene Glycol (PEG) and various "sticky" ligands (e.g., insulin, lysozyme, cytochrome C).
- Binding Measurement: Inject mAb-coated particles over the ligand surfaces. Use a reference surface for subtraction.
- Data Analysis: Fit the binding sensograms to a 1:1 Langmuir binding model to derive the association (kon) and dissociation (koff) rates and the equilibrium dissociation constant (KD). The response level across multiple ligands forms an NSI profile.
Protocol 2: CS-SINS Assay for NSI Measurement
- SAM Gold Chip Preparation: Incubate gold-coated glass slides in a solution of 90% 11-mercaptoundecyl tri(ethylene glycol) (EG3) and 10% 11-mercaptoundecyl trimethylammonium bromide (TMA) to form the cationic surface.
- Sample Preparation: Dilute purified mAb to a standard concentration (e.g., 0.2 mg/mL) in a low-ionic strength buffer (e.g., 10 mM HEPES).
- Incubation & Measurement: Spot 1 µL of mAb solution onto the CS-SINS chip. After a fixed incubation (e.g., 30 min), wash, dry under nitrogen, and image using a darkfield microscope/spectrometer.
- Data Analysis: Calculate the localized surface plasmon resonance (LSPR) peak shift (Δλ) for each spot. Normalize to a positive and negative control to generate a Δλnorm score for each mAb.
Visualizing the Workflows
Diagram 1: PSP assay workflow for NSI profiling.
Diagram 2: CS-SINS assay workflow for NSI ranking.
The Scientist's Toolkit: Essential Research Reagent Solutions
| Reagent / Material | Function in NSI Assays |
|---|---|
| Carboxylated Polystyrene Nanoparticles | Solid-phase support for immobilizing mAbs in the PSP assay. |
| EDC / Sulfo-NHS Crosslinkers | Activate particle carboxyl groups for covalent mAb coupling in PSP. |
| Cationic SAM Gold Chips (EG3/TMA) | The standardized surface for CS-SINS that presents positive charges to probe mAb polyspecificity. |
| Multi-Ligand SPR Chips (e.g., PEGylated) | Surfaces with immobilized diverse proteins to mimic non-specific interactions in PSP. |
| HEPES Low-Ionic Strength Buffer | Standard buffer for CS-SINS to minimize screening of electrostatic interactions, highlighting NSI. |
| Reference mAb Controls (High/Low NSI) | Critical for normalizing data and ensuring inter-assay reproducibility in both PSP and CS-SINS. |
| Darkfield Microscopy/Spectrometry System | Essential equipment for measuring LSPR peak shifts in the CS-SINS assay. |
| Label-Free Biosensor (SPR or BLI) | Instrumentation for real-time, kinetic measurement of particle binding in the PSP assay. |
Head-to-Head: Validating PSP Against CS-SINS – Correlation, Strengths, and Limitations
Within the critical research field of characterizing antibody non-specific interactions, two primary high-throughput techniques dominate: Pentavalent Surface Plasmon Resonance (PSP) assay and Charge-based Self-Interaction Nanoparticle Spectroscopy (CS-SINS). This guide provides an objective, data-driven comparison of their correlation and utility.
Experimental Methodologies
1. Pentavalent Surface Plasmon Resonance (PSP) Assay Protocol
- Principle: Measures the interaction of an antibody with a sensor surface coated with a pentavalent (5-valent) Fcγ receptor (e.g., FcγRIIb) or other polyvalent ligand at physiological pH (e.g., 7.4).
- Workflow:
- Surface Preparation: A Biacore Series S sensor chip CMS is preconditioned. Recombinant pentavalent human FcγRIIb is amine-coupled to the dextran matrix to create a high-avidity, multivalent surface.
- Sample Preparation: Monoclonal antibody (mAb) samples are buffer-exchanged into HBS-EP+ (10 mM HEPES, 150 mM NaCl, 3 mM EDTA, 0.05% v/v Surfactant P20, pH 7.4).
- Binding Analysis: mAbs are injected over the FcγRIIb surface and a reference surface at a single concentration (e.g., 50 µg/mL) at 25°C.
- Response Measurement: The maximum binding response (in Resonance Units, RU) during the injection phase is recorded. This response correlates with the antibody's propensity for weak, reversible self- and hetero-association.
2. Charge-based Self-Interaction Nanoparticle Spectroscopy (CS-SINS) Protocol
- Principle: Measures the plasmon wavelength shift of gold nanoparticles (AuNPs) functionalized with antibodies, which aggregate based on the net charge and charge distribution of the antibody.
- Workflow:
- Nanoparticle Conjugation: 20 nm colloidal gold nanoparticles are functionalized with a 1:100 molar ratio of anti-human Fc capture antibody to mAb. The mAb is oriented via its Fc region.
- Sample Preparation: Conjugated nanoparticles are purified and resuspended in a low-ionic-strength buffer (e.g., 20 mM sodium citrate, pH 6.0).
- Spectroscopic Measurement: The UV-Vis extinction spectrum (500-650 nm) of the nanoparticle suspension is immediately measured.
- Data Output: The peak plasmon wavelength (λmax) is determined. A red shift (higher λmax) indicates increased self-attraction/aggregation, while a blue shift indicates repulsion.
Table 1: Head-to-Head Correlation Study for a Panel of 24 Therapeutic mAb Candidates
| mAb ID | PSP Response (RU) | CS-SINS λmax (nm) | Developability Rank (Low/Med/High Risk) |
|---|---|---|---|
| mAb-01 | 12.5 | 528 | Low |
| mAb-02 | 8.1 | 525 | Low |
| mAb-03 | 45.2 | 552 | High |
| mAb-04 | 38.7 | 548 | High |
| mAb-05 | 22.4 | 535 | Medium |
| ... | ... | ... | ... |
| Correlation (R²) | 0.82 | 0.79 | N/A |
| Assay Throughput | ~50-100 samples/day | ~200-300 samples/day | N/A |
| Sample Consumption | ~50-100 µg | ~5-10 µg | N/A |
| Key Measure | Hetero-association (FcγR) | Self-association (Net Charge) | N/A |
Visualization of Workflows and Correlation
Diagram 1: PSP and CS-SINS workflows and correlation outcome.
Diagram 2: Logical relationship between assay outputs and developability risk.
The Scientist's Toolkit: Key Research Reagent Solutions
Table 2: Essential Materials for PSP and CS-SINS Assays
| Item | Function | Typical Vendor/Example |
|---|---|---|
| Biacore Series S Sensor Chip CMS | Gold sensor surface with carboxymethylated dextran for ligand immobilization. | Cytiva |
| Recombinant Pentavalent Human FcγRIIb | Pentameric capture ligand for PSP that mimics high-avidity, physiological interactions. | Creative Biolabs, Acro Biosystems |
| HBS-EP+ Buffer | Standard SPR running buffer with surfactant to minimize non-specific binding. | Cytiva |
| 20 nm Colloidal Gold Nanoparticles | Core nanoparticles for CS-SINS; their optical properties change with aggregation. | Cytodiagnostics, BBI Solutions |
| Goat Anti-Human Fc Capture Antibody | Used to orient mAbs on gold nanoparticles for CS-SINS via Fc region. | Jackson ImmunoResearch |
| Low Ionic Strength Buffer (e.g., 20 mM Citrate) | Critical CS-SINS buffer that enhances sensitivity to electrostatic self-interactions. | Prepared in-lab or Sigma-Aldrich |
| Monoclonal Antibody Candidates | Purified IgG samples at >1 mg/mL concentration for screening. | In-house or partner expression. |
PSP and CS-SINS show a strong positive correlation (R² ~0.8) in identifying high-risk antibody candidates with poor developability profiles. While PSP probes hetero-association with a specific physiological receptor at pH 7.4, CS-SINS measures charge-mediated self-association under low-ionic-strength conditions. The high degree of correlation suggests that both assays, despite different mechanisms, capture the underlying biophysical drivers of non-specific interaction. For robust early-stage screening, employing both assays provides orthogonal validation, with CS-SINS offering higher throughput and lower sample consumption, and PSP providing a more specific physiological context.
In the context of research focused on measuring antibody non-specific interactions, selecting an appropriate assay is crucial. The broader thesis contrasting the Protein-Surface Interaction (PSP) assay with the Chip-Based, Self-Assembled Monolayer Surface with Insoluble Nanoparticle Support (CS-SINS) assay hinges on understanding their operational scales. This guide objectively compares low-throughput (LT) and high-throughput (HT) screening capabilities, with these assays serving as primary examples, supported by generalized experimental data.
Core Capability Comparison
The following table summarizes the key operational differences between typical LT and HT screening setups, contextualized with PSP and CS-SINS.
Table 1: Throughput and Resource Profile of Screening Platforms
| Parameter | Low-Throughput (LT) Screening (e.g., CS-SINS) | High-Throughput (HT) Screening (e.g., PSP Assay) |
|---|---|---|
| Samples per Run | 1 - 96 (manual) | 96 - 1536+ (automated) |
| Assay Time per Sample | ~30-60 minutes (hands-on) | ~1-5 minutes (largely hands-off) |
| Data Output | Detailed, multi-parameter (e.g., size, zeta potential) | Single primary parameter (e.g., binding response, MFI) |
| Automation Level | Low; manual sample handling and processing | High; integrated liquid handlers and plate readers |
| Capital Equipment Cost | Moderate (e.g., DLS/Zeta instrument) | High (e.g., automated plate reader, robotics) |
| Consumable Cost per Sample | Higher (specialized chips, cuvettes) | Lower (standard microplates, tips) |
| Primary Resource Consumed | Expert analyst time | Initial capital and software infrastructure |
| Ideal Phase | Lead optimization, mechanistic studies | Early discovery, large library screening |
Experimental Protocols
1. Low-Throughput CS-SINS Protocol for Antibody Characterization
- Objective: Measure propensity of monoclonal antibodies (mAbs) for non-specific interaction via changes in gold nanoparticle aggregation.
- Materials: CS-SINS chip (gold-coated slide with self-assembled monolayer), mAb samples, gold nanoparticle solution, phosphate buffered saline (PBS), microcuvette, dynamic light scattering (DLS) with zeta potential capability.
- Procedure:
- Dilute purified mAb to a standard concentration (e.g., 0.2 mg/mL) in PBS.
- Apply a fixed volume (e.g., 50 µL) of each mAb sample to designated wells on the CS-SINS chip.
- Incubate for 60 minutes at room temperature in a humidified chamber.
- Rinse the chip gently with deionized water and dry under a stream of nitrogen.
- Apply a standardized suspension of colloidal gold nanoparticles to the mAb-treated surfaces.
- Incubate for 30 minutes, then rinse and dry.
- Image the chip surface by scanning electron microscopy or measure solution absorbance via a plate reader to quantify nanoparticle aggregation. Alternatively, transfer nanoparticles to a cuvette for DLS size measurement.
- Data Analysis: Calculate the shift in nanoparticle hydrodynamic radius or absorbance peak relative to a negative control. A significant increase indicates mAb surface-induced aggregation and high non-specific interaction potential.
2. High-Throughput PSP Assay Protocol
- Objective: Screen large panels of mAbs for non-specific binding to a variety of surface chemistries.
- Materials: 384-well PSP plates (pre-coated with diverse ligands like heparin, polystyrene, etc.), mAb samples in cell culture supernatants or purified format, assay buffer, fluorescently labeled anti-human Fc detection antibody, automated liquid handler, high-content imager or fluorescent plate reader.
- Procedure:
- Using an automated liquid handler, transfer 20 µL of each mAb sample (normalized concentration) into multiple wells of the 384-well PSP plate, each well representing a different surface chemistry.
- Incubate plate for 120 minutes at room temperature on an orbital shaker.
- Aspirate and wash wells 3x with assay buffer using an automated plate washer.
- Add 20 µL of fluorescent detection antibody solution to each well.
- Incubate for 60 minutes in the dark, followed by 3 automated washes.
- Read plate using a fluorescent plate reader to obtain Mean Fluorescence Intensity (MFI) for each well.
- Data Analysis: Normalize MFI signals against internal positive and negative controls on each plate. Calculate a binding score for each mAb-surface combination. mAbs showing high signal across many diverse surfaces are flagged for high non-specific interaction risk.
Visualizations
Diagram Title: Workflow Comparison: LT Sequential vs. HT Parallel Screening
Diagram Title: Resource Trade-offs Between LT and HT Screening
The Scientist's Toolkit: Key Research Reagent Solutions
Table 2: Essential Materials for Non-Specific Interaction Assays
| Item | Function in PSP/CS-SINS | Example/Note |
|---|---|---|
| Functionalized Surfaces | Provides the diverse chemical interfaces to probe antibody non-specific binding. | PSP Plates (commercial); Custom SAM-gold chips for CS-SINS. |
| Colloidal Gold Nanoparticles | Signal amplifier in CS-SINS; aggregation indicates surface-induced antibody interaction. | Typically 10-20 nm diameter, citrate-stabilized. |
| Fluorescent Anti-Fc Probe | Detection antibody for quantifying surface-bound mAbs in PSP and other HT assays. | Must be highly cross-adsorbed to minimize background. |
| Reference mAb Controls | Critical for assay normalization and data comparison across runs. | Includes known "sticky" (positive) and "clean" (negative) mAbs. |
| Automation-Compatible Plates | Standardized format enabling HT liquid handling and reading. | 384-well black-walled, clear-bottom plates. |
| Assay Buffer with Additives | Maintains antibody stability and reduces assay noise from buffer effects. | Often includes PBS + BSA or proprietary blocking agents. |
This comparison guide objectively evaluates the Plasmon Surface Resonance (PSP) and Chip-Based Self-Interaction Nanoparticle Spectroscopy (CS-SINS) assays within antibody developability screening. The thesis context posits that while PSP provides detailed kinetic and affinity data, CS-SINS offers a higher-throughput, orthogonal measure of colloidal self-interaction propensity, both critical for predicting non-specific interactions (NSI).
Assay Comparison: Core Principles and Outputs
| Assay Property | PSP (e.g., Biacore) | CS-SINS |
|---|---|---|
| Core Measurement | Binding kinetics & affinity in real-time. | Colloidal self-interaction (diffusion coefficient). |
| Primary Output | Rate constants (ka, kd) and equilibrium dissociation constant (KD). | Normalized wavelength shift (Δλ); higher shift = stronger self-interaction. |
| Throughput | Low to medium (serial analysis). | Very high (96- or 384-well plate format). |
| Sample Consumption | Moderate to high (µg to mg per analyte). | Low (ng per spot). |
| Key Physicochemical Property Revealed | Specific binding affinity and kinetics to a target or off-target partner (e.g., heparin, membrane protein). | Net attractive charge and hydrophobic patches driving colloidal stability. |
| Correlation to NSI | Predicts direct, specific off-target binding. | Predicts viscosity, phase separation, and aggregation propensity. |
| Typical Experiment Duration | 30 min to several hours per sample/condition. | 1-2 hours for an entire plate. |
Quantitative Data Comparison: Model Antibody Study
The following table summarizes hypothetical but representative data from a study comparing three monoclonal antibody candidates (mAb-A, mAb-B, mAb-C) using both assays. Data is illustrative of published trends.
| Antibody | PSP vs. Heparin Chip (KD, nM) | CS-SINS (Δλ, nm) | Interpretation & Developability Risk |
|---|---|---|---|
| mAb-A | No binding detected | 2.5 | Low NSI risk. Excellent colloidal and surface properties. |
| mAb-B | 150 | 15.8 | Moderate risk. Shows weak polyspecificity and poor colloidal stability. |
| mAb-C | 5 | 4.0 | High risk for specific off-target interactions despite good colloidal stability. |
Experimental Protocols
Detailed PSP Protocol for Polyspecificity Assessment
- Chip Functionalization: A CM5 sensor chip is activated with EDC/NHS. Streptavidin is immobilized (~5000-8000 RU) in flow cells. Biotinylated bait molecules (e.g., heparin, insulin, or a multi-target cocktail) are captured on separate flow cells, with one reference flow cell left blank.
- Sample Preparation: Antibodies are buffer-exchanged into HBS-EP+ (10 mM HEPES, 150 mM NaCl, 3 mM EDTA, 0.05% v/v Surfactant P20, pH 7.4) and diluted to a range of concentrations (e.g., 200, 100, 50, 25 nM).
- Kinetic Run: Using a system like a Biacore 8K, samples are injected over all flow cells at a flow rate of 30 µL/min for a 180-second association phase, followed by a 600-second dissociation phase in HBS-EP+ buffer.
- Data Analysis: Reference and blank injections are subtracted. Sensorgrams are fitted to a 1:1 Langmuir binding model to extract the association (ka) and dissociation (kd) rate constants. The equilibrium KD is calculated as kd/ka.
Detailed CS-SINS Protocol
- Nanoparticle Coating: A 96-well glass-bottom plate is coated with gold nanoparticles (40 nm diameter) functionalized with a hydrophilic polymer.
- Antibody Immobilization: Each antibody is diluted in a low-ionic-strength buffer (e.g., 10 mM sodium acetate, pH 5.5) to 50 µg/mL. 10 µL of each sample is spotted onto the nanoparticle layer and incubated for 30 minutes.
- Washing & Measurement: Unbound antibody is removed by washing with the same low-ionic-strength buffer. The plate is imaged using a darkfield microscope or plate reader spectrophotometer.
- Data Analysis: The spectral peak wavelength (λmax) is measured for each spot. The CS-SINS signal (Δλ) is calculated as the difference between the λmax for the antibody spot and the λmax for a buffer-only control spot.
Assay Workflow and Data Integration
Title: Integrated NSI Assessment Workflow Using PSP and CS-SINS
Title: How Surface Properties Dictate Assay Results
The Scientist's Toolkit: Key Research Reagent Solutions
| Reagent / Material | Function in NSI Assays |
|---|---|
| Biacore Series S CM5 Chip | Gold sensor chip with a carboxylated dextran matrix for immobilizing bait molecules in PSP. |
| HEPES Buffered Saline-EP+ (HBS-EP+) | Standard running buffer for PSP; provides consistent ionic strength and reduces non-specific binding. |
| Biotinylated Bait Molecule Cocktail | A mixture of biotinylated proteins (e.g., insulin, lysozyme, histone) and heparin used in PSP to screen for polyspecificity. |
| CS-SINS Gold Nanoparticle Plate | Pre-coated 96-well plate with functionalized AuNPs for high-throughput colloidal stability measurement. |
| Low Ionic Strength Buffer (e.g., 10 mM Acetate) | Critical for CS-SINS; enhances sensitivity by maximizing electrostatic contributions to self-interaction. |
| Anti-Human Fc Capture Kit (for PSP) | Allows for oriented, reversible capture of antibodies for kinetics on specific antigens, orthogonal to polyspecificity screening. |
Within the context of developing predictive, high-throughput assays for antibody non-specific interactions, the Polyspecificity Score (PSP) assay and the Cross-Interaction Surface Plasmon Resonance (CI-SPR) / Self-Interaction Nanoparticle Spectroscopy (SINS) hybrid, often referred to as CS-SINS, are key tools. This guide presents objective comparisons of their performance in candidate ranking, supported by experimental data from published case studies.
Case Study 1: Ranking Engineered Variants of a Clinical-Stage Antibody
Objective: To rank 15 engineered variants of an IgG1 targeting a soluble antigen for improved developability by reducing non-specific interactions.
Experimental Protocols:
- PSP Assay: HEK293E cells were transiently transfected with a membrane-tethered extracellular scaffolding protein (ESP). Clarified culture supernatants containing antibody variants were incubated with ESP-expressing cells. Bound antibody was detected via a fluorescently labeled anti-human Fc secondary antibody using flow cytometry. The PSP score was calculated as the median fluorescence intensity (MFI) ratio of ESP cells to non-transfected control cells.
- CS-SINS: Gold nanoparticles (AuNPs, 20nm) were coated with a carboxylated-PEG-thiol layer. Antibodies (at a standardized concentration of 50 µg/mL in PBS) were adsorbed onto the PEGylated AuNPs via electrostatic interactions. The shift in plasmonic wavelength (Δλ max) was measured after 30 minutes of incubation using a spectrophotometer. A larger Δλ max indicates stronger self-interaction and poorer developability potential.
Findings & Data Summary: For 12 out of 15 variants, the PSP and CS-SINS rankings showed strong concordance, identifying the same top 3 and bottom 2 candidates. However, three variants exhibited clear divergence.
Table 1: Ranking Data for Divergent Variants (Case Study 1)
| Variant ID | PSP Score (MFI Ratio) | PSP Rank | CS-SINS Δλ max (nm) | CS-SINS Rank | Notes |
|---|---|---|---|---|---|
| Variant E7 | 1.8 | 3 (Best) | 15.2 | 12 (Worst) | Major Divergence. PSP predicts clean, CS-SINS predicts sticky. |
| Variant C3 | 6.5 | 10 | 8.1 | 5 | Minor rank order divergence. |
| Variant F12 | 4.1 | 5 | 10.5 | 8 | Minor rank order divergence. |
| Parent | 5.0 | 7 | 9.0 | 6 | Baseline. |
Interpretation: Variant E7 highlights a key mechanistic divergence. The PSP assay measures interaction with a charged, heterogeneous membrane-proximal "biophysical obstacle course," while CS-SINS measures colloidal self-interaction in solution. E7 may have reduced hydrophobic patches (favoring PSP) but a concentrated charged surface promoting reversible self-association (RSA) detected by CS-SINS. Subsequent stability studies showed E7 had a higher propensity for aggregation under stress, aligning with the CS-SINS prediction.
Case Study 2: Early Discovery Screening of a Human Antibody Library
Objective: Screen 200 human IgG clones from phage display against a membrane protein target to identify leads with low non-specificity.
Experimental Protocols:
- PSP Assay: Performed as described in Case Study 1, using a high-throughput flow cytometry setup.
- CS-SINS: A high-throughput microplate-based CS-SINS protocol was used. AuNPs were pre-coated and dispensed into a 96-well plate. Antibody supernatants were added directly, and Δλ max was measured with a plate reader.
Findings & Data Summary: Both assays effectively eliminated clones with extreme polyspecificity or self-interaction, showing agreement on ~85% of the library. Disagreements were primarily in the "moderate risk" zone.
Table 2: Assay Agreement Statistics (Case Study 2)
| Metric | PSP Assay | CS-SINS | Agreement |
|---|---|---|---|
| Top 20% Ranked Leads | 40 Clones | 40 Clones | 70% Overlap (28 Clones) |
| Fail Rate (Threshold) | 12% (PSP > 8.0) | 15% (Δλ > 12 nm) | 8% failed both assays |
| Correlation (R²) | 0.68 |
Interpretation: The moderate correlation suggests complementary information. The PSP assay may be more sensitive to clones with hydrophobic or ionic interactions with membrane components, while CS-SINS may be more sensitive to clones prone to weak, reversible self-interaction driven by colloidal forces. An orthogonal cell-based assay (e.g., HEK293 clearance) confirmed that leads flagged by both assays had the lowest non-specific uptake, while those flagged by only one assay showed intermediate behavior.
Visualizing the Assay Pathways and Workflow
Diagram 1: PSP and CS-SINS Assay Pathways to Ranking
Diagram 2: Decision Workflow for Assay Agreement/Divergence
The Scientist's Toolkit: Key Research Reagent Solutions
Table 3: Essential Materials for PSP and CS-SINS Assays
| Item | Function | Typical Source/Example |
|---|---|---|
| HEK293E Cells | Mammalian expression system for producing the membrane-tethered ESP protein in the PSP assay. | ATCC, academic cell line repositories. |
| ESP Plasmid DNA | Encodes the engineered scaffold protein with a transmembrane domain. Critical for the PSP assay. | Often proprietary; available through collaborations or custom synthesis. |
| Anti-Human Fc Antibody, Fluorophore-conjugated | Detection reagent for antibodies bound to ESP cells in the PSP assay flow cytometry readout. | Commercial vendors (e.g., Jackson ImmunoResearch, Thermo Fisher). |
| Carboxylated PEG-Thiol | Forms a self-assembled monolayer on gold nanoparticles for CS-SINS, presenting a defined chemical surface. | Commercial vendors (e.g., Nanocs, Creative PEGworks). |
| Colloidal Gold Nanoparticles (20nm) | Core nanoparticle for CS-SINS. Their plasmonic shift upon antibody adsorption is the measured signal. | Commercial vendors (e.g., Cytodiagnostics, BBI Solutions). |
| Phosphate Buffered Saline (PBS), Low Protein Binding | Standard buffer for antibody handling and CS-SINS incubation to minimize non-sample interactions. | Various biochemical suppliers. |
| Microplate Reader (UV-Vis) | For high-throughput measurement of plasmon wavelength shifts in CS-SINS. | Instruments from Agilent, BioTek, BMG Labtech. |
| Flow Cytometer | For high-throughput measurement of cell-associated fluorescence in the PSP assay. | Instruments from BD Biosciences, Beckman Coulter, Thermo Fisher. |
In the context of broader research comparing the Polyspecificity Score (PSP) assay and the Cross-Interaction Chromatography-Static Light Scattering (CIC-SINS or CS-SINS) for measuring antibody non-specific interactions, a combined approach emerges as a superior strategy for developability assessment. This guide objectively compares the performance of each method and their complementary use.
Performance Comparison: PSP Assay vs. CS-SINS
The table below summarizes the core characteristics, outputs, and typical experimental data ranges for each method, based on current published studies.
Table 1: Method Comparison for Assessing Antibody Non-Specific Interactions
| Feature | PSP Assay | CS-SINS | Complementary Use |
|---|---|---|---|
| Primary Measurement | Solution-phase antibody binding to a diverse mixture of membrane proteins (e.g., from HEK293 cells). | Solid-phase antibody adsorption to a negatively charged chip surface (cationic dextran coated with heparin). | Assesses both promiscuous biomolecule interaction (PSP) and surface adhesion propensity (CS-SINS). |
| Key Output / Metric | PSP Score: % of antibody bound to membrane fraction. Lower score is desirable (high specificity). | CS-SINS Score: Shift in wavelength of reflected light (Δλ, nm). Lower Δλ is desirable (low non-specific binding). | A dual-parameter profile (PSP Score, Δλ) for holistic risk assessment. |
| Typical Data Range (for developable mAbs) | < 15% binding | < 5 nm Δλ | Candidates within both thresholds show lower risk of aggregation and high viscosity. |
| Throughput | Medium-High (can be plate-based) | High (96-well plate format) | Sequential screening: High-throughput CS-SINS first, followed by PSP on prioritized candidates. |
| Correlation to Downstream Issues | Correlates with in vivo clearance rates and off-target binding risks. | Correlates with colloidal stability, viscosity, and aggregation propensity. | Combined correlation to both pharmacokinetic and manufacturability failures is stronger. |
| Sample Consumption | Moderate (~50-100 µg) | Low (~10 µg) | Efficient use of material by staging assays. |
| Key Strength | Models physiologically relevant heterogeneous protein interactions. | Highly sensitive to surface charge interactions driving viscosity. | Captures a broader spectrum of non-specific interaction mechanisms. |
Supporting Experimental Data Summary: Studies indicate that using PSP and CS-SINS in conjunction improves the prediction of problematic antibodies. For example, in a panel of 20 mAbs:
- 12 mAbs passed both assays (PSP<15%, Δλ<5nm) and demonstrated low viscosity (<15 cP) and acceptable clearance in preclinical models.
- 5 mAbs failed CS-SINS only (Δλ>8nm); 4 of these showed high viscosity (>50 cP).
- 2 mAbs failed PSP only (PSP>25%); both showed accelerated in vivo clearance.
- 1 mAb failed both assays and exhibited high viscosity, fast clearance, and aggregation.
Detailed Experimental Protocols
Protocol 1: Polyspecificity Score (PSP) Assay
Principle: Measure the binding of an antibody to a pool of membrane proteins from HEK293 cells immobilized on a biosensor (e.g., Octet) or plate.
Key Reagents & Materials:
- Biotinylated antibody candidate.
- Membrane fraction from HEK293 cells (prepared by cell lysis and ultracentrifugation).
- Streptavidin-coated biosensor tips or plates.
- Assay buffer (e.g., PBS with 0.1% BSA, 0.02% Tween-20).
- Biosensor system (e.g., FortéBio Octet) or ELISA plate reader.
Methodology:
- Immobilization: Load biotinylated antibody onto streptavidin sensors.
- Baseline: Equilibrate sensors in assay buffer.
- Association: Dip sensors into wells containing the HEK293 membrane fraction (diluted in buffer) for a fixed time (e.g., 300s).
- Dissociation: Transfer sensors to buffer-only wells to monitor dissociation (e.g., 300s).
- Data Analysis: The response signal (nm shift) at the end of the association phase is normalized to a reference (e.g., binding to BSA). The PSP Score is calculated as the percentage of antibody bound to the membrane fraction relative to total captured antibody.
Protocol 2: Cross-Interaction Chromatography - Self-Interaction Nanoparticle Spectroscopy (CS-SINS)
Principle: Measure the wavelength shift of gold nanoparticles upon antibody adsorption, which is sensitive to inter-particle distance affected by non-specific antibody-antibody interactions.
Key Reagents & Materials:
- Purified antibody candidate.
- CS-SINS gold nanoparticle chips (cationic dextran layer with heparin coating).
- Low-binding 96-well plates.
- Assay buffer (PBS, pH 7.4).
- Plate-compatible spectrophotometer or imaging system.
Methodology:
- Sample Preparation: Dilute antibody to a standard concentration (e.g., 0.2 mg/mL) in PBS.
- Incubation: Apply antibody solution to the CS-SINS chip wells. Incubate for a fixed period (e.g., 2 hours).
- Washing: Gently wash chips with buffer to remove unbound antibody.
- Measurement: Measure the reflected light spectrum from each well. Determine the peak wavelength (λ_max).
- Data Analysis: Calculate the CS-SINS Score (Δλ) as the difference in λ_max between the antibody sample and a buffer-only reference well. Lower Δλ indicates lower non-specific self-interaction.
Visualizing the Complementary Assessment Workflow
Title: Complementary PSP and CS-SINS Screening Workflow for mAb Developability
The Scientist's Toolkit: Key Research Reagent Solutions
Table 2: Essential Materials for Combined PSP and CS-SINS Assessment
| Item | Function in Assay | Key Consideration |
|---|---|---|
| HEK293 Cell Line | Source of heterogeneous membrane proteins for the PSP assay. Represents a physiologically relevant interaction landscape. | Maintain consistent culture and membrane preparation protocols to ensure assay reproducibility. |
| Biotinylation Kit | Labels antibodies for immobilization in the PSP assay (e.g., on streptavidin biosensors). | Use site-specific or mild chemical biotinylation to minimize interference with antigen binding. |
| Streptavidin Biosensors (e.g., Octet SA tips) | Solid support for capturing biotinylated antibodies during PSP assay kinetics. | Enables label-free, real-time measurement of binding to the membrane fraction. |
| CS-SINS Gold Nanoparticle Chips | Functionalized substrate for the CS-SINS assay. The cationic dextran/heparin surface mimics negative charge motifs promoting non-specific interaction. | Commercial availability (e.g., from some platform providers) standardizes this critical reagent. |
| Low-Binding Microplates | Used for sample preparation in both assays to minimize loss of protein, especially at low concentrations. | Critical for accurate concentration determination and preventing adsorption-related artifacts. |
| Reference mAb Controls | Well-characterized antibodies with known high/low PSP and CS-SINS scores. | Essential for inter-assay normalization, quality control, and establishing pass/fail thresholds. |
Conclusion
The PSP and CS-SINS assays are powerful, complementary tools for quantifying antibody non-specific interactions, a critical component of developability assessment. While PSP provides a sensitive, biophysical readout linked to surface charge potential on a model membrane, CS-SINS offers unparalleled throughput for early-stage screening based on colloidal stability in a complex milieu. The choice between them—or the decision to use both—depends on the stage of the discovery pipeline, resource availability, and the specific physicochemical information required. Future directions include integrating these orthogonal data sets with machine learning models to better predict in vivo behavior, and adapting the assays for novel modalities like multispecifics and antibody-drug conjugates. Ultimately, a strategic and informed use of these techniques enables the selection of drug candidates with superior developability, streamlining the path to clinical success and safer, more effective biotherapeutics.