Therapeutic Index: Calculation, Clinical Significance, and Application in Drug Development
This article provides a comprehensive analysis of the therapeutic index (TI), a critical quantitative measure of drug safety.
Therapeutic Index: Calculation, Clinical Significance, and Application in Drug Development
Abstract
This article provides a comprehensive analysis of the therapeutic index (TI), a critical quantitative measure of drug safety. Tailored for researchers, scientists, and drug development professionals, it covers the foundational principles of TI, including its standard calculation as TD50/ED50. It further explores methodological applications in preclinical and clinical settings, troubleshooting challenges with narrow-TI drugs, optimization strategies, and validation through regulatory and comparative frameworks. The content synthesizes current regulatory perspectives and scientific advancements to guide safety assessment throughout the drug development pipeline.
Defining the Therapeutic Index: Core Principles and Safety Significance
What is the Therapeutic Index?
The Therapeutic Index (TI) is a quantitative measurement of the relative safety of a drug, providing a critical comparison between its toxic dose and its therapeutic dose [1]. It is a cornerstone concept in pharmacology and drug development, serving as a key parameter for assessing the safety margin of a drug candidate [2]. In essence, the TI defines the window between the desired therapeutic effect and the onset of adverse effects, guiding dosing decisions in clinical practice and risk-benefit assessments during drug development [3] [4].
Core Concept and Calculation
The Therapeutic Index is fundamentally a ratio. Classically, it is calculated using the doses that produce a response in 50% of a population. In preclinical animal studies, the median lethal dose (LD₅₀) is often used, while in clinical contexts, the median toxic dose (TD₅₀) is more relevant [5] [1] [6].
The standard formulas are:
Where:
- ED₅₀ (Median Effective Dose): The dose that produces a desired therapeutic effect in 50% of the test population [6].
- TD₅₀ (Median Toxic Dose): The dose that produces a defined toxic effect in 50% of the population [6].
- LD₅₀ (Median Lethal Dose): The dose that is lethal for 50% of the test population, primarily determined in animal studies [5] [6].
A higher TI value indicates a wider margin of safety. This means a patient would have to take a much higher dose to reach the toxic threshold than the dose required to elicit the therapeutic effect [7]. Conversely, a low TI indicates a narrow margin of safety, where the effective and toxic doses are close together [3] [4].
Table 1: Key Terms in Therapeutic Index Determination
| Term | Full Form | Definition |
|---|---|---|
| ED | Effective Dose | The dose or concentration of a drug that produces a intended biological response [1]. |
| ED₅₀ | Median Effective Dose | The dose that produces a specified therapeutic effect in 50% of the population [6]. |
| TD | Toxic Dose | The dose at which toxicity occurs [1]. |
| TD₅₀ | Median Toxic Dose | The dose required to produce a particular toxic effect in 50% of subjects [6]. |
| LD₅₀ | Median Lethal Dose | The dose that causes death in 50% of a test population, typically measured in animal studies [5] [1]. |
Experimental Determination of Therapeutic Index
Determining the TI involves generating dose-response data for both efficacy and toxicity. The following workflow and methodology, exemplified by a comparative study of anti-inflammatory agents, outline a standard experimental approach [8].
Experimental Workflow for TI Determination
Detailed Methodology: In Vitro Assessment of Anti-inflammatory Agents [8]
This protocol determines the TI by comparing cytotoxicity (LC₅₀) to the half-maximal inhibitory concentration (IC₅₀) for a specific biochemical activity.
Cell Culture:
- Cell Line: Wehi-164 fibrosarcoma cells.
- Culture Conditions: Cells are maintained in RPMI-1640 medium supplemented with 5% fetal calf serum, penicillin (100 U/mL), and streptomycin (100 µg/mL). Cultures are kept at 37°C in a humidified incubator with 5% CO₂.
Drug Treatment and Dose-Response:
- Test agents (e.g., dexamethasone, piroxicam, diclofenac, plant extracts like Glycyrrhiza glabra and Matricaria aurea) are prepared as sterile solutions.
- Two-fold serial dilutions of each agent are prepared in a phosphate-buffered saline (PBS).
- Triplicate wells of cells are treated with these dilutions for a set period (e.g., 24 hours). Untreated cells exposed only to PBS serve as the control.
Cytotoxicity Assay (Vital Dye Exclusion):
- After incubation, cells are washed with ice-cold PBS and fixed with 5% formaldehyde.
- Fixed cells are stained with a 1% crystal violet solution.
- After washing, the stained cells are lysed and solubilized with a 33.3% acetic acid solution.
- The density of the developed purple color is measured colorimetrically at 580 nm. The color density is directly proportional to the number of viable cells.
- Data Analysis: A concentration-response curve is plotted, and linear regression analysis is used to estimate the LC₅₀ (the concentration that produces 50% cytotoxicity).
Functional Efficacy Assay (Gelatin Zymography):
- This step assesses the inhibition of matrix metalloproteinases (MMPs), a therapeutically relevant target.
- Aliquots of conditioned media from treated cells are subjected to electrophoresis on gelatin-containing polyacrylamide gels (SDS-PAGE) under non-reducing conditions.
- Gels are then washed in 2.5% Triton X-100 to remove SDS and incubated for 24 hours at 37°C in an activation buffer (Tris-HCl, CaCl₂, pH 7.4).
- Gels are stained with Coomassie Blue. Proteolytic activity appears as clear bands against a blue background, where MMPs have digested the gelatin.
- Data Analysis: The surface and intensity of the lysis bands are quantified and compared to untreated controls. A concentration-response curve is plotted, and the IC₅₀ (the concentration that produces 50% inhibition of MMP activity) is determined via linear regression.
Therapeutic Index Calculation:
- The TI for each agent is calculated using the formula: TI = LC₅₀ / IC₅₀ [8]. A higher TI indicates a more favorable safety profile for the anti-inflammatory effect.
Table 2: Research Reagent Solutions for TI Experiments
| Research Reagent / Material | Function in the Experimental Protocol |
|---|---|
| Wehi-164 Fibrosarcoma Cell Line | A model system to study the cytotoxic and anti-inflammatory (MMP inhibitory) effects of drugs in a controlled in vitro environment [8]. |
| RPMI-1640 Culture Medium | Provides essential nutrients and a stable environment to maintain cell viability and growth during the experiment [8]. |
| Test Agents (e.g., Diclofenac, Dexamethasone) | The investigational drugs or compounds whose safety and efficacy margins are being determined [8]. |
| Crystal Violet Stain | A vital dye used to distinguish and quantify viable cells after fixed treatment; it binds to cellular proteins and DNA [8]. |
| Gelatin-Embedded Polyacrylamide Gels | The substrate for zymography; gelatin serves as the target for MMP enzymes, allowing visual quantification of their inhibitory activity [8]. |
| SDS (Sodium Dodecyl Sulfate) | A detergent used in electrophoresis to denature proteins while maintaining their enzymatic activity after renaturation [8]. |
Interpretation and Clinical Relevance in Drug Development
The calculated TI is not just a number; its interpretation is critical for decision-making in drug development and clinical use. A key application is the classification of Narrow Therapeutic Index (NTI) drugs.
Narrow Therapeutic Index (NTI) Drugs
NTI drugs are those where small differences in dose or blood concentration can lead to serious therapeutic failures or severe, life-threatening adverse reactions [4]. Regulatory bodies like the FDA characterize NTI drugs as having less than a 2-fold difference in the minimum toxic concentration (MTC) and minimum effective concentration (MEC) in the blood [4].
Table 3: Examples of Drugs and Their Therapeutic Indices
| Drug | Therapeutic Index (Approximate) | Clinical Implications |
|---|---|---|
| Remifentanil [1] [7] | 33,000 : 1 | Very wide margin of safety; dosing is more forgiving. |
| Diazepam [1] [7] | 100 : 1 | Relatively wide safety margin. |
| Morphine [1] [7] | 70 : 1 | Moderate safety margin. |
| Warfarin [3] [4] | Narrow (approx. 2:1 or less) | Requires careful therapeutic drug monitoring (INR checks) and dose titration due to high risk of bleeding or thrombosis [3] [4]. |
| Digoxin [1] | ~2 : 1 | Narrow margin; small dose increases can lead to toxicity (arrhythmias). Requires blood level monitoring. |
| Lithium [3] [1] | Narrow | Blood levels must be monitored closely to avoid toxicity. |
Considerations and Limitations of the Therapeutic Index
While invaluable, the TI has limitations that scientists and clinicians must consider [5] [6]:
- Endpoint Dependency: The TI value for a single drug can vary dramatically depending on the chosen therapeutic and toxic endpoints.
- Inter-individual Variability: The TI is a population-based metric and does not account for idiosyncratic reactions or individual patient factors like genetics (pharmacogenomics), age, or drug interactions [5] [4].
- Slope of Dose-Response Curves: The classic TI calculation does not consider the slopes of the efficacy and toxicity curves. Two drugs can have the same TI, but one may become lethal over a very narrow dose range, while the other may have a more gradual transition [6].
- Exposure vs. Dose: In modern drug development, the TI is increasingly based on plasma exposure levels (AUC, Cmax) rather than administered dose, as this provides a more accurate reflection of the drug's presence at the target site [2] [1].
The following diagram summarizes the logical relationship between the dose, population response, and the derived TI, while also highlighting key influencing factors.
TI Determination and Influencing Factors
The Therapeutic Index remains a fundamental, quantitative tool for evaluating the safety profile of a drug. From initial in vitro screening to clinical application, the TI and its derivative concept—the narrow therapeutic index—provide an essential framework for ensuring that medications are both effective and safe. For researchers and drug developers, a deep understanding of its calculation, interpretation, and limitations is crucial for optimizing candidate selection and designing clinical trials. For clinicians, it underscores the importance of precise dosing and vigilant monitoring, especially for NTI drugs, to achieve optimal patient outcomes.
In preclinical and clinical pharmacology, the quantal dose-response relationship is fundamental for evaluating the efficacy and safety of a drug. Unlike a graded response, which measures the intensity of an effect in a single individual, a quantal response is a binary, "all-or-none" event where the specified effect is either observed or not in each member of a population [9] [10]. This model is essential for determining critical safety parameters, primarily the therapeutic index, which quantifies the relative safety of a drug.
The following table summarizes the core definitions of the key metrics derived from quantal dose-response curves:
| Term | Definition | Interpretation |
|---|---|---|
| ED50 | The dose of a drug that produces a specified therapeutic effect in 50% of the test population [6] [11]. | A measure of the median effectiveness; a lower ED50 indicates a more potent drug. |
| TD50 | The dose required to produce a particular toxic effect in 50% of the population [6] [1]. | A measure of the median toxicity. |
| LD50 | The dose required to cause death in 50% of a test population (typically determined in animal studies) [6] [1]. | A measure of lethality, used predominantly in preclinical drug development. |
These values are graphically determined from a quantal dose-response curve, which plots the cumulative percentage of a population responding as a function of the logarithm of the dose. This characteristically produces a sigmoidal (S-shaped) curve for each endpoint—effect, toxicity, and lethality [6] [10].
Experimental Determination and Protocols
Standardized Experimental Workflow
The determination of ED50, TD50, and LD50 follows a structured experimental protocol, typically conducted during the preclinical phase of drug development. The general workflow for establishing a quantal dose-response relationship can be visualized below.
Detailed Methodologies for Key Experiments
Protocol for ED50Determination
The objective is to determine the dose at which 50% of the test population exhibits a predefined therapeutic effect.
- Endpoint Definition: The quantal effect must be unambiguously defined. For an anticonvulsant drug, for instance, the endpoint could be "prevention of tonic hindlimb extension in an electroshock seizure model" [12].
- Population and Grouping: A homogeneous animal population (e.g., inbred strain of mice) is selected. Animals are randomly assigned to groups, with each group (typically 8-12 animals) receiving a different dose of the test drug. A control group receives the vehicle.
- Dosing and Measurement: Doses are administered, often spaced logarithmically (e.g., 1, 2, 4, 8 mg/kg). After a predetermined time, the stimulus (e.g., electroshock) is applied, and each animal is scored as either "protected" or "not protected."
- Data Analysis: The cumulative percentage of responders at each dose is plotted against the log-dose. The resulting sigmoidal curve is fitted using statistical methods like probit analysis, which linearizes the curve for more accurate estimation of the ED50 and its confidence intervals [12].
Protocol for TD50and LD50Determination
The methodology for TD50 is analogous to that for ED50, but the monitored endpoint is a specific adverse event (e.g., a predefined level of motor inc coordination or hepatotoxicity) [6]. The LD50 test, historically a cornerstone of toxicology, follows a similar protocol with mortality as the endpoint [6].
- Endpoint Definition: For LD50, the endpoint is unequivocally death within a specified observation period (e.g., 14 days). For TD50, the toxic effect (e.g., a 50% increase in serum creatinine indicating nephrotoxicity) must be objectively measurable.
- Dosing and Observation: Groups of animals receive progressively higher doses of the drug. Subjects are closely monitored for signs of toxicity and mortality for a set duration.
- Data Analysis: The cumulative percentage of animals exhibiting toxicity or death at each dose is plotted. The TD50 or LD50 is the dose corresponding to the 50% response on the fitted sigmoidal curve.
The Scientist's Toolkit: Key Research Reagents and Materials
The following table details essential materials and their functions in these experiments.
| Research Reagent / Material | Function in Experiment |
|---|---|
| Inbred Animal Model (e.g., C57BL/6 mice, Sprague-Dawley rats) | Provides a genetically homogeneous test population to reduce variability in dose-response data [6]. |
| Test Compound / Drug Candidate | The investigational substance whose efficacy and toxicity are being quantified. |
| Vehicle Solution (e.g., saline, DMSO, carboxymethylcellulose) | The solvent or carrier used to dissolve or suspend the test compound for administration; serves as the negative control. |
| Probit Analysis Software (e.g., specialized bioassay tools in SAS, R, or GraphPad Prism) | Statistical software used to linearize the sigmoidal quantal response data and accurately calculate median doses (ED50, LD50) and confidence intervals [12]. |
| Clinical Chemistry Analyzer | An automated instrument used to measure biomarkers in serum/plasma (e.g., ALT, Creatinine) to objectively define toxic endpoints (TD50) [6]. |
Calculation of the Therapeutic Index and Its Application
Therapeutic Index Formulae and Interpretation
The therapeutic index (TI), also known as the therapeutic ratio, is a quantitative measure of a drug's safety margin. It is calculated directly from the median doses obtained from quantal dose-response curves [6] [1] [5].
The most common formula used in clinical pharmacology is: TI = TD50 / ED50
A higher TI value indicates a wider margin of safety, meaning there is a large difference between the dose required for efficacy and the dose that causes toxicity. Conversely, a low TI indicates a narrow therapeutic window, requiring careful dose titration and monitoring [3] [13] [11].
In preclinical animal studies, the TI is often calculated using the lethal dose: TI = LD50 / ED50 [1]
Another related metric is the Protective Index (PI), which is identical to the clinical TI formula: PI = TD50 / ED50 [1]
The relationship between these curves and indices is critical for understanding drug safety. The following diagram illustrates how the ED50, TD50, and the resulting therapeutic window are derived from quantal curves.
Limitations and Modern Interpretations
While foundational, the classical therapeutic index has significant limitations that researchers must consider [6] [5]:
- Endpoint Dependency: Different therapeutic or toxic endpoints will yield different ED50 and TD50 values, meaning a single drug has multiple TIs.
- Idiosyncratic Toxicity: The TI does not account for unpredictable, non-dose-related adverse reactions (e.g., anaphylaxis).
- Curve Slope Ignorance: The TI is a ratio of two specific points and does not consider the slopes of the dose-response curves. Two drugs can have the same TI, but one may become toxic with a small dose increase if its toxicity curve is steep [6].
- Animal-to-Human Translation: Preclinical LD50 data from animals may not accurately predict human toxicity.
Due to these limitations, modern drug development increasingly relies on exposure-based therapeutic indices, which use plasma concentration (e.g., AUC or Cmax) at steady-state rather than administered dose, providing a more pharmacologically relevant safety margin [1].
Quantitative Data and Clinical Relevance
Comparative Therapeutic Indices of Common Drugs
The therapeutic index varies dramatically among drugs, directly influencing their clinical use and monitoring requirements. The table below provides representative examples.
| Drug | Therapeutic Index (Representative) | Clinical Implication |
|---|---|---|
| Penicillin G | Very High [13] | Generally safe; wide margin between antibacterial and toxic doses. |
| Diazepam | ~100 : 1 [1] | Relatively safe, but overdose is possible. |
| Morphine | ~70 : 1 [1] | Requires careful dosing due to respiratory depression risk. |
| Warfarin | ~2 : 1 [1] [11] | Narrow Therapeutic Index; necessitates intensive monitoring (INR tests). |
| Lithium | ~2 : 1 [3] [1] | Narrow Therapeutic Index; requires regular serum level monitoring. |
| Digoxin | ~2 : 1 [1] | Narrow Therapeutic Index; small dose increases can lead to severe toxicity. |
Application in Drug Development and Regulation
The determination of ED50, TD50, and the resulting TI is integral to the drug development pipeline. Regulatory agencies like the FDA use this information to categorize drugs. Narrow Therapeutic Index (NTI) drugs are subject to more stringent bioequivalence standards for generic approval and require specific clinical monitoring guidelines in their prescribing information [3] [11]. For NTI drugs, the inter-individual variability in pharmacokinetics and pharmacodynamics is a critical concern, driving the need for personalized dosing strategies and therapeutic drug monitoring (TDM) to ensure patient safety while maintaining efficacy [1].
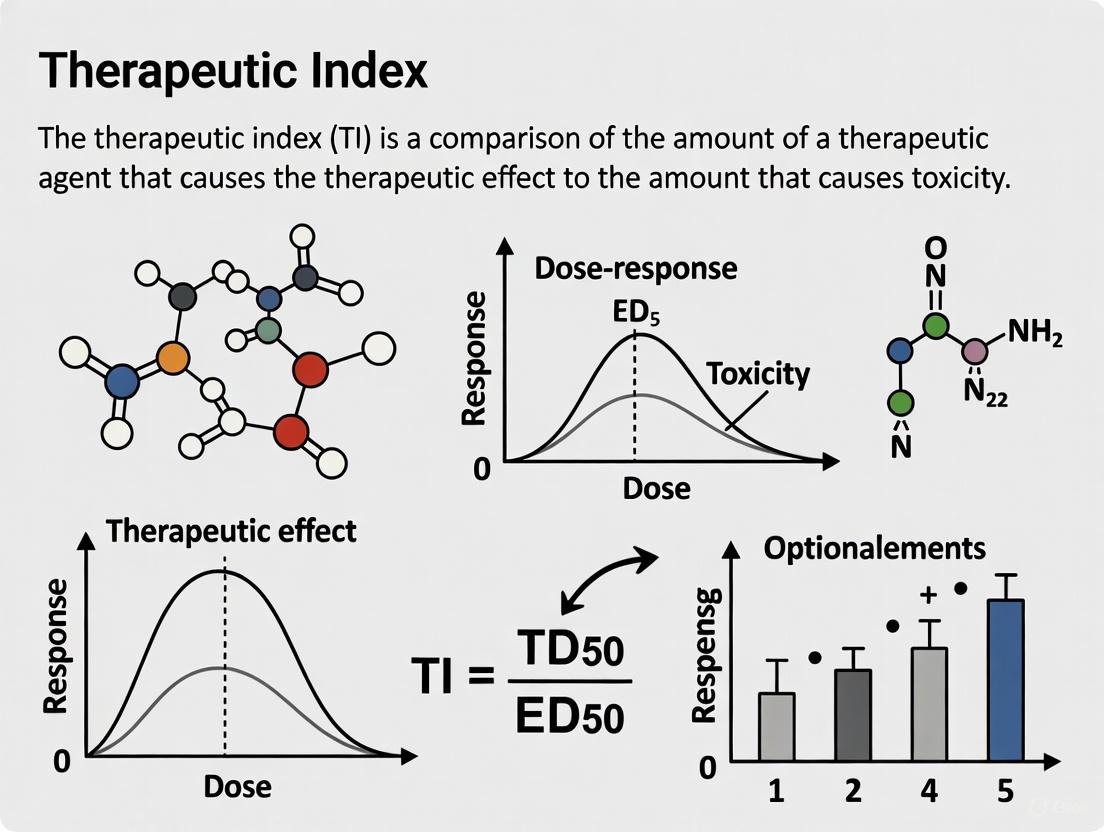
The therapeutic index (TI), also referred to as the therapeutic ratio, is a quantitative measurement of the relative safety of a drug. It is a critical parameter in pharmacology that compares the amount of a therapeutic agent that causes a toxic effect to the amount that elicits the desired therapeutic effect [1]. This ratio provides a fundamental safety margin estimate, guiding clinicians in dosing decisions and informing drug developers about a compound's risk-benefit profile [5]. The TI is foundational to both clinical practice and pharmaceutical development, serving as a key indicator for determining how safely a drug can be administered across diverse patient populations.
The related concepts of therapeutic window or safety window refer to the range of doses between the minimum concentration required for efficacy and the maximum concentration before unacceptable toxicity occurs. This window represents the dose range that optimizes therapeutic benefit while minimizing adverse effects, providing a crucial framework for dosage regimen design [1]. Understanding both the TI and therapeutic window is essential for maximizing patient safety, particularly for medications where the difference between effective and toxic concentrations is small.
Calculation Methods and Formulas
Core Calculation Formulas
The therapeutic index is classically calculated using median effective and toxic doses derived from quantal dose-response curves:
Standard Therapeutic Index:
TI = TD₅₀ / ED₅₀where TD₅₀ represents the dose that produces a toxic effect in 50% of the population, and ED₅₀ represents the dose that produces the desired therapeutic effect in 50% of the population [1] [5] [14].Preclinical Safety Assessment: In animal studies, the TI is often calculated as
TI = LD₅₀ / ED₅₀where LD₅₀ is the lethal dose for 50% of the animal population [1] [15].Efficacy-based Therapeutic Index: An alternative calculation
TI = ED₅₀ / TD₅₀is sometimes used, where a lower value indicates a larger therapeutic window [1].
Advanced Safety Calculations
For more refined safety assessments, particularly for drugs with narrow TIs, additional calculations are employed:
Protective Index:
PI = TD₅₀ / ED₅₀which is the inverse of the efficacy-based therapeutic index [1].Certainty Safety Factor (CSF):
CSF = TD₁ / ED₉₉which represents the ratio between the dose toxic to 1% of the population and the dose effective for 99% of the population. A CSF > 1 indicates that the dose effective in 99% of patients is lower than the dose that would be toxic to 1% of patients [14].Standard Safety Margin:
[(TD₁ - ED₉₉) / ED₉₉] × 100which expresses the percentage by which the ED₉₉ must be increased to reach the TD₁ [14].
Figure 1: Hierarchy of Therapeutic Index Calculations and Related Safety Metrics
Experimental Protocols for TI Determination
Preclinical TI Assessment Protocol
Objective: To determine the median lethal dose (LD₅₀) and median effective dose (ED₅₀) in animal models during early drug development.
Methodology:
- Animal Models: Utilize at least two mammalian species (typically rodent and non-rodent) with both sexes represented
- Dosing Groups: Minimum of four dose levels with 8-10 animals per group
- Administration: Route matching intended clinical application (oral, intravenous, etc.)
- Observation Period: 14 days with continuous monitoring for mortality and toxic signs
- Data Collection: Record time of onset, duration, and severity of toxic effects
- Necropsy: Gross pathological examination of all animals
- Statistical Analysis: Probit analysis to calculate LD₅₀ with 95% confidence intervals
Endpoint Measurements: Mortality rates, clinical observations, body weight changes, and gross pathology findings [1].
Clinical TI Assessment Protocol
Objective: To establish the therapeutic index in human subjects during clinical trials.
Methodology:
- Study Design: Randomized, double-blind, dose-ranging studies
- Patient Population: Representative of target indication with appropriate inclusion/exclusion criteria
- Dose Escalation: Multiple dose levels from subtherapeutic to dose-limiting toxicity
- Endpoint Assessment:
- Efficacy endpoints specific to indication
- Toxicity grading using standardized criteria (e.g., CTCAE)
- Pharmacokinetic Sampling: Intensive sampling to determine exposure-response relationships
- Statistical Analysis:
- Logistic regression for quantal dose-response curves
- Estimation of ED₅₀ and TD₅₀ with confidence intervals
- Population modeling to assess covariates affecting TI
Endpoint Measurements: Primary efficacy outcomes, adverse event incidence and severity, pharmacokinetic parameters (AUC, Cmax, Tmax) [15].
Interpretation of High vs. Low Therapeutic Index
Drugs with High Therapeutic Index
A high therapeutic index indicates a wide margin of safety, meaning there is a substantial difference between the dose required for therapeutic effects and the dose that causes toxicity. Drugs with high TI values (generally >10) are considered relatively safe, as patients would need to take a much higher dose than the therapeutic dose to reach the toxic threshold [1] [3]. These medications typically have a wide therapeutic window, allowing for flexible dosing with minimal risk of adverse events at standard therapeutic doses [16].
Examples of high TI drugs include:
For high TI drugs, therapeutic drug monitoring is generally not required, and they can often be administered without extensive dose individualization or frequent safety monitoring [3].
Drugs with Low Therapeutic Index
A low therapeutic index indicates a narrow margin of safety, with only a small difference between therapeutic and toxic doses. Drugs with low TI values (generally <3) are considered potentially dangerous, as small increases in dose can result in toxic effects [15] [16]. These medications have a narrow therapeutic window, requiring careful titration and close monitoring to maintain plasma concentrations within the therapeutic range while avoiding toxicity [14].
The US Food and Drug Administration defines a drug as having a narrow therapeutic index when there is less than a twofold difference in median lethal dose (LD₅₀) and median effective dose (ED₅₀), or when there is less than a twofold difference in minimum toxic concentrations (MTC) and minimum effective concentrations (MEC) in the blood [15].
Examples of low TI drugs include:
- Digoxin: TI ≈ 2:1 [1] [17]
- Lithium: Narrow therapeutic range [1] [14]
- Warfarin: Narrow therapeutic range [17] [14]
- Phenytoin: Narrow therapeutic range [14]
- Gentamicin: Narrow therapeutic range [14]
- Theophylline: Narrow therapeutic range [3]
Figure 2: Clinical Implications of High vs. Low Therapeutic Index Drugs
Quantitative Comparison of Drug Safety Profiles
Table 1: Therapeutic Indices of Common Medications
| Drug | Therapeutic Index | Therapeutic Class | Clinical Implications |
|---|---|---|---|
| Remifentanil | 33,000:1 [1] [7] | Opioid analgesic | Extremely wide safety margin; minimal overdose risk at therapeutic doses |
| Penicillin | >100 [17] [16] | Antibiotic | Wide safety margin; dosing flexible with minimal monitoring |
| Diazepam | 100:1 [1] [7] | Benzodiazepine | Moderately wide safety margin; some monitoring advised |
| Morphine | 70:1 [1] [7] | Opioid analgesic | Requires careful dosing due to respiratory depression risk |
| Cocaine | 15:1 [1] | Stimulant, local anesthetic | Narrow safety margin; high abuse and toxicity potential |
| Ethanol | 10:1 [1] | Sedative | Narrow safety margin; precise dosing control difficult |
| Paracetamol/Acetaminophen | 10:1 [1] | Analgesic/antipyretic | Narrow safety margin; hepatotoxicity with slight overdose |
| Digoxin | 2:1 [1] [17] | Cardiac glycoside | Very narrow safety margin; requires therapeutic drug monitoring |
Table 2: Drugs with Narrow Therapeutic Index Requiring Clinical Monitoring
| Drug | Primary Indication | Therapeutic Range | Toxic Manifestations | Monitoring Parameters |
|---|---|---|---|---|
| Warfarin [14] [3] | Anticoagulation | INR 2.0-3.0 (most indications) | Bleeding, hemorrhage | INR, bleeding signs |
| Lithium [1] [14] | Bipolar disorder | 0.6-1.2 mEq/L | Tremor, polyuria, confusion, seizures | Serum lithium levels, renal function |
| Digoxin [1] [17] | Heart failure, atrial fibrillation | 0.5-2.0 ng/mL | Nausea, vomiting, arrhythmias, vision changes | Serum digoxin levels, ECG, electrolytes |
| Phenytoin [14] | Seizure disorders | 10-20 mg/L | Nystagmus, ataxia, drowsiness | Serum levels, neurological exam |
| Gentamicin [14] [3] | Severe bacterial infections | Peak: 5-10 mg/L (depending on infection)Trough: <1-2 mg/L | Nephrotoxicity, ototoxicity | Peak/trough levels, renal function, hearing tests |
| Theophylline [3] | Asthma, COPD | 10-20 mg/L | Nausea, tachycardia, seizures | Serum levels, clinical response |
Regulatory and Drug Development Considerations
Bioequivalence Standards for Narrow TI Drugs
For generic versions of narrow therapeutic index drugs, regulatory authorities generally recommend reduced bioequivalence limits due to the potential clinical consequences of small differences in bioavailability [15]. The standard bioequivalence acceptance range of 80-125% for the ratio of geometric means of AUC and Cmax may be tightened for NTIDs to ensure that generic substitutions do not result in toxic or subtherapeutic responses [15].
The high interpatient variability in drug exposure presents particular challenges for NTIDs. Highly variable drugs are defined by the FDA as those for which inter-subject variance (%CV) in exposure is greater than 30%. For some CAR-T cell therapies, pharmacokinetic variance can span three orders of magnitude, creating significant challenges for dosing precision [18].
Therapeutic Index in Advanced Therapeutics
The concept of therapeutic index applies differently to novel therapeutic modalities:
Engineered T-cell Therapies: These "living drugs" present unique challenges for TI determination due to their complex pharmacology involving proliferation, differentiation, tissue trafficking, and immune system interactions [18]. For CAR-T cells, both AUC and Cmax are predictive of both response and toxicity (primarily cytokine release syndrome), with some products showing little to no therapeutic index as the same mechanisms underlying efficacy also mediate toxicity [18].
Radiotherapy: The therapeutic ratio in cancer radiotherapy is determined by the maximum radiation dose for killing cancer cells and the minimum radiation dose causing acute or late morbidity in normal tissues. Strategies to improve the therapeutic ratio include employing image-guided intensity-modulated radiation therapy (IG-IMRT), protons, heavy ions, and molecular targeting of DNA repair pathways [1].
The Scientist's Toolkit: Essential Research Reagents and Methodologies
Table 3: Key Research Reagents and Methods for TI Determination
| Reagent/Method | Function in TI Research | Application Context |
|---|---|---|
| In Vivo Animal Models | Determination of LD₅₀ and ED₅₀ | Preclinical safety assessment in at least two mammalian species |
| Cell-Based Cytotoxicity Assays | In vitro assessment of therapeutic and toxic concentrations | High-throughput screening during early drug discovery |
| Liquid Chromatography-Mass Spectrometry (LC-MS/MS) | Precise quantification of drug concentrations in biological matrices | Pharmacokinetic studies and therapeutic drug monitoring |
| Population PK/PD Modeling Software | Quantitative analysis of exposure-response relationships | Clinical trial data analysis and dose regimen optimization |
| Flow Cytometry | Cellular kinetics analysis for cell-based therapies | CAR-T cell persistence and activation monitoring |
| Cytokine Detection Assays | Quantification of inflammatory mediators | CRS risk assessment for immunotherapies |
| Genomic Sequencing Platforms | Identification of pharmacogenetic variants affecting drug metabolism | Personalized dosing strategies for NTIDs |
| Bioanalytical Method Validation Kits | Ensuring accuracy, precision, and reproducibility of concentration measurements | GLP-complinical preclinical and clinical studies |
The therapeutic index remains a fundamental concept in pharmacology and drug development, providing a critical quantitative framework for assessing drug safety. The distinction between high and low TI drugs has profound implications for clinical practice, regulatory standards, and patient safety. Drugs with a narrow therapeutic index require sophisticated management strategies including therapeutic drug monitoring, careful dose titration, and consideration of individual patient factors that may influence drug disposition and response.
As drug development advances into novel modalities like engineered cell therapies, the traditional concepts of therapeutic index are being adapted to address increasingly complex pharmacological relationships. Nevertheless, the fundamental principle remains unchanged: optimizing the balance between efficacy and toxicity is paramount to developing and utilizing safe, effective therapeutics. Future directions in TI research will likely focus on personalized approaches that account for genetic, environmental, and disease-specific factors to maximize therapeutic benefit while minimizing risk for all patients.
The therapeutic index (TI) is a quantitative measurement of the relative safety of a drug, providing a critical assessment of the benefit-to-risk ratio for clinical use [1]. It is a comparison of the amount of a therapeutic agent that causes toxicity to the amount that causes the desired therapeutic effect [1]. Classically, the TI is calculated as the ratio of the dose that produces a toxic effect in 50% of the population (TD₅₀) to the dose that produces an effective response in 50% of the population (ED₅₀), expressed as TI = TD₅₀ / ED₅₀ [5]. In early preclinical animal studies, the lethal dose for 50% of the population (LD₅₀) is sometimes used in place of the TD₅₀ [1] [5].
The therapeutic window, sometimes called the safety window, refers to the range of plasma drug concentrations or doses between the minimum level required to achieve a clinical efficacy (the minimum effective concentration) and the maximum level at which unacceptable side-effects or toxicity begin to manifest [19] [1]. This window represents the target concentration range for optimizing individual dosage regimens, aiming for the greatest therapeutic benefit without resulting in unacceptable adverse effects [1]. For drugs with a narrow therapeutic range, there is little difference between toxic and therapeutic doses, making dosage adjustment critical and often guided by therapeutic drug monitoring (TDM) protocols [1] [20].
Table 1: Key Terms in Therapeutic Index and Window Analysis
| Term | Abbreviation | Definition |
|---|---|---|
| Effective Dose | ED₅₀ | The dose that produces a therapeutic or biological response in 50% of the population [1]. |
| Toxic Dose | TD₅₀ | The dose at which toxicity occurs in 50% of the population [1]. |
| Lethal Dose | LD₅₀ | The dose at which death occurs in 50% of the population (measured in animal studies) [1]. |
| Therapeutic Index | TI | A quantitative measure of a drug's relative safety, calculated as TD₅₀/ED₅₀ or LD₅₀/ED₅₀ [1] [5]. |
| Therapeutic Window | - | The range of plasma drug concentrations between the minimum effective concentration and the maximum tolerated concentration [19] [1]. |
| Protective Index | PI | An alternative safety measure calculated as TD₅₀/ED₅₀, which is the inverse of the efficacy-based therapeutic index [1]. |
Quantitative Calculations and Interpretations
Types of Therapeutic Indices
The calculation and interpretation of the therapeutic index can be approached from two primary perspectives, safety and efficacy, leading to two distinct types of indices [1]:
- Safety-Based Therapeutic Index (TIsafety): This is calculated as TIsafety = LD₅₀ / ED₅₀ [1]. A higher value for this index is preferable, as it indicates that a much larger dose is required to reach the lethal threshold compared to the dose needed for the therapeutic effect, implying a wider safety margin [1].
- Efficacy-Based Therapeutic Index (TIefficacy): This is calculated as TIefficacy = ED₅₀ / TD₅₀ [1]. Conversely, a lower value for this index is preferable. This indicates that the dose required to produce a toxic effect is much higher than the dose required for efficacy, again signifying a larger therapeutic window [1].
The Protective Index (PI = TD₅₀ / ED₅₀) is mathematically the inverse of the TIefficacy and is often a more practical measure of safety, as it uses the toxic dose rather than the lethal dose, which is more relevant for many clinical adverse effects [1].
Interpreting Therapeutic Indices in Practice
A high TI value (from the safety perspective) indicates a wide margin of safety, meaning the drug can be administered at doses well above the ED₅₀ without significant risk of lethal toxicity [1]. A low TI indicates a narrow margin of safety, where the effective and toxic doses are close together, necessitating careful dose individualization and monitoring [1].
Table 2: Representative Therapeutic Indices of Various Substances
| Drug / Substance | Therapeutic Index (Approximate) | Clinical Implications |
|---|---|---|
| Remifentanil | 33,000:1 [1] | Very wide safety margin; considered very forgiving. |
| Diazepam | 100:1 [1] | Less forgiving safety margin than remifentanil. |
| Morphine | 70:1 [1] | Requires careful dosing due to moderate safety margin. |
| Cocaine | 15:1 [1] | Low safety margin; high risk of toxicity. |
| Ethanol | 10:1 [1] | Narrow safety margin; risk of acute poisoning. |
| Paracetamol (Acetaminophen) | 10:1 [1] | Narrow safety margin; overdose can cause severe hepatotoxicity. |
| Digoxin | 2:1 [1] | Very narrow therapeutic range; requires therapeutic drug monitoring. |
Methodologies: Relating Blood Concentration to Clinical Effect
Experimental Protocol for Determining Dose-Response
The following methodology outlines the key steps for establishing the dose-response and toxicity relationships necessary for calculating the therapeutic index in a preclinical setting.
- Objective: To determine the ED₅₀ and TD₅₀ (or LD₅₀) of a novel drug candidate in an animal model to calculate its therapeutic index and establish an initial therapeutic window.
- Materials:
- Test Compound: The drug substance of interest, purified and solubilized in an appropriate vehicle.
- Animal Model: Typically rodents (e.g., Sprague-Dawley rats, CD-1 mice) of a defined strain, age, and weight range. Animals are randomly assigned to groups.
- Dosing Equipment: Calibrated syringes, gavage needles for oral administration, or micro-infusion pumps for intravenous delivery.
- Efficacy Assay Kit: Specific reagents and equipment to quantitatively measure the pharmacological response (e.g., ELISA kits for biomarker analysis, mechanical/thermal pain stimulus tools for analgesics).
- Clinical Pathology Analyzer: Automated hematology and clinical chemistry analyzer to assess biomarkers of organ toxicity (e.g., ALT, AST, creatinine, BUN).
- Procedure:
- Study Design: A minimum of five dose groups and a vehicle control group are established (n=10-20 animals per group). Doses are selected based on preliminary range-finding studies to bracket the anticipated effective and toxic doses.
- Dosing: The test compound is administered according to a predefined schedule (e.g., single dose, once-daily for 7 days) via the intended clinical route (oral, intravenous, etc.).
- Efficacy Assessment (for ED₅₀): At a predetermined time post-dose (Tₘₐₓ), the pharmacological effect is quantitatively measured for each animal. For example, in an analgesic study, the percentage reduction in pain response relative to controls is calculated.
- Toxicity Assessment (for TD₅₀/LD₅₀): Animals are monitored for signs of overt toxicity, morbidity, or mortality for a defined period (e.g., 14 days). Body weight, food consumption, and clinical observations are recorded daily. At the end of the observation period, blood samples are collected for clinical chemistry, and key organs are harvested for histopathological examination.
- Data Analysis: The quantitative efficacy data and the incidence of a predefined toxic event (or death) are recorded for each dose group. The ED₅₀ and TD₅₀/LD₅₀ values are calculated using non-linear regression analysis (Probit analysis or log-dose vs. response curve fitting) using statistical software (e.g., GraphPad Prism, SAS).
- Calculation: The therapeutic index is calculated as TI = TD₅₀ / ED₅₀ (or LD₅₀ / ED₅₀).
Clinical Protocol for Therapeutic Drug Monitoring (TDM)
In clinical practice, the relationship between blood concentration and effect is managed through TDM, which is the clinical practice of measuring specific drugs at designated intervals to maintain a constant concentration in a patient's bloodstream [20].
- Objective: To individualize the dosage regimen of a drug with a narrow therapeutic window to optimize clinical efficacy and minimize the risk of adverse effects.
- Indications for TDM: TDM is used for drugs with a narrow therapeutic range, marked pharmacokinetic variability, medications for which target concentrations are difficult to monitor, and drugs known to cause therapeutic and adverse effects [20]. It is particularly critical for drugs like digoxin, lithium, aminoglycosides, cyclosporine, and phenytoin [1] [20].
- Procedure:
- Initial Dosing: An initial dosage regimen is determined based on the patient's clinical condition, age, weight, organ function (especially hepatic and renal), and concomitant drug therapy [20].
- Blood Sampling: A blood sample (plasma or serum) is drawn at a precise time, typically at steady-state (after 4-5 half-lives of the drug) and at the correct time point in relation to the dosing interval (e.g., trough concentration just before the next dose) [20].
- Sample Analysis: The drug concentration in the blood sample is measured using validated analytical techniques, most commonly immunoassays or chromatographic methods like High-Performance Liquid Chromatography (HPLC) coupled with mass spectrometry (LC-MS/MS) for high specificity and sensitivity.
- Interpretation and Dosage Adjustment: The measured concentration is compared to the established therapeutic range. A clinical pharmacist or pharmacologist uses pharmacokinetic principles to interpret the level in the context of the sampling time, dosage history, and patient's clinical response. The dosage regimen is then adjusted accordingly to bring and maintain the drug concentration within the target therapeutic window [20].
The Scientist's Toolkit: Essential Reagents and Materials
Successful research and clinical monitoring in this field rely on specific reagents and analytical tools. The following table details key materials used in the experiments and practices described.
Table 3: Essential Research Reagent Solutions for Therapeutic Index and TDM Studies
| Item / Reagent | Function and Application in Research |
|---|---|
| LC-MS/MS System | The gold-standard analytical instrument for quantifying drug concentrations in biological matrices (e.g., plasma) with high specificity and sensitivity, essential for TDM and pharmacokinetic studies [20]. |
| Validated Drug Assay Kits | Ready-to-use immunoassay kits (e.g., ELISA) for specific drugs like digoxin or cyclosporine; provide a high-throughput, though sometimes less specific, alternative to chromatography for routine TDM [20]. |
| Pharmacokinetic Modeling Software | Software tools (e.g., WinNonlin, NONMEM) used to model concentration-time data, calculate key parameters (half-life, clearance), and simulate dosage regimens to predict and optimize drug exposure. |
| Clinical Chemistry & Hematology Analyzers | Automated systems to measure biomarkers of organ function and toxicity (e.g., liver enzymes, renal function markers) in preclinical and clinical studies, critical for defining the toxic dose (TD₅₀) [20]. |
| Reference Standard (Drug Substance) | A highly purified and well-characterized sample of the drug, essential for calibrating analytical instruments and ensuring the accuracy and precision of concentration measurements. |
| Blank Biological Matrix | Drug-free plasma or serum from the relevant species, used to prepare calibration standards and quality control samples for bioanalytical method development and validation. |
Critical Considerations and Diagram of Drug Fate and Effect
In modern drug development, the therapeutic index is increasingly calculated based on plasma exposure levels (e.g., Area Under the Curve - AUC) rather than administered dose, as it is the tissue exposure to the drug over time that drives both pharmacological and toxicological effects [1]. This accounts for inter-individual variability in drug absorption, distribution, metabolism, and excretion. For toxicities that manifest after multiple doses, the TI should be calculated using exposure at steady-state [1].
Historical Context and Evolution of TI in Pharmacology
The therapeutic index (TI) is a cornerstone concept in pharmacology, providing a quantitative measure of a drug's safety and relative efficacy. This whitepaper traces the historical context and evolution of TI from its origins in preclinical animal models to its current application in modern, exposure-based drug development. We detail the fundamental calculation methodologies, explore the critical distinction between safety-based and efficacy-based indices, and examine the regulatory and clinical challenges posed by narrow therapeutic index drugs. Framed within broader research on TI's role in pharmacotherapy, this guide serves as a technical resource for researchers, scientists, and drug development professionals, integrating quantitative data, experimental protocols, and visualizations to elucidate this pivotal pharmacological principle.
Core Concepts and Calculation
The therapeutic index (TI), also referred to as the therapeutic ratio, is a quantitative measurement of the relative safety of a drug [1]. It is a comparison of the amount of a therapeutic agent that causes toxicity to the amount that causes the desired therapeutic effect [1]. The primary purpose of the TI is to provide a comparative safety margin, helping clinicians and researchers understand the dose range in which a drug is effective without causing unacceptable adverse events [3].
The related concept of the therapeutic window (or safety window) describes the range of doses optimized between efficacy and toxicity, aiming to achieve the greatest therapeutic benefit without resulting in unacceptable side-effects [1]. In clinical practice, this window is often defined by the range of drug concentrations in the blood between the minimum effective concentration (MEC) and the minimum toxic concentration (MTC) [21].
Fundamental Calculations
Classically, the TI is calculated using median doses obtained from population dose-response curves.
- Standard Therapeutic Index (TI): The ratio of the dose that produces a toxic response in 50% of the population (TD50) to the dose that produces a therapeutic response in 50% of the population (ED50) [5] [4].
- Formula: TI = TD50 / ED50
- Lethal Dose Alternative: In preclinical animal studies, the TI may be calculated using the lethal dose for 50% of the population (LD50) [1] [15].
- Formula: TIsafety = LD50 / ED50
- Efficacy-based Therapeutic Index (TIefficacy): This formulation compares the effective dose to the toxic dose [1].
- Formula: TIefficacy = ED50 / TD50
- A lower TIefficacy indicates a larger therapeutic window.
- Protective Index (PI): Similar to the safety-based TI, it uses TD50 and ED50 [1].
- Formula: PI = TD50 / ED50
- It is the inverse of TIefficacy (PI = 1 / TIefficacy).
Interpreting the Therapeutic Index
The numerical value of the TI has direct implications for drug safety and clinical use.
- High TI: A drug with a high TI (e.g., 100 or 1000) has a wide margin of safety [1] [21]. There is a large difference between the dose required for efficacy and the dose that causes toxicity. This generally indicates a safer drug, where small dosage variations are unlikely to cause harm. Examples include penicillin and diazepam [1] [3].
- Low/Narrow TI: A drug with a low or narrow TI (e.g., less than 2-3) has a small safety margin [15] [4]. There is only a small difference between therapeutic and toxic doses. For these drugs, small increases in dose can result in toxic effects, while small decreases can lead to therapeutic failure. Examples include warfarin, digoxin, and lithium [1] [3] [4]. Drugs with a narrow TI are also known as narrow therapeutic index drugs (NTIDs) or critical dose drugs [15].
Historical Evolution and Modern Approaches
The concept and application of the therapeutic index have evolved significantly from its origins in basic toxicology to a more nuanced, exposure-driven parameter in contemporary drug development.
Historical Preclinical Foundation
The earliest determinations of TI were frequently performed in animals and utilized mortality as the primary toxicity endpoint [1]. The LD50 (median lethal dose) was a standard metric, and the TI was calculated as LD50 / ED50 [1] [15]. This "academic" definition was straightforward for preclinical experiments but opened the door to variable interpretations in clinical practice, where severe toxicities often occur at sublethal doses [1] [15].
Shift to Clinical and Exposure-Based Paradigms
Modern pharmacology has moved away from reliance on lethal doses toward more sophisticated and clinically relevant endpoints.
- From Dose to Exposure: A critical advancement has been the recognition that it is the exposure of a given tissue to a drug (i.e., drug concentration over time), rather than the administered dose, that drives both pharmacological and toxicological effects [1]. Factors such as inter-individual variability in metabolism, drug-drug interactions (DDIs), body weight, and environmental factors can lead to marked differences in exposure at the same dose [1].
- Plasma Exposure Levels: In modern drug development settings, TI is typically calculated based on plasma exposure levels, such as the maximum plasma concentration (Cmax) and the area under the plasma concentration-time curve (AUC) [1] [15]. This allows for a more accurate and personalized assessment of the benefit-risk profile.
- Steady-State Considerations: To account for delays between exposure and toxicity, the TI for toxicities that occur after multiple dose administrations should be calculated using exposure to the drug at steady state rather than after a single dose [1].
Regulatory Definitions and Refinements
Regulatory bodies have refined the definition of NTIDs to guide clinical practice and generic drug approval. The U.S. Food and Drug Administration (FDA) has proposed that a drug product can be considered an NTID if it meets criteria such as [15] [4]:
- There is less than a twofold difference in median LD50 and ED50 values, or in minimum toxic (MTC) and minimum effective concentrations (MEC).
- Safe and effective use requires careful titration and patient monitoring.
- Small differences in dose or concentration lead to serious therapeutic failures and/or adverse drug reactions that are life-threatening.
This evolution in thinking underscores that TI is not just a static number but a dynamic parameter whose interpretation must consider the nature of the pharmacological and toxicological endpoints [1].
Quantitative Data and Drug Examples
The therapeutic index varies widely among pharmaceutical substances, even within related therapeutic classes. The table below summarizes the TI for a range of drugs, illustrating the spectrum from very safe to those requiring extreme caution.
Table 1: Therapeutic Indices of Selected Drugs
| Drug | Therapeutic Index (Approximate) | Clinical Context and Monitoring |
|---|---|---|
| Remifentanil [1] | 33,000 : 1 | An opioid with an exceptionally high TI, indicating a very wide margin of safety. |
| Diazepam [1] | 100 : 1 | A benzodiazepine with a relatively high TI, but still requires careful dosing. |
| Morphine [1] | 70 : 1 | An opioid analgesic; dosage must be individualized to balance pain control and respiratory depression. |
| Penicillin [3] | High (Wide TI) | Considered a very safe drug; toxic doses are much higher than effective doses. |
| Cocaine [1] | 15 : 1 | A stimulant and local anesthetic with a low safety margin. |
| Ethanol [1] | 10 : 1 | A sedative with a narrow TI; toxic effects can occur at doses not much higher than those causing intoxication. |
| Paracetamol/Acetaminophen [1] | 10 : 1 | Common analgesic; overdose can cause severe liver damage. |
| Digoxin [1] | 2 : 1 | A cardiac glycoside with a very narrow TI; requires therapeutic drug monitoring (TDM). |
| Warfarin [3] [4] | Narrow TI | An anticoagulant where small dosage changes can lead to thrombosis or hemorrhage; requires frequent INR monitoring. |
| Lithium [1] [3] | Narrow TI | Used for psychiatric disorders; requires TDM due to its narrow therapeutic range. |
| Theophylline [1] [3] | Narrow TI | A bronchodilator; TDM is used to maintain levels within the therapeutic window. |
| Gentamicin [1] [3] | Narrow TI | An antibiotic; TDM is essential to ensure efficacy and avoid nephro- and ototoxicity. |
Methodologies and Protocols
Determining the therapeutic index involves a series of structured preclinical and clinical experiments. The following protocols outline the core methodologies for establishing key parameters.
Preclinical Protocol: Determining ED50 and LD50/TD50
Objective: To quantitatively determine the median effective dose (ED50) and median toxic/lethal dose (TD50/LD50) for a novel chemical entity in an animal model of disease.
Workflow:
- Animal Model Selection: Select a species and strain appropriate for the disease target (e.g., rodent model of epilepsy for an anticonvulsant drug).
- Dose Formulation: Prepare the test article in a vehicle suitable for the chosen route of administration (e.g., oral gavage, intravenous injection).
- Dose-Ranging Study: Conduct an initial dose-ranging study to identify the approximate range of doses that cause no effect, the desired therapeutic effect, and toxicity/mortality.
- Definitive Dose-Response Study:
- Groups: Randomly assign animals to 5-8 dose groups, plus a vehicle control group (n=10-20 per group).
- Dosing: Administer a single dose of the test article or vehicle to each group.
- Therapeutic Effect Measurement (for ED50): At a predetermined time post-dose, apply a standardized stimulus or measurement to quantify the drug's effect (e.g., measure pain threshold in an analgesic model). Record the proportion of animals in each group showing a positive therapeutic response.
- Toxicity/Mortality Observation (for TD50/LD50): Observe animals for a defined period (e.g., 24-72 hours) for signs of severe toxicity or mortality. Record the proportion of animals in each group showing the toxic endpoint.
- Data Analysis:
- Plot the dose versus the percentage of animals responding (for both effect and toxicity) on a logarithmic scale.
- Fit the data points with a sigmoidal curve (e.g., using log-probit analysis or non-linear regression).
- ED50 Calculation: From the efficacy dose-response curve, determine the dose that produces the therapeutic effect in 50% of the animals.
- TD50/LD50 Calculation: From the toxicity dose-response curve, determine the dose that produces toxicity or death in 50% of the animals.
- TI Calculation: Calculate the preclinical TI as TD50 / ED50 or LD50 / ED50.
Clinical Protocol: Bioequivalence Study for Narrow Therapeutic Index Drugs
Objective: To demonstrate that a generic drug product is bioequivalent to a reference (brand-name) NTI drug, ensuring that switching between products does not lead to therapeutic failure or toxicity.
Workflow:
- Study Design: A full-replicate, crossover design is recommended by regulatory agencies like the FDA [4]. In this design, the same subject receives both the reference product (R) and the test product (T) twice, in a randomized sequence (e.g., TRTR, RTRT).
- Subject Selection: Enroll healthy volunteers or patients (as appropriate) who meet strict inclusion/exclusion criteria.
- Dosing and Sampling: After an overnight fast, subjects receive a single dose of the assigned product. Blood samples are collected at predetermined intervals over multiple half-lives to characterize the plasma concentration-time profile.
- Bioanalytical Analysis: Measure the concentration of the active drug in all plasma samples using a validated method (e.g., LC-MS/MS).
- Pharmacokinetic Analysis: Calculate key PK parameters for each subject and period:
- AUC(0-t): Area under the plasma concentration-time curve from zero to the last measurable time point.
- AUC(0-∞): Area under the plasma concentration-time curve from zero to infinity.
- Cmax: Maximum observed plasma concentration.
- Statistical Analysis for Bioequivalence (BE): For NTI drugs, the FDA employs a reference-scaled average bioequivalence approach with tightened limits [4].
- The 90% confidence interval (CI) for the ratio of the geometric means (Test/Reference) for AUC and Cmax must fall within a narrowed range, typically 90.00% - 111.11% (when within-subject variability is low), instead of the standard 80.00% - 125.00% [4].
- Additionally, the within-subject variability of the test product must not be significantly greater than that of the reference product.
The Scientist's Toolkit: Research Reagents and Materials
Table 2: Essential Materials for Therapeutic Index Research
| Reagent / Material | Function in TI Research |
|---|---|
| In Vivo Disease Models (e.g., transgenic mice, induced-pathology models) | Provides a biological system to evaluate the therapeutic effect (ED50) of a compound in a physiologically relevant context. |
| Test Article/Investigational Drug | The compound whose safety and efficacy are being quantified; must be of high and defined purity. |
| Vehicle for Formulation (e.g., saline, carboxymethyl cellulose, DMSO) | A physiologically compatible solvent or suspension agent to deliver the test article to the animal. |
| Analytical Standards (Pure drug substance, metabolites) | Essential for developing and validating bioanalytical methods (e.g., LC-MS/MS) to accurately measure drug concentrations in plasma and tissues for exposure-based TI calculations. |
| Cell-Based Assays for Cytotoxicity (e.g., MTT, LDH assays) | Used for initial, high-throughput screening of compound toxicity (TD50) in vitro before proceeding to more complex animal studies. |
| Validated Pharmacodynamic (PD) Biomarker Assay (e.g., ELISA, enzymatic activity assay) | A tool to quantitatively measure the drug's biological effect in both preclinical and clinical settings, helping to define the therapeutic response. |
Regulatory and Clinical Implications
The therapeutic index, particularly its narrow manifestation, has profound implications for drug regulation and clinical practice.
Narrow Therapeutic Index Drugs (NTIDs) in Clinical Practice
Drugs with a narrow TI present unique clinical challenges. Their use requires careful individualization of dosage, as small changes in dose or blood concentration can lead to serious therapeutic failure or severe adverse events [15]. For example, with warfarin, an INR below 2 increases the risk of thrombosis, while an INR above 3 increases the risk of hemorrhage [4].
Consequently, the standard of care for most NTIDs involves therapeutic drug monitoring (TDM). TDM involves regularly measuring drug concentrations in a patient's blood to ensure they remain within the therapeutic window [1] [3]. This is critical for drugs like lithium, gentamicin, and digoxin [1] [3]. Furthermore, patient factors such as age, comorbidities, and genetic polymorphisms (e.g., in CYP2C9 and VKORC1 for warfarin) can significantly impact dose requirements and must be considered [15] [4].
Regulatory and Bioequivalence Considerations
The concept of NTI is crucial in the regulatory approval of generic drugs. For most drugs, a generic product is considered bioequivalent if the 90% CI for the ratio of its AUC and Cmax to the reference product falls within 80-125% [15]. However, for NTIDs, this standard is considered too wide.
Regulatory authorities like the FDA and EMA recommend more stringent bioequivalence criteria for NTIDs to minimize the risk of patients being switched to a product that could be subtherapeutic or toxic [15] [4]. As detailed in the experimental protocol section, this often involves tightened BE limits (90-111%) and the use of reference-scaled average bioequivalence studies with a full-replicate design to closely compare the variability of the test and reference products [4]. This ensures that generic versions of NTIDs are virtually identical in their rate and extent of absorption to their brand-name counterparts.
Calculating and Applying the Therapeutic Index in Research and Development
The Therapeutic Index (TI) is a fundamental quantitative measurement in pharmacology used to evaluate the relative safety of a drug. It is a ratio that compares the dose of a drug required to elicit a toxic effect to the dose needed to produce the desired therapeutic effect [5] [1]. This comparison provides a crucial margin of safety, indicating how selective a drug is in producing its intended effect versus causing adverse reactions [6].
The classical formula for calculating the therapeutic index is: TI = TD~50~ / ED~50~ Where:
- TD~50~ (Median Toxic Dose) is the dose that produces a toxic effect in 50% of the population.
- ED~50~ (Median Effective Dose) is the dose that produces a therapeutic effect in 50% of the population [5] [1] [22].
In pre-clinical animal studies, the LD~50~ (Median Lethal Dose), or the dose that is lethal in 50% of the test population, is sometimes used in place of the TD~50~ [6] [15]. The TI is a cornerstone concept in both drug development and clinical practice, guiding dosage decisions and informing regulatory standards for drug approval [15] [4].
Core Components of the Calculation
The Median Effective Dose (ED~50~)
The ED~50~ is defined as the dose at which 50% of individuals exhibit a specified quantal, or "all-or-none," therapeutic effect [6] [11]. This parameter is derived from a quantal dose-response curve, which plots the percentage of a population responding against the drug dose [6]. The ED~50~ is a measure of a drug's potency; a lower ED~50~ indicates a more potent drug [11]. In clinical practice, the ED~50~ serves as a critical starting point for clinicians when determining initial drug doses, though adjustments are almost always necessary based on individual patient factors [11].
The Median Toxic Dose (TD~50~) and Lethal Dose (LD~50~)
The TD~50~ is the dose required to produce a particular toxic effect in 50% of subjects [6]. This mirrors the ED~50~ but uses a defined adverse event as the endpoint. In pre-clinical animal studies, toxicity is often taken to its extreme, leading to the use of the LD~50~, which is the dose that causes death in 50% of the test population [6]. The LD~50~ was first introduced by J.W. Trevan in 1927 as a more reliable metric than the highly variable "minimal lethal dose" [6]. It is crucial to note that the nature of the toxic effect (e.g., minor side effect vs. lethality) dramatically influences the calculated TI and its interpretation.
Deriving the Index from Dose-Response Curves
The ED~50~, TD~50~, and LD~50~ are all determined experimentally from cumulative quantal dose-response curves [6]. In an ideal scenario, the dose-response curves for efficacy and toxicity are parallel and widely separated. The TI is calculated by reading the respective doses from these curves and applying the standard formula [6] [14]. The following diagram illustrates the relationship between these curves and the derived values.
Experimental Protocols for TI Determination
Pre-Clinical In Vivo Protocol for TI Estimation
This protocol outlines the standard procedure for estimating the Therapeutic Index in animal models, a critical step in pre-clinical drug development [6].
- Objective: To determine the ED~50~ and LD~50~ of a novel drug candidate in a rodent model to calculate its pre-clinical Therapeutic Index.
- Test System: Laboratory-bred strain (e.g., Sprague-Dawley rats or CD-1 mice), typically 8-12 weeks old, with equal gender distribution.
Materials:
- Test compound
- Vehicle control
- Syringes and needles for injection
- Behavioral or functional test equipment (e.g., hot plate for analgesics)
- Clinical observation sheets
Procedure:
- Dose Range-Finding: Conduct a preliminary study with a small number of animals (e.g., n=3 per dose) across a wide dose range (e.g., 10, 100, 1000 mg/kg) to estimate the approximate range of efficacy and lethality.
- Main Study - Group Allocation: Based on range-finding, select at least 4-5 logarithmically spaced doses. Assign animals randomly to dose groups (n=8-10 is common).
- Dosing: Administer the drug via the intended clinical route (e.g., oral gavage, intraperitoneal injection).
- Efficacy Assessment (ED~50~):
- At a predetermined time post-dose (T~max~), expose animals to a test measuring the desired therapeutic endpoint (e.g., time to pain response).
- A positive "quantal" effect is recorded if the animal's response meets a pre-defined criterion (e.g., ≥50% increase in response latency).
- Record the proportion of animals in each dose group showing a positive therapeutic effect.
- Toxicity/Lethality Assessment (LD~50~):
- Observe animals continuously for the first 4 hours post-dose and then periodically for 14 days.
- Record specific signs of toxicity (e.g., convulsions, paralysis) and mortality.
- The endpoint for LD~50~ is death within the 14-day observation period.
- Data Analysis:
- Plot two separate quantal dose-response curves: one for the therapeutic effect and one for lethality.
- Use probit analysis or non-linear regression (logistic function) to fit sigmoidal curves to the data.
- From the fitted curves, calculate the ED~50~ and LD~50~ values and their 95% confidence intervals.
- Calculate the Therapeutic Index as TI = LD~50~ / ED~50~.
Clinical TI and Therapeutic Window Determination
In clinical practice, the TI is often redefined using parameters more relevant to humans, moving from doses (ED~50~/TD~50~) to drug concentrations in the blood (MEC/MTC) [23] [15] [4]. This reflects the understanding that drug effects correlate better with plasma concentration than with administered dose.
- Objective: To define the therapeutic window for an approved drug in a patient population.
- Study Design: Population pharmacokinetic/pharmacodynamic (PopPK/PD) analysis of data from Phase II/III clinical trials, often supplemented with therapeutic drug monitoring (TDM) data from post-marketing surveillance.
- Key Parameters:
- Minimum Effective Concentration (MEC): The lowest plasma concentration at which the drug's therapeutic effect is observed.
- Minimum Toxic Concentration (MTC): The plasma concentration at which unacceptable adverse effects begin to occur.
- Procedure:
- Data Collection: Collect dense PK/PD data from controlled trials and sparse TDM data from clinical practice.
- Efficacy Endpoint Analysis: Model the relationship between drug exposure (e.g., trough concentration, AUC) and a primary efficacy endpoint (e.g., prevention of graft rejection for immunosuppressants) [23].
- Toxicity Endpoint Analysis: Model the relationship between the same exposure metrics and the incidence of a key adverse drug reaction.
- Determine Concentration Ranges: Establish the population-average concentration range where most patients experience efficacy with minimal toxicity. The clinical TI is sometimes expressed as TI = MTC / MEC [4].
- Define the Therapeutic Window: The range of plasma concentrations between the MEC and the MTC is the therapeutic window, which provides direct guidance for dosing and TDM in patients [6] [14].
Data Presentation and Analysis
Therapeutic Indices of Common Drugs
The therapeutic index varies dramatically among different drug classes. The table below summarizes the TI for several well-known drugs, illustrating the wide spectrum of drug safety margins [1].
| Drug | Therapeutic Index (TI) | Clinical Implications |
|---|---|---|
| Remifentanil | 33,000 : 1 | Extremely wide safety margin; considered very safe within its intended use. |
| Diazepam | 100 : 1 | Relatively wide safety margin. |
| Morphine | 70 : 1 | Moderate safety margin; requires careful dosing. |
| Cocaine | 15 : 1 | Narrow safety margin; high risk of toxicity. |
| Ethanol | 10 : 1 | Narrow safety margin. |
| Paracetamol (Acetaminophen) | 10 : 1 | Narrow safety margin; overdose can cause severe liver damage. |
| Digoxin | 2 : 1 | Very narrow safety margin; requires therapeutic drug monitoring. |
The Scientist's Toolkit: Key Reagents and Materials
Successful determination of the therapeutic index relies on specific research tools and reagents. The following table details essential items used in the experimental protocols described above.
| Item | Function in TI Research |
|---|---|
| Laboratory Animals (e.g., Rodents) | In vivo test system for determining ED~50~ and LD~50~; chosen based on genetic uniformity and physiological relevance [6]. |
| Test Compound & Vehicle | The investigational drug and the solution used to dissolve/suspend it (e.g., saline, DMSO, carboxymethyl cellulose) for accurate dosing. |
| Behavioral Apparatus (e.g., Hot Plate, Rotarod) | Equipment to provide a standardized, quantal measure of the drug's therapeutic efficacy (e.g., analgesia, sedation) [6]. |
| Clinical Chemistry & Hematology Analyzers | Used to assess organ-specific toxicities (e.g., liver enzymes, renal function) as endpoints for TD~50~, beyond overt lethality. |
| LC-MS/MS (Liquid Chromatography-Tandem Mass Spectrometry) | Gold-standard analytical technique for measuring drug concentrations in plasma for clinical TI and therapeutic window studies [23]. |
| Probit Analysis Software | Statistical software package used to fit sigmoidal curves to quantal dose-response data and accurately calculate ED~50~, LD~50~, and their confidence intervals [6]. |
Regulatory and Clinical Significance
Narrow Therapeutic Index (NTI) Drugs
Drugs with a low TI are classified as Narrow Therapeutic Index (NTI) drugs. Regulatory bodies like the US FDA define NTI drugs as those where there is less than a 2-fold difference in the LD~50~ and ED~50~ (or MTC and MEC), and whose safe use requires careful titration and patient monitoring [15] [4]. For these drugs, small changes in dose or blood concentration can lead to serious therapeutic failure or severe, life-threatening adverse drug reactions [15]. The following diagram illustrates the critical differences between drugs with a wide and narrow TI.
Examples of NTI drugs include warfarin, lithium, digoxin, phenytoin, and theophylline [11] [14]. For instance, cyclosporine, an immunosuppressant, has a TI estimated between 2 and 3, placing it just at the threshold of being an NTI drug [23].
Impact on Drug Development and Regulation
The TI, particularly the classification of a drug as NTI, has direct consequences on regulatory policy, especially for the approval of generic drugs [15] [4].
- Standard Bioequivalence (BE): For most drugs, generic versions must demonstrate that the 90% confidence interval for the ratio of their geometric mean exposure (AUC and C~max~) to the brand-name product falls within 80-125% [15].
- Stringent BE for NTI Drugs: Due to the high risk associated with small variations in NTI drugs, regulatory authorities like the FDA have proposed more stringent standards. This may involve narrowing the BE limits (e.g., from 80-125% to 90-111%) or using a reference-scaled average bioequivalence approach that accounts for the low within-subject variability characteristic of NTI drugs [15] [4].
- Therapeutic Drug Monitoring (TDM): In clinical practice, NTI drugs almost universally require TDM, where a patient's drug plasma levels are measured to ensure they remain within the therapeutic window, thus maximizing efficacy and minimizing toxicity [1] [15].
Limitations and Advanced Considerations
While the TI = TD~50~/ED~50~ is a valuable initial metric, it has significant limitations that scientists and clinicians must consider.
- Reliance on Animal Data (LD~50~): The classical TI often uses LD~50~ from animal studies, which may not accurately predict human toxicity risks from sublethal adverse effects [5] [6].
- Ignores Slope of Curves: The TI is a single ratio and does not account for the slopes of the dose-response curves for efficacy and toxicity. If the curves are not parallel, a drug with a high TI could still produce toxicity in a subset of patients at doses effective for the majority [6] [14].
- Idiosyncratic Reactions: The TI cannot predict unpredictable, non-dose-related adverse drug reactions, such as allergic reactions or idiosyncratic toxicities [5] [6].
- Individual Variability: The TI is a population-average measure. It does not capture inter-individual variability due to genetics (pharmacogenomics), age, organ function, or drug interactions, which can drastically alter a drug's effective and toxic doses for a single patient [5] [15] [4].
To address these limitations, more sophisticated safety metrics have been proposed, such as the Certain Safety Factor (CSF = TD~1~/ED~99~), which uses the doses at which a drug is effective in 99% of the population and toxic in 1% of the population, providing a more conservative and clinically relevant safety estimate [14]. Modern drug development increasingly relies on exposure-based TI calculations (using AUC and C~max~) and PK/PD modeling to create a more robust and predictive safety profile for new drug candidates [1] [15].
The therapeutic index (TI) is a quantitative measurement of the relative safety of a drug, providing a critical ratio that compares the drug's exposure level that causes toxicity to the exposure level that produces the desired therapeutic effect [1]. This concept is a cornerstone of drug safety and is indispensable during clinical trials and the post-market monitoring phase [3]. For researchers and drug development professionals, understanding and accurately calculating the TI is paramount for selecting viable drug candidates and optimizing their safety profiles. The TI serves as a key parameter in balancing the potential benefits of a drug with its risks, guiding dose selection for clinical studies and informing prescribing guidelines [2]. A drug with a high TI has a wide margin of safety, whereas a drug with a narrow therapeutic index (NTI) requires much more careful dosing and monitoring, as small changes in blood concentration can lead to adverse effects or therapeutic failure [3] [24].
Core Principles and Calculations
Fundamental Formulas and Terminology
Classically, the therapeutic index is calculated using median effective and toxic doses. In pre-clinical animal studies, the lethal dose (LD₅₀) might be used, while in clinical development, the toxic dose (TD₅₀) is more relevant [1] [5]. The most common formula for the safety-based therapeutic index is:
TI = TD₅₀ / ED₅₀
Where:
- TD₅₀ is the dose that produces a toxic effect in 50% of the population.
- ED₅₀ is the dose that produces the desired therapeutic effect in 50% of the population [3] [5].
An alternative calculation is the efficacy-based therapeutic index, expressed as TIₑᶠᶠᶦᶜᵃᶜʸ = ED₅₀ / TD₅₀. In this case, a lower value indicates a larger therapeutic window [1]. The inverse of this, TD₅₀/ED₅₀, is known as the protective index [1].
It is crucial to note that in modern drug development, the TI is increasingly calculated based on plasma exposure levels (e.g., AUC or Cmax) rather than administered dose, as exposure more accurately reflects the pharmacological and toxicological effects experienced by the patient [2] [1].
Visualizing the Therapeutic Index and Window
The following diagram illustrates the core concepts of the therapeutic index and its relationship to dose-response curves.
Computational and Experimental Methodologies
Pre-clinical In Vivo Protocol for TI Determination
This protocol outlines a standard method for determining the TI in animal models, a critical step in early drug development.
Objective: To determine the median effective dose (ED₅₀) and median toxic/lethal dose (TD₅₀/LD₅₀) for calculating the therapeutic index in a rodent model.
Materials and Reagents:
- Test Compound: The drug candidate of interest.
- Animal Model: Specific pathogen-free (SPF) rodents (e.g., Sprague-Dawley rats, strain and weight specified).
- Vehicle Solution: A physiologically compatible solvent (e.g., saline, 0.5% carboxymethylcellulose) for formulating the test compound.
- Dosing Equipment: Calibrated oral gavage needles or syringes for subcutaneous/intraperitoneal injection.
- Behavioral Observation Chambers: Equipment for monitoring animal response (e.g., rotarod for motor coordination, hot plate for analgesia).
- Clinical Chemistry Analyzer: For quantifying biomarkers of toxicity (e.g., plasma alanine aminotransferase (ALT) for hepatotoxicity).
- Statistical Analysis Software: Such as GraphPad Prism for probit or logit analysis of dose-response data.
Methodology:
- Study Design: Animals are randomly assigned to several dose groups (typically 5-8 groups) and a vehicle control group, with 8-12 animals per group. A wide range of doses is selected based on prior range-finding studies.
- Dosing and Efficacy Measurement:
- Animals are administered the test compound or vehicle according to the assigned group.
- At a predetermined time post-dose, the therapeutic response is measured. For an analgesic, this could be the percentage of animals in a group showing a significant increase in reaction time on a hot-plate test.
- The ED₅₀ is calculated as the dose at which 50% of the animals exhibit the positive therapeutic response.
- Toxicity Assessment:
- Animals are monitored for signs of toxicity (e.g., lethargy, labored breathing, neurological symptoms, weight loss) over a defined period, often 14 days.
- For lethality studies, the LD₅₀ is calculated as the dose that causes death in 50% of the animals over the observation period.
- For non-lethal toxicity, the TD₅₀ is calculated based on a defined toxic endpoint, such as a 10% reduction in body weight or a significant elevation in a serum toxicity biomarker.
- Data Analysis:
- Dose-response data for both efficacy and toxicity are plotted.
- A statistical model (e.g., probit analysis, sigmoidal dose-response curve fitting) is applied to the data to calculate the ED₅₀, TD₅₀, and/or LD₅₀ values and their confidence intervals.
- The TI is calculated as TI = LD₅₀ / ED₅₀ or TI = TD₅₀ / ED₅₀ [1] [5].
Advanced Computational Protocol: Thermodynamic Integration for Antibody Optimization
In modern biotherapeutic development, computational methods are used to predict and optimize the TI by enhancing efficacy (binding affinity). The following workflow details the use of Thermodynamic Integration (TI) to identify beneficial mutations for antibody affinity maturation, a key strategy for improving the therapeutic index.
Objective: To employ an optimized Thermodynamic Integration (TI) protocol for the accurate prediction of binding free energy changes (ΔΔG) resulting from antibody mutations, thereby identifying beneficial mutations that enhance affinity and potentially improve the therapeutic index [25].
Research Reagent Solutions:
| Item | Function in Protocol |
|---|---|
| Molecular Dynamics Software | Software platform (e.g., GROMACS, AMBER) for running simulations and free energy calculations. |
| Force Field | A set of parameters (e.g., CHARMM36, AMBER ff19SB) defining atomic interactions and energies within the simulated system. |
| Antibody-Antigen Complex Structure | Experimentally determined (e.g., via X-ray crystallography) or high-quality predicted starting structure (PDB file). |
| Explicit Solvent Model | Water molecules (e.g., TIP3P model) and ions to simulate a physiological environment in the simulation box. |
| Hamiltonian Replica Exchange (HRE) | An enhanced sampling algorithm that allows exchange between adjacent lambda (λ) windows to improve convergence. |
| Smooth Step Function | A weighting function applied to the λ-derivative of energy (dV/dL) to reduce inaccuracies from atomic clashes. |
Methodology:
- System Setup:
- The experimentally determined structure of the wild-type antibody-antigen complex is placed in a simulation box with explicit solvent molecules and ions. A common setting is a 6Å waterbox [25].
- Simulation and Alchemical Transformation:
- The system undergoes a series of steps to reach a stable state: energy minimization, heating from 100K to 298K, system relaxation, and equilibration [25].
- The production run uses Hamiltonian Replica Exchange MD (HREMD) with 12 lambda (λ) windows. The λ parameter controls the alchemical transformation, gradually mutating the selected wild-type residue to the target mutant residue over the simulation.
- The HREMD production run is conducted for 3 nanoseconds (ns) per λ window, a duration shown to provide a balance of accuracy and computational efficiency [25].
- Data Analysis and Free Energy Calculation:
- The generalized force (dV/dL) is collected from each λ window. Lambda windows with significant dV/dL deviation (e.g., >1 standard deviation from the mean) between the bound and unbound systems are excluded to improve accuracy [25].
- The binding free energy change (ΔΔG) is calculated by integrating the dV/dL over the λ pathway and applying the thermodynamic cycle. A negative ΔΔG indicates a mutation that improves binding affinity (beneficial).
- Validation:
- The protocol's performance is validated by its high correlation with experimental data (Pearson’s r ~0.74) and low error (RMSE ~1.05 kcal/mol) [25].
Practical Calculations and Data Presentation
Therapeutic Indices of Sample Drugs
The following table summarizes the therapeutic indices for a range of classic drugs, illustrating the vast spectrum of drug safety margins.
Table 1: Therapeutic Indices of Sample Drugs [1]
| Drug | Primary Use | Therapeutic Index (TI) | Clinical Implications |
|---|---|---|---|
| Remifentanil | Opioid analgesic | 33,000 : 1 | Extremely wide margin of safety; dose adjustments are less critical. |
| Diazepam | Sedative, muscle relaxant | 100 : 1 | Relatively safe, but overdose is possible and can cause significant sedation. |
| Morphine | Opioid analgesic | 70 : 1 | Requires careful titration for pain relief versus risk of respiratory depression. |
| Cocaine | Local anesthetic, stimulant | 15 : 1 | Narrow safety margin; high potential for toxicity with recreational use. |
| Ethanol | Sedative | 10 : 1 | Low TI; intoxication occurs at doses not much higher than those causing mild effects. |
| Paracetamol/Acetaminophen | Analgesic, antipyretic | 10 : 1 | Hepatotoxicity can occur with only a small multiple of the therapeutic dose. |
| Digoxin | Heart failure, arrhythmia | 2 : 1 | Very narrow TI; requires therapeutic drug monitoring (TDM) to avoid severe toxicity. |
Drugs with a Narrow Therapeutic Index (NTI)
Several drugs are clinically classified as NTI drugs, meaning they have a TI close to 1. These drugs require intensive monitoring.
Table 2: Examples of Narrow Therapeutic Index (NTI) Drugs [3] [1]
| Drug Class | Example Drugs | Rationale for Monitoring |
|---|---|---|
| Anticoagulants | Warfarin | Small dosage changes can lead to life-threatening bleeding or therapeutic failure (thrombosis). |
| Mood Stabilizers | Lithium Carbonate | Minimum toxic concentration is only 1.5-2.0 times the minimum effective concentration. |
| Cardiac Glycosides | Digoxin | TI is approximately 2:1; toxicity manifests as potentially fatal arrhythmias. |
| Aminoglycoside Antibiotics | Gentamicin | Nephrotoxicity and ototoxicity can occur at levels close to the therapeutic range. |
| Glycopeptide Antibiotics | Vancomycin | Requires TDM to ensure efficacy against resistant bacteria while minimizing renal toxicity. |
| Xanthines | Theophylline | Used for respiratory diseases; toxicity includes seizures and cardiac arrhythmias. |
| Anticonvulsants | Phenytoin | Displays saturable, non-linear pharmacokinetics, making dose prediction difficult. |
The accurate calculation of the therapeutic index is a fundamental and ongoing process in drug development, transitioning from basic in vivo models to sophisticated clinical exposure-based and computational approaches. For drugs with a narrow therapeutic index, such as warfarin and digoxin, the clinical margin for error is small, necessitating rigorous monitoring and personalized dosing [3] [1] [24]. The advancement of computational methods, like the Thermodynamic Integration protocol for antibody optimization, provides powerful tools for researchers to proactively design better drug candidates with improved safety profiles early in the development pipeline [25]. A deep understanding of the principles, calculations, and limitations of the TI is therefore essential for any scientist dedicated to bringing safer and more effective medicines to patients.
The Therapeutic Index (TI) is a quantitative measurement of the relative safety of a drug, providing a critical comparison between the dose or exposure level that causes toxic effects and the dose that produces the desired therapeutic efficacy [1] [14]. This ratio serves as a cornerstone of drug safety assessment, guiding researchers and clinicians in balancing potential benefits against risks of toxicity throughout the drug development pipeline [3].
Classically, TI is calculated as the ratio of the dose that produces a toxic effect in 50% of the population (TD50) to the dose that produces a therapeutic effect in 50% of the population (ED50): TI = TD50 / ED50 [1] [14]. In preclinical animal studies, the lethal dose for 50% of the population (LD50) is sometimes used instead of TD50, giving TIsafety = LD50 / ED50 [1]. A higher TI indicates a wider margin of safety, meaning there is a greater difference between effective and toxic doses [1] [3].
The related concept of the therapeutic window refers to the range of doses between the minimum effective concentration and the minimum toxic concentration that optimizes therapeutic benefit while minimizing unacceptable side effects [1]. Drugs with a narrow therapeutic index (NTI), such as warfarin, lithium, digoxin, and phenytoin, have only a small difference between therapeutic and toxic doses, requiring careful therapeutic drug monitoring (TDM) in clinical practice [1] [3] [14].
Table: Classification of Drugs by Therapeutic Index
| Therapeutic Index Range | Safety Profile | Representative Drugs | Clinical Monitoring Requirements |
|---|---|---|---|
| >100 (Wide TI) | Favorable safety margin | Penicillin, Remifentanil (TI: 33,000) [1] | Routine monitoring typically sufficient |
| 10-100 (Moderate TI) | Moderate safety margin | Diazepam (TI: 100) [1], Ethanol (TI: 10) [1] | Standard clinical observation |
| 2-10 (Narrow TI) | Small safety margin | Cocaine (TI: 15) [1], Paracetamol (TI: 10) [1] | Careful dose titration |
| <2 (Very Narrow TI) | Minimal safety margin | Digoxin (TI: ~2) [1], Lithium [1], Warfarin [1], Gentamicin [1] | Intensive therapeutic drug monitoring (TDM) essential |
Fundamental Calculations and Variations of TI
Core TI Equations and Interpretations
The calculation of Therapeutic Index varies based on the endpoints measured and the context of application. The following formulas represent the primary approaches:
- Efficacy-based TI:
TIefficacy = ED50 / TD50[1] - Safety-based TI:
TIsafety = LD50 / ED50[1] - Protective Index:
PI = TD50 / ED50[1]
The Certainty Safety Factor (CSF), calculated as TD1/ED99, provides a more conservative safety assessment than traditional TI calculations [14]. This ratio specifically addresses the goal of achieving therapeutic effects in 99% of patients without causing toxicity in 1% of the population [14]. A CSF > 1 indicates that the dose effective in 99% of the population is less than the dose that would be toxic in 1% of the population, representing an ideal scenario for clinical translation [14].
From Dose-Based to Exposure-Based TI Calculations
In modern drug development, the limitations of dose-based TI calculations have led to a shift toward exposure-based approaches [1]. Rather than relying solely on administered dose, contemporary TI determination uses plasma concentration metrics such as AUC (Area Under the Curve) or Cmax (maximum concentration) that more accurately reflect tissue exposure and biological effect [1].
For toxicities that manifest after multiple administrations, TI should be calculated using exposure metrics at steady-state rather than after single-dose administration to account for potential accumulation effects [1]. This approach better addresses inter-individual variability due to polymorphisms in metabolism, drug-drug interactions (DDIs), and differences in body weight or environmental factors [1].
Diagram Title: Evolution of TI Calculation from Preclinical to Clinical Stages
The Translational Gap: Challenges in Predicting Clinical TI
Limitations of Preclinical Models
The transition from preclinical TI to clinical TI represents one of the most significant challenges in drug development, with many compounds demonstrating promising preclinical safety profiles that fail to translate to human trials [26]. Several key factors contribute to this translational gap:
Species-Specific Differences: Variations in genetics, immune systems, metabolic pathways, and physiological responses between animal models and humans significantly impact drug absorption, distribution, metabolism, and excretion (ADME) [27] [26]. These differences can lead to substantial discrepancies in both efficacy and toxicity profiles.
Model Biological Complexity: Traditional animal models and cell-based systems often fail to recapitulate the full complexity of human disease pathology, tumor microenvironments, and immune interactions [27] [26]. The controlled conditions of preclinical studies contrast sharply with the heterogeneity of human patient populations, who present with varying comorbidities, genetic backgrounds, and disease stages [27].
Endpoint Correlation Challenges: Biomarkers and readouts that demonstrate clear meaning in preclinical models may lack clear analogues in clinical trials or may not correlate with clinically relevant outcomes [26]. This disconnect is particularly problematic for targeted therapies where mechanism-of-action biomarkers are crucial for dose selection.
Impact of Tumor Biology on TI Translation
In oncology drug development, additional complexities arise from fundamental differences in tumor biology between preclinical models and human cancers. The concept of "oncogene addiction" – where tumor cells become dependent on specific signaling pathways – creates therapeutic opportunities but also translation challenges [14]. However, this dependency may not be faithfully replicated in animal models.
Cancer cells frequently exhibit metabolic vulnerabilities, such as the Warburg effect (dependence on aerobic glycolysis), making them more metabolically fragile than normal cells [14]. While this theoretically enhances therapeutic index, the effect varies significantly between optimized preclinical models and the heterogeneous tumor microenvironment in patients [14].
Additionally, differences in DNA repair mechanisms between cancer cells and normal tissues form the basis for many radiation and chemotherapy approaches [1]. However, the radiation sensitivity of different cell cycle phases (with S-phase being most resistant and M-phase most sensitive) may not be consistently represented across model systems [1].
Strategic Frameworks for Improving TI Translation
Advanced Model Systems for Enhanced Predictivity
Bridging the translational gap requires implementing more physiologically relevant models that better approximate human biology:
Patient-Derived Xenografts (PDX): These models, created by implanting human tumor tissue into immunodeficient mice, better maintain the original tumor's genetic profile, heterogeneity, and drug response characteristics compared to traditional cell line-derived xenografts [27] [28]. PDX models have played critical roles in validating biomarkers for HER2, BRAF, and KRAS pathways [27].
Organoid and 3D Culture Systems: Patient-derived organoids and complex 3D co-culture systems that incorporate multiple cell types (including immune, stromal, and endothelial cells) provide more accurate representations of human tissue architecture and cellular interactions [27] [28]. These systems retain characteristic biomarker expression and have demonstrated utility in predicting therapeutic responses and identifying treatment-resistant populations [27].
Humanized Mouse Models: By engrafting components of the human immune system into mice, these models enable more meaningful evaluation of immunotherapies and immune-related toxicities, addressing a critical limitation of conventional preclinical models [28].
Translational Biomarkers and Multi-Omics Integration
The strategic implementation of biomarkers that bridge preclinical and clinical development provides a powerful approach to de-risking TI translation:
Longitudinal Biomarker Dynamics: Moving beyond single timepoint measurements to capture temporal changes in biomarker expression and function provides a more comprehensive understanding of drug effects and potential resistance mechanisms [27]. This approach reveals patterns and trends that may better predict clinical outcomes.
Multi-Omics Integration: Combining genomics, transcriptomics, proteomics, and metabolomics data generates a systems-level understanding of drug effects and toxicity mechanisms [27] [28]. This comprehensive approach identifies context-specific, clinically actionable biomarkers that might be missed with single-platform analyses.
Functional Validation: Complementing traditional correlative biomarker studies with functional assays that demonstrate biological relevance strengthens the case for clinical utility and provides mechanistic insights into TI limitations [27].
Table: Essential Research Reagent Solutions for TI Translation Studies
| Research Tool Category | Specific Examples | Primary Applications in TI Translation |
|---|---|---|
| Advanced Preclinical Models | Patient-Derived Xenografts (PDX) [27] [28], Organoids [27] [28], 3D Co-culture Systems [27], Humanized Mouse Models [28] | Recapitulate human disease biology, predictive efficacy and toxicity assessment |
| Multi-Omics Platforms | Genomics (CRISPR screens) [28], Single-Cell RNA Sequencing [28], Proteomics, Metabolomics [27] [28] | Comprehensive biomarker identification, mechanism of action studies |
| Specialized Assay Systems | High-Throughput Screening Assays [28], Microfluidic Organ-on-a-Chip [28], Functional Assays [27] | Target validation, toxicity screening, functional biomarker assessment |
| Analytical & Computational Tools | AI/ML Algorithms [27] [28], PK/PD Modeling Software [26], Bioinformatic Platforms [27] [28] | Data integration, exposure-response modeling, clinical dose prediction |
Integrated PK/PD Modeling and Dose Projection
Robust pharmacokinetic/pharmacodynamic (PK/PD) modeling built on carefully designed preclinical data provides a more reliable foundation for first-in-human dose selection [26]. This approach includes:
Cross-Species Scaling: Using allometric principles and physiological-based PK modeling to translate drug exposure from animals to humans while accounting for metabolic and clearance differences [26].
Integrated Efficacy-Toxicity Modeling: Simultaneously modeling both therapeutic and toxicological effects to identify the optimal exposure window rather than considering these endpoints in isolation [1].
Early Clinical Trial Simulation: Using preclinical data to simulate various clinical dosing scenarios and predict potential TI under different regimen strategies, enabling more informed clinical trial design [26].
Diagram Title: Strategic Framework for Translating Preclinical TI to Clinical Settings
Experimental Protocols for TI Assessment
Comprehensive TI Study Design
A robust TI assessment requires integrated study designs that simultaneously evaluate efficacy and toxicity endpoints:
Protocol 1: Integrated Efficacy-Toxicity Study Design
- Objective: Determine therapeutic index through parallel assessment of efficacy and toxicity endpoints in relevant models.
- Model Selection: Utilize PDX models or immunocompetent animal models based on mechanism of action and clinical context [27] [28].
- Dosing Regimen: Implement 4-5 dose levels spanning anticipated sub-therapeutic to toxic ranges, with appropriate sample sizes for statistical power (typically n=8-10 per group for in vivo studies).
- Efficacy Endpoints: Include tumor growth inhibition (for oncology), disease-specific functional measures, and relevant biomarker modulation (e.g., target engagement, pathway inhibition) [28].
- Toxicity Endpoints: Assess clinical observations, body weight changes, clinical pathology (hematology, clinical chemistry), histopathology of key organs, and mechanism-based toxicities.
- Pharmacokinetic Sampling: Collect serial plasma samples at multiple timepoints to characterize exposure-response relationships for both efficacy and toxicity [1].
- Data Analysis: Calculate ED50 and TD50 using non-linear regression models; derive TI using appropriate formula based on study objectives.
Protocol 2: Translational Biomarker Validation
- Objective: Establish biomarkers that bridge preclinical and clinical development for improved TI prediction.
- Biomarker Identification: Employ multi-omics approaches (genomics, transcriptomics, proteomics) to identify potential efficacy and toxicity biomarkers in preclinical models [27] [28].
- Cross-Species Correlation: Conduct cross-species transcriptomic analysis to identify conserved biomarker signatures with clinical relevance [27].
- Temporal Assessment: Implement longitudinal sampling to characterize biomarker dynamics in relation to drug exposure and effects [27].
- Functional Validation: Use genetic approaches (CRISPR, RNAi) or pharmacological inhibitors to establish causal relationships between biomarker modulation and biological effects [28].
- Clinical Correlation: When possible, compare preclinical biomarker findings with early clinical trial data to assess predictive value.
Regulatory Considerations and Clinical Dose Selection
The transition from preclinical TI to clinical application requires careful attention to regulatory expectations and strategic dose selection:
First-in-Human (FIH) Dose Calculation: The maximum recommended starting dose (MRSD) for initial clinical trials is typically derived from animal toxicity studies using appropriate safety factors [26]. The No Observed Adverse Effect Level (NOAEL) from the most sensitive animal species is converted to a Human Equivalent Dose (HED) using body surface area conversion factors.
Minimum Anticipated Biological Effect Level (MABEL) Approach: For high-risk compounds, particularly those with novel mechanisms or unpredictable toxicity, the MABEL approach provides a more conservative starting dose based on the minimal exposure required for pharmacological activity [26].
Therapeutic Drug Monitoring (TDM) Protocols: For drugs with narrow therapeutic indices, implement TDM protocols that measure drug concentrations in biological fluids to guide individualized dosing and maintain exposures within the therapeutic window [1] [3].
The successful translation of therapeutic index from preclinical models to clinical application remains a critical challenge in drug development. The limitations of traditional animal models, species-specific differences in drug disposition and response, and the complexity of human disease biology all contribute to the translational gap. However, strategic approaches incorporating advanced model systems, translational biomarkers, integrated PK/PD modeling, and careful clinical trial design are improving the predictability of TI assessment.
The future of TI translation will be shaped by emerging technologies including AI-driven biomarker discovery, more sophisticated humanized models, microphysiological systems, and multi-omics integration. These advances promise to enhance the mechanistic understanding of efficacy and toxicity relationships, ultimately improving the success rate of drug development and enabling more precise individualized therapy for patients. As these technologies evolve, the scientific community must maintain focus on the fundamental goal: developing effective therapies with acceptable safety profiles that address unmet medical needs across diverse patient populations.
The therapeutic index (TI) is a quantitative measurement of the relative safety of a drug, comparing the amount of a therapeutic agent that causes toxicity to the amount that causes the desired therapeutic effect [1]. Classically, TI is calculated as the ratio of the dose that produces a toxic response in 50% of the population (TD₅₀) to the dose that produces an effective response in 50% of the population (ED₅₀), expressed as TI = TD₅₀/ED₅₀ [5] [15]. A related concept, the therapeutic window, refers to the range of doses optimized between efficacy and toxicity that achieves the greatest therapeutic benefit without resulting in unacceptable side effects [1].
In drug development, understanding and accurately determining the TI is crucial because drugs with a narrow therapeutic index (NTI) have a very small margin between doses that are effective and those that cause severe, potentially fatal adverse events [15]. For NTIDs, small variations in plasma concentrations can result in therapeutic failure or appearance of toxic effects, necessitating careful titration and patient monitoring [15]. Regulatory authorities generally consider a drug to have a good safety profile if its TI exceeds 10, whereas drugs with a TI less than 2 are typically classified as NTIDs [15] [1].
Table 1: Fundamental Concepts of Therapeutic Index
| Term | Abbreviation | Definition | Application |
|---|---|---|---|
| Effective Dose | ED₅₀ | Dose producing therapeutic response in 50% of population | TI Calculation |
| Toxic Dose | TD₅₀ | Dose producing toxicity in 50% of population | TI Calculation |
| Lethal Dose | LD₅₀ | Dose causing death in 50% of population (animal studies) | Preclinical TI |
| Therapeutic Index | TI | Ratio of toxic/effective dose (TD₅₀/ED₅₀) | Safety Assessment |
| Therapeutic Window | - | Range of effective doses with acceptable toxicity | Clinical Dosing |
Traditional Dose-Based TI Calculations
The conventional approach to TI determination relies primarily on dose-response relationships derived from animal studies or clinical observations. In this paradigm, the TI is calculated using the administered dose as the primary variable, without direct consideration of the systemic exposure or concentration-time relationships [1]. The dose-based TI represents a population-average metric that forms the foundation of traditional toxicology and pharmacology assessments.
The classical formula for safety-based therapeutic index is: TI(safety) = LD₅₀/ED₅₀, where LD₅₀ represents the median lethal dose determined in animal studies [1]. For clinical applications, a more relevant calculation is the efficacy-based therapeutic index: TI(efficacy) = ED₅₀/TD₅₀, which describes the relationship between therapeutic and toxic effects without necessarily involving lethal endpoints [1]. The protective index (PI = TD₅₀/ED₅₀) is often more informative about a substance's relative safety since toxicity frequently occurs at levels far below lethal doses [1].
Despite its historical importance and conceptual simplicity, the dose-based approach has significant limitations. It does not account for interindividual variability in drug absorption, distribution, metabolism, and excretion, which can substantially alter the relationship between administered dose and systemic exposure [15]. This variability can result from demographic factors (age, weight, gender), genetic polymorphisms (particularly in drug-metabolizing enzymes), comorbidities (renal or hepatic impairment), drug-drug interactions, and environmental influences [15]. Consequently, two patients receiving the same dose of a drug may experience markedly different therapeutic and toxic outcomes, making dose-based TI predictions potentially unreliable for clinical translation.
The Transition to Exposure-Based TI Calculations
Modern drug development has increasingly shifted toward exposure-based TI calculations that utilize pharmacokinetic (PK) and pharmacodynamic (PD) principles to provide a more sophisticated and predictive safety assessment. This approach recognizes that it is the tissue exposure to a drug (i.e., drug concentration over time) rather than the administered dose that drives both pharmacological efficacy and toxicological adverse effects [1].
The fundamental relationship underlying exposure-based TI assessment can be described as follows. The target concentration needed to achieve a desired therapeutic effect is derived from PD parameters, particularly the drug's potency (EC₅₀ or C₅₀) and maximum effect (Eₘₐₓ) according to the formula: Target Concentration = C₅₀ × Target Effect/(Eₘₐₓ - Target Effect) [29]. This target concentration is then used to determine appropriate dosing regimens through PK parameters: Loading Dose = Volume of Distribution × Target Concentration and Maintenance Dose Rate = Clearance × Target Concentration [29].
Exposure-based TI offers several advantages over traditional dose-based approaches. By focusing on drug concentrations at the site of action rather than administered doses, it accounts for interindividual variability in PK parameters and enables more precise dose individualization [29] [1]. This approach also facilitates species translation in preclinical development and supports extrapolation to special populations (pediatrics, elderly, organ impairment) [29]. Furthermore, exposure-based TI allows for the integration of biomarker data and enables model-based drug development through pharmacokinetic/pharmacodynamic (PK/PD) modeling and simulation [30].
Table 2: Comparison of Dose-Based vs. Exposure-Based TI Calculations
| Characteristic | Dose-Based TI | Exposure-Based TI |
|---|---|---|
| Primary Metric | Administered dose | Drug concentration at target site |
| Key Parameters | ED₅₀, TD₅₀, LD₅₀ | EC₅₀, TC₅₀, AUC, Cₘₐₓ |
| Variability Accounting | Limited consideration | Incorporates PK/PD variability |
| Species Translation | Problematic | More reliable with affinity adjustment |
| Clinical Prediction | Moderate | Improved through PK/PD modeling |
| Regulatory Acceptance | Traditional standard | Increasingly preferred |
PK/PD Modeling in TI Determination
Pharmacokinetic/pharmacodynamic (PK/PD) modeling provides a powerful quantitative framework for integrating preclinical pharmacology and toxicology data to determine the therapeutic index [30]. PK/PD modeling establishes mathematical relationships between administered doses, resulting drug concentrations in various body compartments (PK), and the resulting pharmacological and toxicological effects (PD) [30] [31].
The interdependence of PK and PD is fundamental to exposure-based TI determination. A drug's pharmacokinetic properties (absorption, distribution, metabolism, excretion) directly influence its concentration-time profile at the effect site, which in turn determines the magnitude and duration of pharmacodynamic responses [31]. Drugs with short half-lives may require frequent dosing to maintain therapeutic concentrations, while drugs with long half-lives can be dosed less frequently, with implications for both efficacy and toxicity [31].
A practical application of PK/PD modeling in TI determination is illustrated by a case study involving an interleukin-10 (IL-10) Fc-fusion protein [30]. In this study, researchers established PK/PD relationships for both efficacy (using IL-18 induction as a pharmacodynamic biomarker correlated with antitumor efficacy) and toxicity (hematological adverse events including anemia and thrombocytopenia) in relevant species. The induction of IL-18 served as a bridge to connect mouse efficacy data with monkey toxicology data, enabling calculation of the TI in monkeys despite the insensitivity of mice to IL-10-related toxicity [30]. The PD-based efficacious dose projected in monkeys was comparable to results obtained using a PK-based method where mouse efficacious exposure was targeted and corrected for affinity differences between species [30]. Through this approach, the TI of the IL-10 Fc-fusion protein in cynomolgus monkeys was determined to be 2.4 (vs. PD-based efficacy) and 1.2-3 (vs. PK-based efficacy), indicating a narrow safety margin [30].
PK/PD Modeling Workflow for TI Determination
Experimental Protocols for Exposure-Based TI Assessment
Protocol 1: In Vivo PK/PD Study for TI Determination
Objective: To characterize the exposure-response relationships for both efficacy and toxicity in a relevant animal model to determine the therapeutic index.
Materials and Methods:
- Test System: Appropriate animal model (e.g., mice, cynomolgus monkeys) with demonstrated relevance to human physiology and drug target [30]
- Dosing Groups: Multiple dose levels (typically 4-5) spanning anticipated subtherapeutic to toxic ranges, with adequate sample size per group (n=5-8 for rodents, n=3-4 for non-human primates) [30]
- PK Sampling: Serial blood collection at predetermined time points (e.g., pre-dose, 0.25, 0.5, 1, 2, 4, 8, 12, 24 hours post-dose) to characterize concentration-time profile [30]
- PD Assessments: Biomarker measurements (e.g., IL-18 for efficacy of IL-10 Fc-fusion protein) and toxicity monitoring (e.g., hematological parameters, clinical chemistry, histopathology) at appropriate intervals [30]
- Bioanalytical Methods: Validated LC-MS/MS or immunoassay procedures for drug quantification and biomarker measurement [30]
Data Analysis:
- Noncompartmental PK Analysis: Calculate AUC, Cₘₐₓ, tₘₐₓ, t₁/₂, CL, Vd using Phoenix WinNonlin or equivalent software
- PK/PD Modeling: Develop mathematical models relating plasma concentrations to effects using nonlinear mixed-effects modeling (NONMEM, Monolix) or standard nonlinear regression
- TI Calculation: Determine EC₅₀ (concentration for 50% of maximum efficacy) and TC₅₀ (concentration for 50% of maximum toxicity) from fitted models; Calculate TI as TC₅₀/EC₅₀ [30]
Protocol 2: Translational PK/PD Modeling for TI Projection
Objective: To integrate preclinical efficacy and toxicity data from different species for human TI projection.
Materials and Methods:
- Cross-Reactivity Assessment: Evaluate species specificity of drug target interaction; use surrogate molecules when human drug does not cross-react with animal targets [30]
- Affinity Determination: Measure binding affinity (Kd) to target receptors across species using surface plasmon resonance (SPR) or similar techniques [30]
- Biomarker Qualification: Identify and validate translational PD biomarkers that bridge efficacy across species (e.g., IL-18 induction for IL-10 compounds) [30]
- Toxicity Characterization: Conduct thorough safety pharmacology and toxicology studies in relevant species, focusing on dose-limiting toxicities [30]
Data Analysis:
- Allometric Scaling: Project human PK parameters from animal data using species-invariant time methods [30]
- Affinity Adjustment: Adjust for species differences in target binding affinity when projecting efficacious concentrations [30]
- Integrated PK/PD Modeling: Develop species-invariant models relating exposure to efficacy and toxicity biomarkers
- Human TI Projection: Simulate human exposure-response relationships for both efficacy and toxicity to estimate clinical TI [30]
Table 3: Research Reagent Solutions for TI Studies
| Reagent/Category | Specific Examples | Function in TI Assessment |
|---|---|---|
| Bioanalytical Assays | LC-MS/MS, Immunoassays (ELISA) | Quantify drug concentrations and biomarker levels in biological matrices |
| Surrogate Molecules | Species-specific analogs (mFc-mIL-10) | Enable efficacy assessment in non-cross-reactive species |
| Biomarker Reagents | Capture/detection antibody pairs (anti-IL-18) | Measure pharmacodynamic responses correlated with efficacy |
| Cell-Based Assays | Primary cells, reporter gene assays | Evaluate target engagement and functional activity in vitro |
| Binding Assays | Surface plasmon resonance (SPR) | Determine binding affinity across species for translation |
Regulatory and Clinical Implications
The distinction between dose-based and exposure-based TI calculations has significant implications for drug development strategies and regulatory decision-making. Regulatory authorities recognize that inadequate dose selection is one of the most challenging issues in drug development, contributing to high attrition rates in late-stage clinical development and postmarketing commitments [29]. There is growing consensus that selection of dose for phase III trials is an estimation problem rather than a hypothesis testing problem and should be informed by well-designed dose-finding studies that characterize the complete dose-exposure-response relationship [29].
For narrow therapeutic index drugs (NTIDs), regulatory agencies generally recommend reduced bioequivalence limits for generic versions. While standard bioequivalence criteria accept a 90% confidence interval for the ratio of geometric means of AUC and Cₘₐₓ between 80-125%, some authorities propose tighter limits (90-111%) for NTIDs to minimize the risk of therapeutic failure or adverse events [15]. This is particularly important for drugs like flecainide (an antiarrhythmic agent), which demonstrates characteristic NTID properties including a steep dose-response relationship for both safety and efficacy, need for therapeutic drug monitoring, and significant intrasubject variability in pharmacokinetic properties [15].
The clinical application of exposure-based TI assessment enables more rational dose individualization, particularly for NTIDs. Therapeutic drug monitoring (TDM) protocols are recommended for drugs with narrow therapeutic ranges, such as lithium for psychiatric disorders, where measurements of blood levels guide dosage adjustments to maintain concentrations within the therapeutic window [1]. Similarly, several antibiotics (gentamicin, vancomycin) and antifungals (amphotericin B) require monitoring to balance efficacy with toxicity minimization [1].
Clinical Translation of Exposure-Based TI
The evolution from dose-based to exposure-based therapeutic index calculations represents a significant advancement in drug development science. By incorporating PK/PD principles and modeling approaches, exposure-based TI assessment provides a more comprehensive and predictive framework for evaluating the benefit-risk profile of investigational therapeutics. This paradigm shift enables more informed decision-making throughout drug development, from lead optimization to clinical dose selection, particularly for drugs with narrow therapeutic indices where small changes in exposure can profoundly impact clinical outcomes.
The integration of exposure-based TI assessment into regulatory science and clinical practice supports the development of safer and more effective medications through improved dose selection, better characterization of special population needs, and more scientifically rigorous justification of dosing rationales. As drug development continues to address increasingly complex therapeutic targets and patient populations, the role of PK/PD modeling in TI determination will become ever more critical for balancing efficacy and safety in precision medicine.
The therapeutic index (TI) is a quantitative measurement of the relative safety of a drug, providing a critical comparison between the dose or exposure level that causes therapeutic effects versus toxicity [1]. Also referred to as the therapeutic ratio, this fundamental concept in pharmacology serves as a cornerstone for drug development decisions, dosage regimen design, and risk-benefit assessment throughout the drug development pipeline. The TI represents a fundamental bridge between the efficacy and safety profiles of an investigational compound, guiding researchers and clinicians in optimizing therapeutic outcomes while minimizing potential harm to patients [1] [3].
In clinical practice, the related concepts of therapeutic window or safety window refer to the range of doses optimized between efficacy and toxicity, achieving the greatest therapeutic benefit without resulting in unacceptable side-effects or toxicity [1]. For drugs with a narrow therapeutic index (NTI), small variations in dose or exposure can lead to subtherapeutic effects or significant toxicity, necessitating careful monitoring and individualized dosing strategies [3] [32].
Fundamental Concepts and Calculations
Classical Therapeutic Index Definitions
Classically, the therapeutic index is calculated as the ratio of the dose that produces toxicity in 50% of the population (TD₅₀) to the dose that produces the desired therapeutic effect in 50% of the population (ED₅₀) [1] [32]. The fundamental equation is expressed as:
Therapeutic Index (TI) = TD₅₀ / ED₅₀
In early pharmaceutical toxicology, this was frequently determined in animals using the lethal dose for 50% of the population (LD₅₀) divided by the minimum effective dose for 50% of the population (ED₅₀) [1]. However, in modern drug development settings, more sophisticated toxicity endpoints are typically used, as severe toxicities in humans often occur at sublethal doses [1].
Table 1: Key Terms in Therapeutic Index Calculations
| Term | Full Form | Definition |
|---|---|---|
| ED | Effective Dose | The dose or concentration that produces a biological response [1] |
| ED₅₀ | Median Effective Dose | The dose that causes the therapeutic effect in 50% of the population [1] |
| TD | Toxic Dose | The dose at which toxicity occurs [1] |
| TD₅₀ | Median Toxic Dose | The dose that causes toxicity in 50% of the population [1] |
| LD₅₀ | Median Lethal Dose | The dose that causes death in 50% of the population (primarily used in animal studies) [1] |
Types of Therapeutic Index
Based on efficacy and safety considerations, there are two primary types of therapeutic index [1]:
Safety-based Therapeutic Index:
- Formula: TIₛₐfₑₜᵧ = LD₅₀ / ED₅₀
- Desirable for the LD₅₀ to be as large as possible to decrease risk of lethal effects
- A higher value indicates a larger therapeutic window
Efficacy-based Therapeutic Index:
- Formula: TIₑffᵢcₐcᵧ = ED₅₀ / TD₅₀
- Ideally, ED₅₀ is as low as possible for faster drug response, and TD₅₀ is as large as possible to decrease toxic risk
- A lower value indicates a larger therapeutic window
The Protective Index (PI = TD₅₀/ED₅₀) is also used, which is the reciprocal of the efficacy-based therapeutic index. For many substances, toxicity occurs at levels far below lethal effects, making the protective index often more informative about a substance's relative safety when toxicity is properly specified [1].
Exposure-Based TI in Modern Drug Development
In contemporary drug development, the TI is increasingly calculated based on plasma exposure levels rather than administered dose [1] [33]. This approach recognizes that it is the exposure of a given tissue to a drug (i.e., drug concentration over time) that drives both pharmacological and toxicological effects, rather than the dose itself [1]. This is particularly important given the marked inter-individual variability in exposure at the same dose due to factors such as genetic polymorphisms in metabolism, drug-drug interactions (DDIs), differences in body weight, or environmental factors [1].
The importance of using exposure instead of dose is further emphasized when considering toxicities that occur after multiple dose administrations. For these delayed toxicities, the TI should be calculated using the exposure to drug at steady-state conditions rather than after administration of a single dose [1].
Therapeutic Index in Target Validation and Early Discovery
Role in Target Validation
During the target validation stage, researchers work to link an endogenous molecule, process, or pathway to a disease state using various experimental approaches [33]. The potential therapeutic index of compounds modulating a particular target becomes an important consideration early in the discovery process. Three primary validation strategies are employed [33]:
- Genetic approaches: Utilizing knockout technology (deleting a gene) or knockdown approaches (interfering with mRNA) to examine consequences in whole animals
- Proteomic approaches: Manipulating protein targets directly using neutralizing antibodies or novel techniques like laser inactivation of target proteins
- Pharmacological approaches: Using small molecules that interact with the target, including tool compounds with inappropriate drug-like properties but utility for target validation
Each approach has limitations, prompting the frequent use of combined strategies to build confidence that a target is worth pursuing through lengthy and expensive clinical trials [33].
Investigative Toxicology and Early Safety Assessment
The evolving role of investigative toxicology has become increasingly important in early drug discovery [34]. Traditionally, preclinical toxicology was primarily descriptive, carefully reporting treatment-related effects to calculate safety margins. However, technological advances now enable researchers to gain insights into toxicity mechanisms, supporting greater understanding of species relevance, translatability to humans, prediction of safety events, mitigation of side effects, and development of safety biomarkers [34].
Modern approaches include:
- In vitro pharmacological profiling: Screening compounds against a panel of pharmacological targets to identify off-target activities that may lead to adverse effects [35]
- Secondary pharmacology assessment: Evaluating interactions with non-target proteins that frequently cause adverse drug reactions [34]
- Toxicity mechanism elucidation: Using advanced cell culture models, organs-on-chips, and transcriptomic profiling to understand underlying toxicity pathways [34]
Table 2: Key Research Reagent Solutions in Early TI Assessment
| Research Tool | Function in TI Assessment |
|---|---|
| High-throughput screening panels | Identify off-target binding activities that may limit TI [35] |
| Stem cell-derived hepatocytes | Predict drug-induced liver injury potential [34] |
| hERG channel assays | Assess cardiotoxicity risk, a common cause of TI limitations [35] |
| Organ-on-chip models | Evaluate organ-specific toxicity in more physiologically relevant systems [34] |
| BioPrint database approaches | Compare new compounds to reference compounds with known clinical profiles [35] |
TI Assessment in Preclinical Development
Pharmacokinetic/Pharmacodynamic (PK/PD) Relationships
The paired study of pharmacokinetics (PK) and pharmacodynamics (PD) represents a critical component of TI assessment during preclinical development [33]. PK is defined by how a compound is absorbed, distributed, metabolized, and excreted, while PD measures a compound's ability to interact with its intended target leading to a biologic effect [33]. The relationship between these parameters forms the basis for understanding exposure-response relationships that underpin TI calculations.
In practice, efficacy is initially measured against dose, but with the addition of pharmacokinetic data, researchers can consider efficacy against drug concentration or exposure, ideally in the tissue of interest [33]. This progression from dose-response to exposure-response relationships represents a more sophisticated approach to TI determination that better predicts human outcomes.
Animal Models in Efficacy and Safety Profiling
Animal models serve as essential tools for TI assessment during preclinical development, despite ongoing efforts to develop alternatives [33]. These models enable researchers to:
- Translate in vitro findings into complex living systems
- Assess efficacy in disease-relevant models
- Evaluate potential side effects and toxicities
- Establish preliminary safety margins
In pharmaceutical research, a suite of animal models is typically used to assess activity of putative drug candidates, gaining information that helps guide identification of both the most relevant and broadest clinical indications where a drug might show efficacy [33]. The advantage of evaluating drugs in a variety of models and endpoints lies in obtaining a more comprehensive understanding of the potential TI across different physiological contexts.
Development Candidate Profiling
Following lead optimization efforts, multiple potential drug candidates undergo comprehensive profiling, including extensive dose response curves (DRCs) for both efficacy and plasma exposure [33]. In neuroscience and pain settings, brain exposure is frequently measured as well [33]. The DRC allows estimation of quantitative measures of efficacy and potency such as:
- MED (minimally effective dose)
- ED₅₀ (dose that causes 50% of a maximal effect in 100% of the population)
At this stage, side effect tests are performed to ensure that efficacy conclusions are not confounded by non-specific effects such as sedation [33]. Side-effect profiling enables calculation of a preclinical therapeutic index, defined as the ratio between the lowest efficacious dose and the lowest dose causing an unwanted side effect [33]. Ideally, this TI should be as large as possible, though acceptable values vary by therapeutic area, with oncology typically tolerating TI values less than 10 [33].
TI Considerations in Clinical Development
Biomarkers and Surrogate Endpoints
In clinical development, biomarkers play an increasingly important role in TI assessment and optimization [36] [37]. A biomarker (S) measured after randomization can provide information about the true endpoint (T) and hence the effect of treatment (Z) [36]. Biomarkers can usually be measured earlier and more easily than final clinical endpoints, potentially shortening trial length and reducing costs [36] [37].
Biomarkers can serve two primary roles [36]:
- Surrogate endpoints: Completely replacing the true clinical endpoint to evaluate treatment effectiveness
- Auxiliary variables: Enhancing efficiency of treatment effect estimation when the true endpoint is not completely observed
While there has been significant interest in surrogate endpoints, very few biomarkers have been accepted as valid surrogates due to concerns that they may not fully capture the treatment effect on the true clinical outcome or potential harmful side effects [36]. However, the use of biomarkers as auxiliary variables has proven more promising, particularly when there is more information on the biomarker than on the true endpoint for a study population [36].
Therapeutic Drug Monitoring for NTI Drugs
For drugs with a narrow therapeutic index, dosage adjustment according to measurements of blood levels is often implemented through therapeutic drug monitoring (TDM) protocols [1]. This is particularly important for drugs such as lithium, warfarin, theophylline, digoxin, and various antibiotics including gentamicin and vancomycin [1] [3].
TDM is recommended for lithium treatment in psychiatric disorders due to its narrow therapeutic range [1]. Similarly, anticancer therapies like tyrosine kinase inhibitors often exhibit narrow therapeutic windows, requiring careful monitoring and dose individualization to maintain efficacy while minimizing toxicities.
Adverse Events as Biomarkers for TI Assessment
Recent research has explored the use of early adverse events as potential biomarkers for predicting clinical outcomes and informing TI considerations [38]. In immuno-oncology, for example, immune-related adverse events (irAEs) have been associated with improved overall survival in melanoma patients treated with nivolumab [38]. For non-small cell lung cancer (NSCLC), a review of over ten immune checkpoint inhibitor studies suggested irAEs as potential surrogates of better ICI efficacy [38].
Novel methodologies have been developed to derive AE biomarkers that assess grade, treatment relatedness, occurrence, frequency, and duration, moving beyond traditional descriptive statistics to more informative metrics that can inform therapeutic index considerations throughout clinical development [38].
Therapeutic Index Ranges Across Drug Classes
The therapeutic index varies widely among pharmaceutical substances, even within related groups [1]. This variability has profound implications for clinical use, monitoring requirements, and risk management strategies.
Table 3: Therapeutic Index Ranges for Selected Drugs
| Drug | Therapeutic Index | Clinical Implications |
|---|---|---|
| Remifentanil | 33,000:1 [1] | Very wide safety margin |
| Diazepam | 100:1 [1] | Relatively forgiving safety profile |
| Morphine | 70:1 [1] | Requires careful dosing |
| Cocaine | 15:1 [1] | Narrow safety margin |
| Ethanol | 10:1 [1] | Narrow safety margin |
| Paracetamol | 10:1 [1] | Narrow safety margin, hepatotoxicity risk |
| Digoxin | 2:1 [1] | Very narrow margin, requires TDM |
| Warfarin | Narrow [1] [3] | Requires frequent monitoring and dose adjustment |
| Lithium | Narrow [1] [3] | Requires TDM and careful clinical monitoring |
Drugs with a narrow therapeutic index present particular challenges in clinical practice. Small increases in dosing of medications like warfarin, lithium, theophylline, digoxin, and gentamicin can result in toxic effects, necessitating close monitoring after prescription [3]. These drugs require particular vigilance from healthcare providers, including frequent assessment of drug levels in the blood, careful dose adjustments, and thorough patient education about adherence and symptom recognition [3] [32].
The assessment and optimization of the therapeutic index remains a fundamental consideration throughout drug development, from initial target validation to post-marketing surveillance. While classical TI calculations based on TD₅₀/ED₅₀ ratios provide a valuable starting point, modern drug development has evolved to incorporate more sophisticated approaches including exposure-response modeling, biomarker-driven strategies, and mechanistic toxicology assessments.
The integration of PK/PD relationships, investigative toxicology, and clinical biomarker data enables a more comprehensive understanding of a drug's therapeutic index, ultimately supporting better decision-making at each stage of development. For drugs with narrow therapeutic indices, innovative approaches including therapeutic drug monitoring, pharmacogenomic strategies, and careful clinical management can help optimize their benefit-risk profile in clinical practice.
As drug development continues to evolve, with increasing emphasis on targeted therapies and personalized medicine approaches, the principles of therapeutic index assessment remain essential for balancing efficacy and safety across diverse patient populations.
Challenges and Strategies for Narrow Therapeutic Index Drugs
The Therapeutic Index (TI) is a fundamental concept in pharmacology and drug safety, serving as a quantitative measure of a drug's safety margin. It is a ratio that compares the blood concentration at which a drug becomes toxic to the concentration at which it is effective [3]. Clinically, the therapeutic index is often calculated using the formula: TI = TD50 / ED50, where TD50 is the dose that produces a toxic effect in 50% of the population, and ED50 is the dose that produces a therapeutic effect in 50% of the population [3]. Drugs with a wide therapeutic index (such as penicillin) have a large margin between effective and toxic doses, making them relatively safe with minimal monitoring requirements. In contrast, Narrow Therapeutic Index (NTI) drugs are those where "small differences in dose or blood concentration may lead to serious therapeutic failures and/or adverse drug reactions that are life-threatening or result in persistent or significant disability or incapacity" according to the U.S. Food and Drug Administration (FDA) [39] [40].
The clinical significance of NTI drugs stems from their precarious risk-benefit profile. For healthcare providers, prescribing NTI drugs requires careful dosage titration and ongoing therapeutic drug monitoring to maintain plasma concentrations within the narrow window between efficacy and toxicity. For drug development professionals, the designation carries significant regulatory implications, particularly for generic drug manufacturers who must meet more rigorous bioequivalence standards [39] [41]. The FDA has established specialized protocols and criteria to ensure the safe use of both innovator and generic NTI drugs, recognizing that conventional bioequivalence standards may be insufficient for these critical medications.
FDA Criteria for NTI Drug Identification
General Characteristics of NTI Drugs
The FDA identifies NTI drugs based on five general characteristics that distinguish them from conventional medications. These characteristics collectively define the precarious balance between efficacy and toxicity that defines this drug class [39]:
Minimal separation between therapeutic and toxic doses: NTI drugs exhibit little separation between the doses (or corresponding blood concentrations) that produce therapeutic effects and those that cause toxicity. This means that even small dose increments can precipitate adverse drug reactions that are potentially life-threatening or result in significant disability.
Risk of serious outcomes from concentration deviations: Both sub-therapeutic and supra-therapeutic concentrations of NTI drugs may cause serious consequences. Too low concentrations can lead to therapeutic failure in critical conditions (e.g., seizure breakthrough in epilepsy, organ rejection in transplant patients), while too high concentrations can cause severe adverse effects.
Requirement for therapeutic drug monitoring: NTI drugs typically necessitate therapeutic monitoring based on laboratory measurements of drug concentrations in patient blood. This monitoring allows clinicians to individualize dosing regimens to maintain drug levels within the narrow therapeutic window.
Low within-subject variability: These drugs demonstrate low within-subject variability, meaning there is minimal change in drug exposure when the same individual receives the same drug product across different time periods under identical conditions.
Small dosage adjustments in clinical practice: During clinical use, doses of NTI drugs are often adjusted in very small increments (frequently less than 20%) to fine-tune therapy while avoiding toxicity [39] [41].
FDA's Designation Process for NTI Drugs
The FDA has established a systematic approach to designate drugs as having narrow therapeutic indices. The NTI Drug Working Group (NTID WG), co-led by the Office of Generic Drugs (OGD) and the Office of Translational Sciences (OTS) with participation from the Office of New Drugs, is responsible for resolving key scientific and regulatory issues related to NTI drugs and ensuring consistency in evaluation between new and generic drugs [39] [40].
For new drugs, the FDA examines the relationship between drug exposure and both efficacy and serious side effects. If the data demonstrate that only a small increase in drug exposure causes serious adverse events, the NTID WG conducts further evaluation to determine whether the drug should be designated as an NTI drug. The assessment incorporates multiple data sources including annual safety reports submitted by drug applicants, safety reports from the FDA Adverse Event Reporting System (FAERS), medical literature, and other relevant information [39].
For previously approved drugs, the FDA continuously monitors safety data and may designate existing drugs as NTI based on post-marketing experience and emerging evidence. If new information affects approved labeling, CDER collaborates with drug applicants to update the labeling accordingly [39]. This dynamic process ensures that NTI designations reflect the most current understanding of a drug's safety profile.
Table 1: Examples of Drugs Designated as NTI by FDA
| Drug Product | Therapeutic Category | Key Monitoring Parameters |
|---|---|---|
| Warfarin | Anticoagulant | International Normalized Ratio (INR) |
| Levothyroxine | Thyroid hormone replacement | Thyroid-stimulating hormone (TSH) |
| Theophylline | Bronchodilator | Serum theophylline concentrations |
| Digoxin | Cardiac glycoside | Serum digoxin concentrations |
| Lithium | Mood stabilizer | Serum lithium concentrations |
| Gentamicin | Aminoglycoside antibiotic | Peak and trough serum concentrations |
Regulatory Framework and Bioequivalence Standards
FDA Bioequivalence Criteria for Generic NTI Drugs
The FDA applies significantly tightened bioequivalence criteria for generic NTI drugs compared to conventional generic drugs. For non-NTI drugs, the standard bioequivalence acceptance criteria require that the 90% confidence interval for the ratio of population geometric means of the test (generic) to reference (brand-name) products falls within 80.00-125.00% for both AUC (area under the concentration-time curve) and Cmax (maximum concentration) [41] [42]. For NTI drugs, the FDA recommends a fully replicated, two-sequence, two-treatment, four-period crossover study design where bioequivalence must be established using multiple rigorous criteria [41]:
Reference-scaled average bioequivalence: The bioequivalence limits are narrowed based on the within-subject variability of the reference product. When the within-subject standard deviation for the reference product (σWR) equals 0.10, the limits are set at 90.00-111.11%. If σWR is less than or greater than 0.10, the reference-scaled limits become narrower or wider, respectively.
Unscaled average bioequivalence: All NTI drugs must also pass the conventional average bioequivalence limits of 80.00-125.00%, ensuring that the limits never exceed this conventional range regardless of variability.
Within-subject variability comparison: The ratio of within-subject standard deviation between test and reference products (σWT/σWR) must be declared equivalent when the upper limit of the 90% confidence interval for this ratio is ≤ 2.5 [41].
These stringent requirements ensure that generic versions of NTI drugs demonstrate exceptionally close similarity to their reference listed drugs in both average performance and variability, minimizing the risk of therapeutic failures or adverse events when patients switch between products.
International Variations in NTI Bioequivalence Standards
Currently, significant variations exist in bioequivalence approaches for NTI drugs among different regulatory agencies worldwide. These differences present challenges for global drug development and harmonization efforts [41]:
Health Canada uses the term "critical-dose drugs" and employs directly tightened bioequivalence limits of 90.0-112.0% for AUC.
European Medicines Agency (EMA) utilizes both "critical-dose drug" and "NTI drug" terms and tightens the acceptance range to 90.00-111.11% for AUC, and for Cmax when it is particularly important for safety, efficacy, or drug level monitoring.
Japan's PMDA maintains conventional bioequivalence limits of 80-125% for both AUC and Cmax for narrow therapeutic range drugs.
China's NMPA recommends a reference-scaled bioequivalence approach similar to the FDA for NTI drugs.
The International Council for Harmonisation (ICH) has recently adopted the first guideline in a series (ICH M13A) describing scientific and technical aspects of bioequivalence study design for immediate-release solid oral dosage forms. The forthcoming ICH M13C guideline is planned to include data analysis and bioequivalence assessment specifically for NTI drugs, potentially harmonizing standards across regions [41].
Table 2: Comparison of Bioequivalence Criteria for NTI Drugs Across Regulatory Agencies
| Regulatory Agency | Terminology | BE Limits for AUC | BE Limits for Cmax | Study Design |
|---|---|---|---|---|
| U.S. FDA | Narrow Therapeutic Index (NTI) Drugs | Reference-scaled (e.g., 90.00-111.11% when σWR=0.10) + 80.00-125.00% | Reference-scaled (e.g., 90.00-111.11% when σWR=0.10) + 80.00-125.00% | Fully replicated 4-period crossover |
| European Medicines Agency | NTI/Critical-Dose Drugs | 90.00-111.11% | 90.00-111.11% (when critical) | Typically 2-period crossover |
| Health Canada | Critical-Dose Drugs | 90.0-112.0% | 80.0-125.0% | Typically 2-period crossover |
| Japan PMDA | Narrow Therapeutic Range Drugs | 80.00-125.00% | 80.00-125.00% | Typically 2-period crossover |
Experimental Protocols for NTI Drug Bioequivalence Studies
Fully Replicated Crossover Study Design
The recommended bioequivalence study design for generic NTI drugs is a fully replicated, two-sequence, two-treatment, four-period crossover design [41]. This complex design requires each subject to receive both the test and reference products on two separate occasions, resulting in four total administration periods. The replication allows for precise estimation of within-subject variability for both products, which is essential for applying the reference-scaled bioequivalence approach.
The study protocol typically includes healthy adult volunteers who meet predefined inclusion and exclusion criteria. Key methodological considerations include:
Appropriate washout periods: Sufficient duration between treatment periods to ensure complete elimination of the drug before the next administration, typically based on at least 5-7 half-lives of the drug.
Standardized conditions: Administration of the drug under both fasting and fed conditions may be required unless specifically waived by the agency, as food effects can significantly impact the bioavailability of some NTI drugs.
Serial blood sampling: Intensive blood sample collection at predetermined time points following each drug administration to adequately characterize the concentration-time profile.
Validated bioanalytical methods: Use of fully validated analytical methods for quantification of drug concentrations in plasma samples, meeting established criteria for precision, accuracy, selectivity, and sensitivity.
The statistical analysis incorporates a linear mixed-effects model with fixed effects for sequence, period, and treatment, and a random effect for subject. The model estimates the within-subject variances for both test and reference products and calculates the reference-scaled average bioequivalence metrics [41].
Statistical Analysis Methodologies
The statistical approach for demonstrating bioequivalence for NTI drugs involves multiple complementary methods that must all be satisfied:
Reference-scaled average bioequivalence: This approach uses the within-subject variability of the reference product to set appropriately narrowed bioequivalence limits. The scaled average bioequivalence is determined using the formula:
- Scaled average bioequivalence bounds = exp(±k × sWR)
- Where k is a regulatory constant (typically 0.76 for NTI drugs) and sWR is the estimated within-subject standard deviation of the reference product [42].
Within-subject variability comparison: The test-to-reference ratio of within-subject standard deviations (sWT/sWR) is evaluated using an F-statistic approach. Equivalence is concluded when the upper limit of the 90% confidence interval for this ratio is ≤ 2.5.
Point estimate constraint: The geometric mean ratio (test/reference) must fall within the conventional range of 80.00-125.00%, and many regulators additionally require it to be within 90.00-111.11% for NTI drugs [41] [42].
This multi-pronged statistical approach ensures that generic NTI drugs are highly similar to their reference products in both average bioavailability and variability, providing an added layer of safety for these critical medications.
Research Reagents and Materials for NTI Drug Studies
Table 3: Essential Research Reagents and Materials for NTI Drug Bioequivalence Studies
| Reagent/Material | Function/Application | Specifications/Standards |
|---|---|---|
| Certified Reference Standards | Quantification of drug concentrations in biological matrices | >95% purity, structural confirmation by MS/NMR |
| Stable Isotope-Labeled Internal Standards | Bioanalytical method development and sample analysis | Isotopic purity >99%, minimum isotopic enrichment |
| Blank Biological Matrix | Preparation of calibration standards and quality control samples | Drug-free human plasma, screened for interfering substances |
| Solid-Phase Extraction Cartridges | Sample clean-up and analyte extraction | Appropriate sorbent chemistry for target drug molecule |
| Liquid Chromatography-Mass Spectrometry System | Bioanalytical quantification | Sufficient sensitivity, resolution, and dynamic range |
| Validated Statistical Software Packages | Data analysis and bioequivalence determination | SAS, R, or other software with mixed-effects modeling capability |
Impact of FDA NTI Criteria on Generic Drug Development
Application Success Rates and Common Challenges
The implementation of stricter bioequivalence standards for NTI drugs has significantly impacted the generic drug development landscape. A comprehensive survey of bioequivalence data from Abbreviated New Drug Applications (ANDAs) for NTI drugs submitted to the FDA between January 2013 and October 2022 revealed important patterns [41]:
Of 100 ANDAs for NTI drug products identified during this period, 93 were included in the final analysis after exclusions. The vast majority (87 ANDAs) utilized four-way crossover studies, comprising 69 fed and 106 fasting bioequivalence studies. Analysis of study outcomes revealed that the range of average within-subject standard deviation (SWR) for Cmax, AUCt, and AUCinf was between 0.05 and 0.27 across all NTI drugs, confirming the characteristically low within-subject variability of these products [41].
The analysis also identified reasons for bioequivalence study failures. Among the 20 studies that failed to meet bioequivalence criteria, the majority (90%) failed only the reference-scaled criteria, while 5% failed only the variability comparison criteria, and another 5% failed both criteria. This pattern highlights the reference-scaled criteria as the most significant hurdle in demonstrating bioequivalence for generic NTI drugs [41].
Progress in International Harmonization
The FDA actively participates in international harmonization efforts through organizations such as the International Council for Harmonisation of Technical Requirements for Pharmaceuticals for Human Use (ICH). The goal of these initiatives is to align standards across regulatory agencies, which would streamline industry interactions and reduce barriers to global market entry for generic NTI drugs [39] [41].
Recent research has proposed methodological refinements to address challenges in NTI drug bioequivalence assessment. A 2024 publication proposed a "mixed approach" combining fixed and scaled criteria with an adjusted significance level (α = 0.042) to reduce sample size requirements while maintaining appropriate type I error control [42]. Such methodological advances may inform future harmonization efforts and refine regulatory standards for these critical medications.
The identification and regulation of Narrow Therapeutic Index drugs represents a specialized and critical aspect of pharmaceutical development and regulation. The FDA's established criteria—focusing on the small separation between therapeutic and toxic doses, potential for serious outcomes from concentration deviations, requirement for therapeutic monitoring, low within-subject variability, and need for small dosage adjustments—provide a robust framework for classifying these high-risk medications.
The stringent bioequivalence standards for generic NTI drugs, including the fully replicated crossover study design, reference-scaled average bioequivalence approach, and within-subject variability comparison, ensure that generic versions perform nearly identically to their reference products in both average exposure and variability. While these requirements present development challenges, as evidenced by the failure patterns in submitted ANDAs, they are essential for maintaining patient safety when using these critical medications.
Ongoing international harmonization efforts and continuing research into refined statistical approaches promise to further strengthen the regulatory landscape for NTI drugs. For researchers and drug development professionals, understanding these criteria and methodologies is essential for the successful development of both innovator and generic NTI drug products that meet the FDA's rigorous standards for safety and efficacy.
The therapeutic index (TI) is a fundamental concept in pharmacology, providing a quantitative measure of a drug's relative safety. It is classically defined as the ratio between the dose that produces toxicity in 50% of the population (TD₅₀) and the dose that elicits a therapeutic response in 50% of the population (ED₅₀), expressed as TI = TD₅₀ / ED₅₀ [5] [1]. In early drug development, the lethal dose for 50% of the population (LD₅₀) is often used in animal studies, giving TI = LD₅₀ / ED₅₀ [5]. A higher therapeutic index indicates a wider margin between effective and toxic doses, which is highly desirable from a clinical safety perspective [1].
For drugs with a narrow therapeutic index, small variations in drug exposure can lead to therapeutic failure or severe toxicity. This challenge is magnified by significant inter-patient variability, where the same drug dose results in substantially different systemic exposures and clinical outcomes across individuals [43]. This article examines the sources and implications of inter-patient variability and explores advanced methodologies to mitigate the risk of therapeutic failure.
The Critical Role of the Therapeutic Index
Defining Safety and Efficacy-Based Therapeutic Indices
The therapeutic index can be interpreted through two primary lenses, summarized in the table below.
Table 1: Types of Therapeutic Indices
| Index Type | Formula | Interpretation | Desirable Value |
|---|---|---|---|
| Safety-Based TI | TI_safety = LD₅₀ / ED₅₀ |
Measures the margin between lethal and effective doses [1]. | Higher value indicates a wider safety window [1]. |
| Efficacy-Based TI | TI_efficacy = ED₅₀ / TD₅₀ |
Measures the margin between effective and toxic doses [1]. | Lower value indicates a wider therapeutic window [1]. |
A related metric, the Protective Index (PI = TD₅₀ / ED₅₀), is often more informative than the safety-based TI, as it uses the median toxic dose (TD₅₀) instead of the lethal dose (LD₅₀), acknowledging that significant toxicity often occurs at doses far below lethality [1].
Clinical Implications of a Narrow Therapeutic Index
Drugs with a narrow therapeutic range pose significant clinical challenges. The following diagram illustrates the critical relationship between dose, population response, and the therapeutic window.
For such drugs, standard dosing often results in sub-therapeutic exposure in some patients and toxic exposure in others [43]. Consequently, therapeutic drug monitoring (TDM) is frequently required to individualize treatment and maintain plasma concentrations within the therapeutic window [1]. Examples of drugs with narrow therapeutic indices include digoxin (TI ~2:1), warfarin, lithium, and the anticancer drug irinotecan [44] [1].
Underlying Mechanisms of Variability
Inter-patient variability in drug response stems from complex interactions among genetic, physiological, pathophysiological, and environmental factors that influence pharmacokinetics (PK) and pharmacodynamics (PD).
Table 2: Major Sources of Inter-patient Variability in Drug Response
| Source Category | Specific Factors | Impact on PK/PD |
|---|---|---|
| Genetic Factors | Polymorphisms in drug-metabolizing enzymes (e.g., CYP2C9, CYP2C19, CYP2D6, CYP3A4) and drug transporters [44] [45]. | Alter drug metabolism, leading to poor, intermediate, extensive, or ultra-rapid metabolizer phenotypes. This significantly affects exposure and toxicity risk [44]. |
| Physiological & Pathophysiological Factors | Age, organ function (liver, kidney), body composition, plasma protein levels (e.g., albumin), disease state [46] [45]. | Affect drug absorption, distribution, metabolism, and excretion. For example, reduced organ function can decrease drug clearance, increasing exposure [46]. |
| Drug Formulation | Conventional small molecule vs. complex delivery systems (e.g., liposomal formulations) [43]. | Liposomal agents exhibit significantly higher inter-patient PK variability (2.7-fold greater AUC CV%) than small-molecule drugs due to factors like MPS-driven clearance [43]. |
| Environmental & Lifestyle | Drug-drug interactions (DDIs), diet, smoking [45]. | Smoking induces CYP1A2, which can increase the metabolism of drugs like osimertinib, reducing their efficacy [45]. |
Quantitative Evidence of Variability
A meta-analysis comparing liposomal and small-molecule (SM) anticancer agents provides stark evidence of inter-patient variability. The analysis found that the coefficient of variation (CV%) for the area under the curve (AUC) was 2.7-fold greater for liposomal formulations compared to their small-molecule counterparts [43]. Furthermore, the range between maximum and minimum AUC (AUC~max~/AUC~min~) was 16.7-fold greater for liposomal drugs, highlighting the extreme differences in exposure that can occur between patients receiving the same dose [43].
For the drug osimertinib, used in non-small cell lung cancer (NSCLC), inter-patient variability in pharmacokinetics is exceptionally high, with a percentage coefficient of variation (%CV) exceeding 50% and often surpassing 80% [45]. This variability is driven by factors including genetic polymorphisms in CYP3A4, variations in CYP1A2 expression (influenced by smoking status), and differences in plasma albumin levels, which affect the free fraction of the highly protein-bound drug [45].
Methodologies for Quantifying and Managing Variability
Physiologically Based Pharmacokinetic (PBPK) Modeling
PBPK modeling is a powerful computational technique that integrates drug-specific properties (e.g., solubility, permeability) and population-specific physiological parameters (e.g., organ volumes, blood flow, enzyme expression) to predict drug concentration-time profiles in plasma and tissues [45].
Table 3: Key Research Reagents and Solutions for PBPK Modeling and Variability Assessment
| Reagent/Solution | Function/Application | Example in Research |
|---|---|---|
| PBPK Software Platform | Provides the computational framework for building, simulating, and validating PBPK models. | PK-Sim was used to develop a population PBPK model for osimertinib in Caucasian, Japanese, and Chinese populations [45]. |
| Clinical PK Data | Used as observed data to validate and refine the PBPK model predictions. | Mean AUC and C~max~ data from phase I clinical studies were used to validate the osimertinib model, with prediction/observation ratios of 0.8-1.25 considered acceptable [45]. |
| Probe Substrates | Drugs used to phenotype individuals for specific metabolic enzyme activities. | Administration of a probe drug to measure metabolic ratios (e.g., for CYP2D6 or CYP2C19) helps establish population distributions of metabolic capacity for the model [47]. |
| Genotyping Assays | Identify genetic polymorphisms that cause variability in drug metabolism or transport. | DNA sequencing and PCR-based tests for variants in genes like CYP2C9 and VKORC1 inform warfarin dosing algorithms [44] [47]. |
Experimental Protocol: Developing and Validating a Population PBPK Model
- Model Development: Input drug-specific parameters (molecular weight, logP, f~up~, K~p~~lu,p~) and in vitro data on enzyme kinetics (K~m~, V~max~) into the software [45].
- Incorporating Variability: Define system-specific parameters for the target population, including demographic data, genetic allele frequencies for key enzymes (e.g., CYP3A41B, CYP3A53), and physiological data (e.g., liver volume, albumin levels) [45].
- Model Validation: Simulate clinical PK studies (single and multiple dose) and compare the predicted AUC, C~max~, and C~trough~ values to the observed clinical data. The model is considered validated if the prediction/observation ratios fall within 0.8-1.25 [45].
- Simulation and Application: Use the validated model to simulate various clinical scenarios, such as assessing the impact of drug-drug interactions, renal impairment, or different dosing regimens on drug exposure and target engagement across virtual populations [45].
The workflow for a PBPK study, from development to clinical application, is illustrated below.
Pharmacogenetic Testing
Pharmacogenetics aims to personalize therapy based on an individual's genetic profile. Clinical guidelines now exist for applying pharmacogenetic results to optimize the use of dozens of drugs [44].
Experimental Protocol: Implementing a Pharmacogenetic Study
- Genotype/Phenotype Correlation: Identify a candidate gene (e.g., a drug-metabolizing enzyme) and recruit patients undergoing treatment with the relevant drug.
- Genotyping: Extract DNA from patient blood or saliva samples. Use techniques like PCR, DNA microarrays, or next-generation sequencing (NGS) to identify specific genetic variants (e.g., CYP2C9*2, *3 for warfarin) [47].
- Phenotyping: Collect PK/PD data from the same patients, including drug and metabolite concentrations in plasma, clinical efficacy endpoints, and records of adverse drug reactions.
- Statistical Analysis: Correlate genotype with phenotype (e.g., compare average drug clearance or required maintenance dose across different genotype groups) to establish clinically actionable associations [44] [47].
Case Study: Osimertinib and the Path to Optimal Dosing
Osimertinib, a drug for EGFR-mutant NSCLC, exemplifies the challenges and solutions for managing inter-patient variability. Its metabolism primarily depends on CYP3A4 and CYP1A2, and it is highly protein-bound [45]. A validated PBPK model revealed that plasma exposure is approximately two-fold higher in patients than in healthy individuals and higher in Caucasians compared to Japanese and Chinese populations, primarily due to differences in clearance [45]. The model identified CYP3A4 polymorphism, plasma albumin level, and CYP1A2 expression as the most sensitive factors driving PK variability.
Based on these findings, PBPK simulations were used to determine the optimal dosing regimen. The model suggested that 80 mg once daily achieves the target plasma C~trough~ (328-677 nmol/L) across Caucasian, Japanese, and Chinese populations, and provides desirable pulmonary EGFRm+ inhibition (>80%) [45]. This case demonstrates how modeling can account for ethnic and inter-patient variability to guide precise dosing.
Inter-patient variability presents a major obstacle to therapeutic success, particularly for drugs with a narrow therapeutic index. This variability, stemming from genetic, physiological, and formulation-related factors, can lead to a >10-fold difference in drug exposure between individuals, resulting in unacceptable rates of therapeutic failure and toxicity [43].
Addressing this challenge requires a multi-faceted approach. PBPK modeling has emerged as a critical tool for deconstructing the sources of variability and simulating optimal dosing strategies in silico before clinical implementation. Concurrently, pharmacogenetic testing provides a direct path to personalizing prescriptions for specific high-risk genetic polymorphisms. The future of drug development and clinical practice lies in the integration of these methodologies into a model-informed precision dosing framework. By moving beyond the "one-dose-fits-all" paradigm, healthcare providers can maximize therapeutic efficacy and minimize the risk of harm, thereby effectively widening the therapeutic index for the individual patient.
The therapeutic index (TI) is a quantitative measurement of the relative safety of a drug, providing a critical foundation for therapeutic drug monitoring and dose titration strategies in clinical practice and drug development. This ratio compares the dose or blood concentration at which a drug becomes toxic to the dose or concentration at which it produces the desired therapeutic effect [3] [1]. Specifically, the classical therapeutic index is calculated as the ratio of the dose that causes toxicity in 50% of the population (TD50) to the dose that produces a therapeutic response in 50% of the population (ED50), expressed as TI = TD50/ED50 [3]. For drugs used in lethal contexts or in animal research, the lethal dose for 50% of the population (LD50) may be substituted for TD50, resulting in TI = LD50/ED50 [1].
The U.S. Food and Drug Administration (FDA) has specifically defined narrow therapeutic index (NTI) drugs as "those drugs where small differences in dose or blood concentration may lead to serious therapeutic failures and/or adverse drug reactions that are life-threatening or result in persistent or significant disability or incapacity" [40]. This narrow window between efficacy and toxicity presents significant clinical challenges, necessitating sophisticated management strategies including rigorous therapeutic drug monitoring and careful dose titration to optimize patient outcomes while minimizing risks.
Table 1: Types of Therapeutic Index Calculations
| Index Type | Calculation Formula | Interpretation | Primary Application |
|---|---|---|---|
| Safety-based Therapeutic Index | TI = LD50/ED50 | Higher values indicate wider safety margin | Preclinical drug development |
| Efficacy-based Therapeutic Index | TI = ED50/TD50 | Lower values indicate wider therapeutic window | Clinical development |
| Protective Index | PI = TD50/ED50 | Higher values indicate better safety profile | Clinical toxicology |
Fundamental Principles of Therapeutic Index Calculations
Therapeutic index calculations are grounded in dose-response relationships and population-level pharmacokinetic data. The effective dose (ED50) represents the dose at which 50% of the population exhibits the desired therapeutic response, while the toxic dose (TD50) represents the dose at which 50% of the population experiences toxic effects [1]. In animal studies, the lethal dose (LD50) may be used instead of TD50 [3]. The resulting therapeutic index provides a numerical value that helps clinicians and researchers assess a drug's safety margin.
Drugs with a high therapeutic index (generally >10) have a wide margin of safety, meaning there is a substantial difference between the therapeutic and toxic doses. Examples include penicillin (with an extremely high TI) and diazepam (TI of 100:1) [3] [1]. Conversely, drugs with a low or narrow therapeutic index (generally <10) have a small safety margin, where minor increases in dose or blood concentration can lead to toxic effects. Examples include warfarin, lithium, digoxin (TI ~2:1), theophylline, and gentamicin [3] [1]. The clinical implication of this distinction is profound: NTI drugs require more careful monitoring, smaller dosage adjustments, and often individualized dosing based on therapeutic drug monitoring.
It is important to recognize that the therapeutic index is a population-based statistic and does not account for individual patient variability in drug metabolism, drug-drug interactions, or genetic polymorphisms that may affect drug response. Furthermore, modern pharmacokinetics emphasizes that drug exposure (concentration over time) rather than dose alone drives both therapeutic and toxicological effects [1]. This understanding has led to the concept of the therapeutic window - the range of drug concentrations that provides optimal efficacy with minimal toxicity - which provides a more practical framework for clinical dose individualization than the theoretical TI [1].
Therapeutic Index Calculation Pathway
Narrow Therapeutic Index (NTI) Drugs: Identification and Regulatory Considerations
The FDA has established specific criteria for classifying drugs as having a narrow therapeutic index, recognizing that these medications require specialized regulatory and clinical approaches. As of January 2024, the FDA has identified 33 drug products containing 14 distinct active ingredients as NTI drugs in their respective product-specific guidances (PSGs) for generic drug development [40]. These drugs share several characteristic features: small separation between therapeutic and toxic concentrations, low-to-moderate within-subject variability (typically <30%), and the clinical practice of making small dose adjustments (often less than 20%) based on therapeutic monitoring of pharmacokinetic or pharmacodynamic parameters [41].
The regulatory approach to NTI drugs involves stricter bioequivalence standards for generic versions. The FDA recommends a fully replicated, two-sequence, two-treatment, four-period crossover study design where bioequivalence must be demonstrated using both reference-scaled average bioequivalence criteria and within-subject variability comparison criteria, in addition to conventional average bioequivalence limits of 80.00-125.00% [41]. When the within-subject standard deviation for the reference drug (σWR) is 0.10, the bioequivalence limits are tightened to 90.00-111.11%, with these limits adjusting based on variability while never exceeding 80.00-125.00% [41]. This stringent approach ensures that generic NTI drugs demonstrate highly consistent pharmacokinetic profiles compared to their reference counterparts, minimizing the risk of therapeutic failure or toxicity in patients switched between products.
Table 2: Examples of Narrow Therapeutic Index Drugs and Their Therapeutic Ranges
| Drug | Therapeutic Index | Primary Clinical Use | Therapeutic Range | Toxic Manifestations |
|---|---|---|---|---|
| Digoxin | ~2:1 [1] | Heart failure, atrial fibrillation | 0.5-2.0 ng/mL [1] | Cardiac arrhythmias, nausea, visual disturbances |
| Warfarin | Narrow [3] | Anticoagulation | INR 2.0-3.0 (most indications) | Bleeding, hemorrhage |
| Lithium | Narrow [3] | Bipolar disorder | 0.6-1.2 mEq/L | Tremor, polyuria, cognitive impairment, renal toxicity |
| Theophylline | Narrow [3] [40] | Asthma, COPD | 10-20 mcg/mL [40] | Nausea, tachycardia, seizures |
| Tacrolimus | Narrow [48] | Immunosuppression post-transplantation | Variable based on transplant type & time | Nephrotoxicity, neurotoxicity, diabetes |
| Vancomycin | Narrow [49] | Antibiotic for Gram-positive infections | AUC/MIC 400-650 mg·h/L [49] | Nephrotoxicity, ototoxicity |
Therapeutic Drug Monitoring: Methodologies and Protocols
Therapeutic drug monitoring represents a critical strategy for managing NTI drugs, enabling clinicians to individualize dosing regimens based on measured drug concentrations and relevant patient factors. TDM involves the precise measurement of drug concentrations in biological fluids (typically blood or plasma) at predetermined time points, interpretation of the results in the context of the patient's clinical status, and subsequent dose adjustment to optimize therapeutic outcomes while minimizing adverse effects [49] [48].
The vancomycin TDM protocol exemplifies a sophisticated approach to NTI drug monitoring. Current guidelines recommend targeting an area under the curve to minimum inhibitory concentration ratio (AUC/MIC) of 400-650 mg·h/L for vancomycin, moving away from the traditional trough-only monitoring (previously 15-20 mg/L) due to superior correlation with both efficacy and nephrotoxicity risk [49]. The experimental protocol involves collecting blood samples for peak concentration (30-60 minutes after the end of infusion) and trough concentration (30-60 minutes before the next dose), typically at steady-state (after 3-4 doses) [49]. These concentrations are then used to calculate the 24-hour AUC using validated methods, such as the "Vancomycin AUC24 Calculator" in the "Sanford Guide to Antimicrobial Therapy" mobile application [49]. Dose adjustments are made based on the calculated AUC, with research demonstrating that AUC-guided monitoring significantly reduces acute kidney injury incidence compared to trough-guided approaches [49].
For tacrolimus, TDM represents a cornerstone of post-transplant care due to its narrow therapeutic index and high inter- and intra-patient variability [48]. The standard monitoring approach involves measuring pre-dose trough concentrations (C0), though this has limitations in accurately reflecting total drug exposure [48]. More advanced approaches involve simplified AUC measurements using limited sampling strategies, typically involving 3-4 samples over the dosing interval to estimate full AUC while minimizing patient burden [48]. The protocol includes collecting blood samples at precisely timed intervals (e.g., pre-dose, 1-hour, 2-hour, and 4-hour post-dose), analyzing concentrations using validated immunoassays or chromatographic methods, and employing Bayesian forecasting to estimate individual pharmacokinetic parameters for dose individualization [48].
TDM Workflow for NTI Drugs
Advanced Dose Individualization Strategies
Beyond conventional TDM, several advanced methodologies have emerged to enhance dose individualization for NTI drugs, particularly for medications with complex pharmacokinetics like tacrolimus. Population pharmacokinetic (PopPK) modeling represents a sophisticated approach that characterizes the typical pharmacokinetic parameters in a population, identifies sources of variability, and quantifies the impact of covariates such as age, weight, organ function, and genetic polymorphisms [48]. These models enable Bayesian forecasting, where limited therapeutic drug monitoring data from an individual patient can be combined with the population model to estimate individual pharmacokinetic parameters and optimize dosing regimens.
Physiologically-based pharmacokinetic (PBPK) modeling provides a mechanistic framework for predicting drug absorption, distribution, metabolism, and excretion based on compound properties and human physiology [48]. For tacrolimus, PBPK models incorporate factors such as intestinal CYP3A and P-glycoprotein activity, hepatic metabolism, and erythrocyte binding to simulate drug exposure under various conditions [48]. These models are particularly valuable for predicting drug-drug interactions and the impact of organ dysfunction on drug disposition.
Emerging approaches include machine learning and artificial intelligence technologies that integrate diverse patient data (demographic, clinical, genetic, therapeutic drug monitoring results) to develop predictive models for optimal dosing [48]. These data-driven approaches can identify complex, non-linear relationships that may not be captured by traditional pharmacokinetic models. However, a significant challenge remains the translation of these sophisticated methodologies into clinically accessible tools that can be readily used by healthcare professionals without specialized pharmacokinetic expertise [48].
Table 3: Research Reagent Solutions for TDM and Dose Individualization Studies
| Reagent/Technology | Function | Application Examples |
|---|---|---|
| LC-MS/MS (Liquid Chromatography-Tandem Mass Spectrometry) | High-sensitivity drug concentration measurement | Vancomycin, tacrolimus TDM [49] [48] |
| CYP3A5 Genotyping Assays | Identification of genetic polymorphisms affecting drug metabolism | Tacrolimus dose prediction (CYP3A5*3 vs *1) [48] |
| Population PK Modeling Software (e.g., NONMEM, Monolix) | Development of population pharmacokinetic models | Tacrolimus dose individualization [48] |
| Bayesian Forecasting Tools | Integration of population models with individual TDM data | Adaptive dose control for NTI drugs [48] |
| PBPK Modeling Platforms (e.g., GastroPlus, Simcyp) | Mechanistic prediction of drug disposition | Predicting drug-drug interactions for NTI drugs [48] |
| AUC Calculation Applications | Estimation of area under the curve from limited samples | Vancomycin AUC-guided dosing [49] |
Experimental Protocols for TDM and Bioequivalence Studies
Vancomycin AUC Monitoring Protocol
The following detailed protocol outlines the methodology for vancomycin therapeutic drug monitoring based on area under the curve assessment, as referenced in the search results [49]:
Drug Administration: Administer vancomycin intravenously with a loading dose of 20-30 mg/kg (actual body weight), followed by maintenance doses of 15-20 mg/kg every 8-12 hours in patients with normal renal function.
Sample Collection Timing: Collect samples after steady-state is achieved (typically after the 3rd or 4th dose). For peak concentration: collect 30-60 minutes after the end of infusion. For trough concentration: collect 30-60 minutes before the next dose. If this timing is not feasible, collect peak sample 30-60 minutes after any subsequent dose infusion and trough sample 30-60 minutes before the following dose.
Sample Processing: Collect blood in EDTA-containing tubes, centrifuge at 4000 rpm for 5 minutes, and store plasma at -20°C until analysis.
Analytical Method: Analyze vancomycin concentrations using validated liquid chromatography-triple quadrupole mass spectrometry (LC-MS/MS). The system should consist of LC-20AD pumps, SIL-20AC/XR auto-sampler, CTO-10ASVP column oven, DGU-20A/3R degassing unit, Agilent C18 column, and triple quadrupole mass spectrometer LCMS-8040.
AUC Calculation: Input the following parameters into the "Vancomycin AUC24Calculator": dose (mg), dose interval (hours), infusion time (hours), measured peak concentration (mg/L), time from infusion start to peak concentration measurement (hours), measured trough concentration (mg/L), time from infusion start to trough concentration measurement (hours).
Dose Adjustment: Adjust vancomycin dose to achieve target AUC of 400-650 mg·h/L. For serious infections (e.g., meningitis, pneumonia, bacteremia), target the higher end of the range (450-650 mg·h/L).
Bioequivalence Study Protocol for NTI Drugs
For generic NTI drug development, the FDA recommends a specific bioequivalence study protocol [41]:
Study Design: Employ a fully replicated, two-sequence, two-treatment, four-period crossover design where each participant receives both the test and reference products on two separate occasions.
Participant Selection: Enroll healthy volunteers or patients (depending on drug safety profile) with sample size sufficient to achieve adequate statistical power, typically considering the low within-subject variability of NTI drugs.
Dosing and Sampling: Administer single doses of test and reference formulations under fasting conditions (and fed conditions if relevant). Collect serial blood samples sufficient to adequately characterize the concentration-time profile, typically including 12-18 samples over 3-5 elimination half-lives.
Analytical Methodology: Use validated bioanalytical methods (preferably LC-MS/MS) meeting FDA guidance criteria for selectivity, sensitivity, accuracy, precision, and reproducibility.
Statistical Analysis: Calculate the following parameters for both test and reference formulations: Cmax, AUC0-t, AUC0-∞. Perform analysis of variance (ANOVA) and compute 90% confidence intervals for the geometric mean ratio of test/reference for Cmax and AUC parameters. Apply both reference-scaled average bioequivalence criteria and within-subject variability comparison criteria in addition to conventional average bioequivalence limits of 80.00-125.00%.
Acceptance Criteria: Demonstrate that the 90% confidence intervals for both Cmax and AUC fall within the tightened limits based on reference-scaled approach (typically approaching 90.00-111.11% when within-subject variability is low) while also passing the variability comparison (σWT/σWR ratio ≤ 2.5).
Therapeutic drug monitoring and dose titration represent essential components of precision medicine for narrow therapeutic index drugs, where the margin between efficacy and toxicity is critically small. The foundation of these strategies rests on a thorough understanding of the therapeutic index and its calculation, which provides the theoretical framework for individualized dosing approaches. Advanced methodologies, including population pharmacokinetics, Bayesian forecasting, and physiologically-based pharmacokinetic modeling, are increasingly enhancing our ability to optimize NTI drug therapy. Furthermore, the stringent regulatory requirements for generic NTI drugs ensure that these high-risk medications maintain consistent pharmacokinetic profiles across different products. As therapeutic drug monitoring continues to evolve, the integration of pharmacogenetic data, sophisticated modeling techniques, and user-friendly clinical decision support tools will further advance our capacity to individualize therapy for NTI drugs, ultimately improving patient outcomes while minimizing the risk of serious adverse events.
Impact of Drug-Drug Interactions and Pharmacogenomics on NTI Drugs
Narrow Therapeutic Index (NTI) drugs are medications where the dose or blood concentration range for desired therapeutic effects is very close to the range where serious adverse reactions or therapeutic failures occur [15] [39]. This narrow window presents substantial clinical challenges, as small differences in dose or blood concentration may lead to dangerous treatment outcomes, including life-threatening toxicity or lack of efficacy [39]. For drug development professionals and researchers, understanding and managing the impact of drug-drug interactions (DDIs) and pharmacogenomics (PGx) on NTI drugs is critical for patient safety and therapeutic success.
The therapeutic index (TI) is fundamentally a measure of drug safety, traditionally calculated in preclinical studies as the ratio between the lethal dose (LD50) and the median effective dose (ED50), or TI = LD50/ED50 [15]. In clinical practice, this translates to the range between the minimum toxic concentration (MTC) and minimum effective concentration (MEC) in the blood [15]. The U.S. Food and Drug Administration (FDA) defines a drug as having an NTI when there is less than a twofold difference in LD50 and ED50 values or less than a twofold difference between MTC and MEC in blood, and where safe use requires careful titration and patient monitoring [15]. Examples of NTI drugs include warfarin, levothyroxine, flecainide, phenytoin, carbamazepine, lithium, and digoxin [39] [50].
Therapeutic Index Fundamentals and Regulatory Considerations
Defining and Calculating Therapeutic Index
The therapeutic index represents a critical pharmacokinetic and pharmacodynamic concept in drug development and clinical pharmacology. The concentration-response relationship for NTI drugs is typically steep for both efficacy and toxicity, meaning that small changes in plasma drug concentrations can precipitate significant clinical consequences [15]. This relationship is illustrated in Table 1, which compares the characteristics of NTI and non-NTI drugs.
Table 1: Characteristics of NTI vs. Non-NTI Drugs
| Characteristic | NTI Drugs | Non-NTI Drugs |
|---|---|---|
| Separation between therapeutic and toxic doses | Minimal | Substantial |
| Consequence of small dose changes | Potentially serious therapeutic failure or toxicity | Generally tolerable |
| Therapeutic drug monitoring requirement | Usually required | Less frequently required |
| Dose adjustment increments | Often very small | Typically standard increments |
| Within-subject variability | Low | Variable |
| Bioequivalence standards for generics | Stricter criteria | Standard 80-125% criteria |
NTI drugs are disproportionately associated with drug-related problems (DRPs) in clinical practice. A prospective study of 827 hospitalized patients found that DRPs were significantly more frequent with NTI drugs (40%) compared to non-NTI drugs (19%) [50]. The drug risk ratio (number of DRPs divided by number of times the drug was used) was 0.50 for NTI drugs versus 0.20 for non-NTI drugs [50]. Specific DRP categories particularly prevalent with NTI drugs included non-optimal dose, drug interaction, and need for monitoring [50].
Regulatory Standards for NTI Drugs
Regulatory agencies worldwide have established stricter bioequivalence (BE) criteria for generic NTI drugs compared to non-NTI drugs due to their critical safety profile [15] [51] [39]. While standard BE criteria typically require 90% confidence intervals for the ratio of test/reference geometric means for AUC and Cmax to fall within 80.00-125.00%, regulatory agencies often apply tighter BE standards for NTI drugs [15] [51].
The FDA has implemented specific approaches to ensure the quality and equivalence of generic NTI drugs, recognizing that the lower cost of generics can enhance medication adherence and improve patient outcomes [39]. The CDER NTI Drug Working Group assesses approved drugs and new drug applications for NTI designation, examining the relationship of drug exposure to efficacy and serious side effects [39]. When only a small increase in drug exposure causes serious side effects, further evaluation is conducted before designating a drug as having an NTI [39].
Recent research has focused on harmonizing BE standards globally. A 2025 proposal for alternative FDA BE criteria for NTI drugs suggests capping the minimum BE limits, applying alpha adjustment, and implementing point estimate constraints to better ensure therapeutic equivalence [51]. This alignment with the International Council for Harmonisation (ICH) M13's goal of harmonizing BE standards internationally represents an important advancement in regulatory science for NTI drugs [51].
Complex Interactions: How DDIs and Pharmacogenomics Impact NTI Drugs
Drug-Drug-Gene Interactions (DDGIs)
The convergence of polypharmacy and genetic variation creates particularly challenging scenarios for NTI drugs. Traditional DDI screening approaches often ignore individual genetic variation, which can markedly alter the severity of these interactions [52]. The emerging concept of drug-drug-gene interactions (DDGIs) represents a critical framework for understanding how perpetrator drugs and genetic polymorphisms combine to affect drug metabolism and response [53] [52].
DDGIs can be categorized into three main mechanistic classes:
- Inhibitory DDGIs: Both the perpetrator drug and genetic variants reduce metabolic enzyme activity
- Induction DDGIs: Both the perpetrator drug and genetic variants increase metabolic enzyme activity
- Phenoconversion: The perpetrator drug effect opposes the genetic predisposition, causing a temporary phenotype shift [52]
The clinical impact of these interactions is substantial. Research has shown that considering genetic variants in just three drug-metabolizing enzymes (CYP2C9, CYP2C19, and CYP2D6) increases the number of predicted clinically critical drug interactions by approximately 51% [52]. In patients with non-ST elevation myocardial infarction, 77.1% had identifiable drug-gene interactions, with 26.3% classified as substantial DDGIs [53].
Table 2: Clinical Evidence for Drug-Drug-Gene Interactions with NTI Drugs
| NTI Drug | Interacting Drug | Gene Involved | Clinical Effect |
|---|---|---|---|
| Warfarin | Simvastatin | CYP2C9 | Greater reduction in warfarin dose requirements in CYP2C9*3 carriers (29% vs 5% in noncarriers) [52] |
| Warfarin | Celecoxib | CYP2C9 | Enhanced interaction in CYP2C9 variant carriers [52] |
| Clopidogrel | Proton Pump Inhibitors | CYP2C19 | Reduced clopidogrel efficacy in CYP2C192/3 carriers [52] |
| Clopidogrel | Calcium Channel Blockers | CYP3A4/CYP2C19 | Additive reduction in efficacy with multiple inhibitors [52] |
| Voriconazole | Atazanavir/Ritonavir | CYP2C19/CYP3A4 | ~5.6-fold increase in bioavailability with combined enzyme inhibition [52] |
Phenoconversion: When Pharmacology Overrides Genetics
Phenoconversion represents a particularly complex interaction phenomenon wherein a temporary phenotype shift occurs due to a mismatch between an individual's genotype-based prediction of drug metabolism and their true metabolic capacity due to nongenetic factors such as comedication [53]. This phenomenon explains why a patient's observable phenotype may not match their genetic phenotype when inhibitors or inducers of drug-metabolizing enzymes are added to therapy [53].
For NTI drugs, phenoconversion can have serious clinical consequences. For example, proton pump inhibitors (CYP2C19 inhibitors) administered with clopidogrel can cause phenoconversion in genetically determined ultra-rapid metabolizers to a poor metabolizer status, resulting in loss of clopidogrel efficacy [52]. Conversely, the presence of reduced function CYP2C9 variants results in reduced tolbutamide metabolism, yet co-treatment with rifampicin (a CYP2C19 inducer) reverses this genetic effect, resulting in a twofold increase in tolbutamide clearance [52].
Interestingly, phenoconversion can sometimes be used therapeutically. Resistance to nortriptyline due to abnormally rapid metabolism in CYP2D6 ultrarapid metabolizers has been successfully reversed by adding paroxetine (a CYP2D6 inhibitor), which normalizes nortriptyline plasma levels [52].
The following diagram illustrates the complex relationships between drugs, drug interactions, genetics, and their combined impact on NTI drug safety and efficacy:
Methodological Approaches: Experimental Protocols and Biomarkers
Assessing DDGI and Phenoconversion: Experimental Framework
Research into DDGIs and their impact on NTI drugs requires sophisticated study designs that simultaneously account for pharmacological and genetic variables. The following protocol outlines a comprehensive approach for investigating these complex interactions:
Protocol 1: Clinical Assessment of DDGIs and Phenoconversion
Patient Stratification and Genotyping
- Recruit patients based on specific PGx profiles (e.g., CYP2C9, CYP2C19, CYP2D6, TPMT polymorphisms) relevant to the NTI drug under investigation [53] [52]
- Perform genotype-to-phenotype translation using established activity score systems [53]
- Stratify participants into predefined phenotype categories: poor (PM), intermediate (IM), normal (NM), and ultrarapid metabolizers (UM) [53]
Drug Administration and Pharmacokinetic Sampling
- Administer the NTI drug (victim drug) at standard therapeutic doses
- Implement perpetrator drug challenges using known inhibitors or inducers (e.g., fluconazole for CYP2C9 inhibition, rifampin for induction) [52]
- Collect intensive plasma samples over multiple elimination half-lives to characterize pharmacokinetic parameters (AUC, Cmax, Tmax, t½) [15]
Phenoconversion Assessment
- Calculate metabolic ratios (parent drug/metabolite) at baseline and during perpetrator drug challenge [53]
- Determine phenotype before and during perpetrator drug administration
- Identify phenoconversion when genotype-predicted phenotype differs from observed metabolic phenotype during drug challenge [53] [52]
Statistical Analysis and Modeling
- Employ population pharmacokinetic modeling to quantify the effects of genetic polymorphisms and drug interactions [53]
- Use linear mixed-effects models to account for within-subject variability
- Calculate the magnitude of interaction using geometric mean ratios (GMR) with 90% confidence intervals for AUC and Cmax [15]
Biomarker Applications in NTI Drug Development and Monitoring
Biomarkers play an increasingly important role in the development and monitoring of NTI drugs, serving as objective, systematic, and precise measurements of biological processes [54]. The ideal biomarker should be easy to measure, cost-effective, and provide high sensitivity and specificity for the condition or drug effect being monitored [54].
The Predictive Safety Testing Consortium (PSTC), a collaborative initiative between pharmaceutical companies and regulatory agencies, has made significant advances in qualifying novel safety biomarkers for drug development [55]. These biomarkers enable more specific and sensitive detection of drug-induced organ injury, which is particularly critical for NTI drugs where toxicity is a major concern [55].
Table 3: Qualified Safety Biomarkers for NTI Drug Development
| Biomarker Category | Specific Biomarkers | Qualified Context of Use | Regulatory Status |
|---|---|---|---|
| Kidney Safety | Clusterin, Cystatin-C, KIM-1, NAG, NGAL, Osteopontin | Detection of drug-induced kidney tubular injury in Phase 1 trials with healthy volunteers | FDA-qualified (2018) as composite measure [55] |
| Liver Safety | Glutamate Dehydrogenase (GLDH) | Detection of drug-induced liver injury, especially in patients with muscle injury confounding standard tests | FDA-qualified [55] |
| Rodent Kidney Safety | KIM-1, Albumin, Total Protein, β2-microglobulin, Cystatin C, Clusterin, Trefoil Factor-3 | Nonclinical prediction of drug safety in rat studies | Qualified by FDA, EMA, and PMDA [55] |
| Pancreatic Safety | miR-216a, miR-216b, miR-217, miR-375 | Detection of drug-induced pancreatic injury in Phase 1 trials | FDA Letter of Support encouraging further study [55] |
The validation of biomarkers follows a structured approach with six progressive steps: proof of concept, prospective validation, incremental value demonstration, clinical utility, improved clinical outcomes, and cost-effectiveness [54]. For NTI drugs, biomarkers can be particularly valuable in therapeutic drug monitoring (TDM), where they provide additional information beyond standard plasma drug concentration measurements [54].
Essential Research Tools and Reagents
Research into DDIs and PGx effects on NTI drugs requires specialized reagents and methodologies. The following toolkit outlines critical resources for investigators in this field:
Table 4: Research Reagent Solutions for NTI Drug Studies
| Research Tool Category | Specific Examples | Research Application |
|---|---|---|
| Genotyping Platforms | CYP2C92/3, CYP2C192/17, CYP2D64/10, VKORC1, TPMT assays | Patient stratification based on pharmacogenomic profiles [53] [52] [56] |
| Analytical Standards | Certified reference standards for NTI drugs and metabolites (warfarin, digoxin, flecainide, etc.) | Quantitative bioanalytical method development and validation [15] |
| Biomarker Assays | KIM-1, NGAL, Cystatin C, GLDH ELISA/kits; miRNA panels for pancreatic injury | Assessment of drug-induced organ injury in nonclinical and clinical studies [55] [54] |
| Transporter Assays | OATP1B1, P-glycoprotein, BCRP inhibition screening systems | Evaluation of transporter-mediated DDIs [52] |
| CYP Inhibition/Induction Kits | Fluorescent or luminescent CYP enzyme activity assays (CYP3A4, 2D6, 2C9, 2C19) | Mechanistic DDI studies and phenoconversion assessment [53] [52] |
| Population PK/PD Modeling Software | NONMEM, Monolix, Phoenix NLME, R/Python with specialized libraries | Quantitative analysis of complex DDGI relationships [53] |
The following diagram illustrates the experimental workflow for evaluating pharmacogenomic influences on NTI drug safety and efficacy:
The intersection of drug-drug interactions and pharmacogenomics creates substantial challenges for the safe and effective use of NTI drugs. The complex phenomena of drug-drug-gene interactions and phenoconversion demonstrate that traditional approaches to DDI screening and PGx testing in isolation are insufficient for these high-risk medications [53] [52]. A comprehensive understanding of these interactions is essential for researchers, drug development professionals, and clinicians working with NTI drugs.
Future directions in this field include the development of integrated computational models that can simultaneously account for genetic polymorphisms, drug interactions, and patient-specific factors [53]. The qualification of novel safety biomarkers through initiatives like the Predictive Safety Testing Consortium will enhance our ability to detect organ injury earlier and more specifically during drug development [55] [54]. Additionally, international harmonization of bioequivalence standards for generic NTI drugs will help ensure consistent quality and performance across global markets [51] [39].
For researchers pursuing the broader thesis on therapeutic index calculation and application, this review demonstrates that the classical therapeutic index ratio represents merely a starting point for understanding NTI drug behavior. The clinical relevance of this ratio is profoundly influenced by the complex interplay between multiple pharmacological and genetic factors that must be considered throughout drug development and clinical use.
Formulation and Bioequivalence Considerations for Generic NTI Drugs
The therapeutic index (TI), also referred to as the therapeutic ratio, is a quantitative measurement of the relative safety of a drug. It is a comparison of the amount of a therapeutic agent that causes toxicity to the amount that causes the therapeutic effect [1]. Classically, the TI is calculated as the ratio of the dose that produces a toxic effect in 50% of the population (TD50) to the dose that elicits a therapeutic or effective response in 50% of the population (ED50), expressed as TI = TD50 / ED50 [5] [1]. In pre-clinical animal studies, the lethal dose for 50% of the population (LD50) is sometimes used, resulting in TI = LD50 / ED50 [5]. A high therapeutic index indicates a wide margin between the effective and toxic doses, signifying a safer drug. Conversely, a low therapeutic index indicates a narrow margin, where small dosage changes can lead to significant adverse effects or therapeutic failure [3] [1].
Drugs with a narrow therapeutic index (NTI), also known as critical-dose drugs, are those where small differences in dose or blood concentration may lead to serious therapeutic failures and/or adverse drug reactions that are life-threatening or result in significant disability [57] [41]. For these drugs, there is minimal separation between the minimum effective concentration and the minimum toxic concentration in the blood [3]. The U.S. Food and Drug Administration (FDA) has further defined an NTI drug as one where there is less than a twofold difference in the median lethal dose (LD50) and median effective dose (ED50), or in the minimum toxic concentrations (MTC) and minimum effective concentrations (MEC) in the blood, and where safe and effective use requires careful titration and patient monitoring [15] [4]. The table below lists common drugs categorized as NTI.
Table 1: Examples of Drugs with a Narrow Therapeutic Index (NTI)
| Drug Category | Specific Drug Examples |
|---|---|
| Anticoagulants | Warfarin, Heparin [57] |
| Antiepileptic Drugs | Valproic acid, Phenobarbital, Phenytoin, Carbamazepine [57] |
| Aminoglycosides | Gentamicin, Tobramycin, Neomycin [57] [1] |
| Immunosuppressants | Cyclosporine, Sirolimus, Tacrolimus [57] [4] |
| Cardiac Glycosides | Digoxin, Digitoxin [57] |
| Mood Stabilizers | Lithium carbonate [57] [1] |
| Antiarrhythmic Agents | Flecainide [15] |
Regulatory Bioequivalence Standards for NTI Drugs
For generic drugs to be approved, they must demonstrate bioequivalence (BE) to the reference listed drug (RLD). Bioequivalence indicates that the generic drug has a similar rate and extent of absorption of the active ingredient at the site of action when administered at the same molar dose under similar conditions [57] [15]. For most drugs, the conventionally accepted BE criterion is that the 90% confidence intervals (CIs) for the ratio of the geometric means of the test (generic) to reference (brand-name) products for key pharmacokinetic parameters—AUC (area under the curve, measuring extent of absorption) and Cmax (maximum concentration, measuring rate of absorption)—must fall within the range of 80.00% to 125.00% [57] [15].
Given the serious risks associated with even small variations in plasma concentrations of NTI drugs, regulatory agencies worldwide have established stricter BE criteria for these products. The two primary approaches are direct tightening of the acceptance interval or the implementation of a reference-scaled average bioequivalence approach that accounts for the within-subject variability of the reference product [41] [4].
Table 2: International Bioequivalence Criteria for NTI Drugs
| Regulatory Agency | Standard BE Criteria | NTI Drug BE Criteria |
|---|---|---|
| U.S. FDA | 80.00% – 125.00% | 90.00% – 111.11% [57] [41] |
| European Medicines Agency (EMA) | 80.00% – 125.00% | 90.00% – 111.11% [57] |
| Health Canada | 80.00% – 125.00% | 90.00% – 112.00% [57] |
| Japanese PMDA | 80.00% – 125.00% | 90.00% – 111.11% [57] |
The U.S. FDA recommends a fully replicated, two-sequence, two-treatment, four-period crossover study design for generic NTI drugs [41] [4]. In this design, each subject receives both the test product and the reference product twice. This design allows for a simultaneous comparison of the mean pharmacokinetic parameters and the within-subject variability between the test and reference products [4]. The BE assessment for NTI drugs must pass several statistical criteria, including both reference-scaled average bioequivalence and unscaled average bioequivalence (80.00-125.00%), as well as a comparison of within-subject variability to ensure the test product does not have significantly higher variability than the reference product [41] [4].
Experimental Protocols for Demonstrating Bioequivalence
Study Design and Protocol
A robust BE study for an NTI drug requires meticulous planning and execution. The recommended design is a fully replicated, two-sequence, two-treatment, four-period crossover study [41]. The workflow for this design is illustrated below.
Key Protocol Components:
- Subjects: Healthy volunteers or patients, depending on the drug's safety profile, with sufficient sample size to power the study for stricter NTI criteria [15].
- Dosing: Administration of the test and reference products under both fasting and fed conditions unless otherwise justified, as food effects can be critical for NTI drugs [41].
- Washout Period: A sufficiently long washout period between doses must be included to ensure no carryover effect, typically based on at least five half-lives of the drug.
- Pharmacokinetic Sampling: Intensive blood sampling is performed over a period to capture the complete concentration-time profile. This allows accurate calculation of AUC (area under the curve, primary measure of extent of absorption), Cmax (maximum concentration, primary measure of rate of absorption), and Tmax (time to reach Cmax) [15] [4].
Bioanalytical Methodology
The bioanalytical method used to measure drug concentrations in plasma must be rigorously validated for specificity, sensitivity, accuracy, precision, and stability according to regulatory guidelines (e.g., FDA Bioanalytical Method Validation). The reliability of the PK data hinges entirely on the quality of the analytical method.
Statistical Analysis for Bioequivalence
The statistical analysis for NTI drugs is more complex than for standard drugs. The FDA requires that the test product meets the following criteria [41] [4]:
- Reference-Scaled Average Bioequivalence: The 90% confidence interval for the ratio of the geometric means (Test/Reference) for AUC and Cmax must fall within tightened limits that are scaled to the within-subject variability (SWR) of the reference product. If SWR is 0.10, the limits are 90.00-111.11%. The limits widen as variability increases but are capped at 80.00-125.00%.
- Unscaled Average Bioequivalence: The same 90% confidence interval must also fall within the traditional 80.00-125.00% limits, regardless of variability.
- Within-Subject Variability Comparison: The test product must not have significantly higher within-subject variability than the reference product. This is assessed by ensuring that the upper 90% confidence bound for the ratio of within-subject standard deviations (SWT/SWR) is ≤ 2.5.
The logic for determining BE success based on these criteria is summarized in the following decision tree:
The Scientist's Toolkit: Key Reagents and Materials
The successful development and BE demonstration of a generic NTI drug requires a suite of high-quality materials and analytical solutions.
Table 3: Essential Research Reagent Solutions for NTI Generic Drug Development
| Reagent / Material | Function and Importance in Development |
|---|---|
| High-Purity Active Pharmaceutical Ingredient (API) | The core active ingredient must be pharmaceutically equivalent to the RLD. Even minor impurities can alter stability, bioavailability, or safety, which is critical for NTI drugs. |
| Pharmaceutical Grade Excipients | Inactive ingredients must be carefully selected to match the RLD's performance. Differences can affect drug release, stability, and absorption, potentially leading to BE failure. |
| Stable Isotope-Labeled Internal Standards | Essential for accurate and precise bioanalytical quantification using LC-MS/MS. They correct for matrix effects and variability in sample preparation, ensuring reliable PK data. |
| Validated Bioanalytical Assay Kits | Ready-to-use or in-house validated kits for quantifying drug concentrations in plasma. Validation parameters must include specificity, linearity, accuracy, precision, and stability. |
| Certified Reference Standards | Highly characterized standards of the API and major metabolites with known purity and identity, used to calibrate analytical instruments and ensure the accuracy of all measurements. |
The development of generic versions of narrow therapeutic index drugs presents a significant scientific and regulatory challenge. It requires a deep understanding of the therapeutic index concept and its implications for drug safety. Success hinges on adhering to stringent, globally harmonized bioequivalence standards that go beyond those required for conventional drugs. The implementation of sophisticated study designs, such as the fully replicated crossover, along with complex statistical approaches like reference-scaled average bioequivalence, is critical to ensuring that generic NTI products are therapeutically equivalent to their brand-name counterparts. By employing rigorous experimental protocols and high-quality materials, developers can navigate this complex landscape, ultimately fostering patient access to safe, effective, and affordable essential medicines.
Validation, Regulatory Standards, and Comparative Drug Analysis
The Therapeutic Index (TI) is a quantitative measurement of the relative safety of a drug, providing a critical comparison between the dose or exposure level that causes therapeutic effects and the level that produces adverse toxicity [1]. This concept serves as a cornerstone in drug development and regulatory science, enabling researchers and clinicians to balance efficacy against safety risks.
The TI is fundamentally grounded in pharmacodynamic principles, comparing the amount of a therapeutic agent that causes toxicity to the amount that elicits the desired therapeutic effect [1]. For clinical applications, the therapeutic window or safety window refers to the range of doses optimized between efficacy and toxicity, achieving maximal therapeutic benefit without unacceptable side-effects [1]. Drugs with a narrow therapeutic index (NTI) present particular challenges in clinical practice and regulatory oversight, as small variations in dose or exposure can lead to subtherapeutic outcomes or dangerous toxicity.
Calculating the Therapeutic Index
Fundamental Calculations and Terminology
Therapeutic index calculations utilize specific pharmacological parameters derived from quantal dose-response relationships observed in populations [6]. The foundational equation compares the toxic dose to the effective dose:
Traditional Therapeutic Index (Safety-based):
TI = TD₅₀ / ED₅₀ or TI = LD₅₀ / ED₅₀ [1] [6]
Where:
- ED₅₀: Effective dose for 50% of the population - the dose that produces the specified therapeutic effect in half of the subjects [1] [6]
- TD₅₀: Toxic dose for 50% of the population - the dose that produces a defined toxic effect in half of the subjects [1] [6]
- LD₅₀: Lethal dose for 50% of the population - the dose that causes death in half of animal subjects in preclinical studies [1] [6]
Table 1: Key Parameters for Therapeutic Index Calculations
| Term | Full Form | Definition |
|---|---|---|
| ED | Effective Dose | The dose or concentration that produces a biological response in 50% of subjects [1] |
| TD | Toxic Dose | The dose at which toxicity occurs in 50% of cases [1] |
| LD | Lethal Dose | The dose at which death occurs in 50% of subjects (primarily animal studies) [1] |
| TI | Therapeutic Index | Ratio comparing toxic to effective doses (TD₅₀/ED₅₀ or LD₅₀/ED₅₀) [1] |
In modern drug development, the Protective Index (TD₅₀/ED₅₀) is often more informative than lethal dose measurements, as toxicity frequently occurs at levels far below lethal effects [1]. Additionally, regulatory settings now emphasize plasma exposure levels rather than simple administered doses, accounting for inter-individual variability due to polymorphisms, drug-drug interactions, and other factors [1].
Advanced TI Frameworks and Composite Indices
Recent research has developed more sophisticated frameworks for evaluating therapeutic value, particularly for novel therapeutic modalities. The Composite Digital Therapeutic Index (cDTI) represents one such innovation, integrating multiple domains into a unified metric [58]:
cDTI = f(Efficacy, Engagement, Evidence Quality, Safety)
This multidimensional approach incorporates:
- Efficacy: Quantified by standardized mean difference (Hedges' g) with statistical significance adjustments
- Engagement: Measured by proportion of patients completing therapeutic modules
- Evidence Quality: Graded using adapted clinical evidence frameworks
- Safety: Assessed via treatment-emergent adverse events with hierarchical penalty systems [58]
Therapeutic Index Ranges and Clinical Implications
Comparative TI Values Across Drug Classes
The therapeutic index varies substantially among pharmaceuticals, with important implications for clinical use and regulatory oversight [1]. Understanding these variations is crucial for therapeutic decision-making and risk assessment.
Table 2: Therapeutic Index Ranges for Selected Pharmaceuticals
| Drug | Therapeutic Index | Clinical Implications |
|---|---|---|
| Remifentanil | 33,000:1 | Very wide safety margin; considered very forgiving [1] |
| Diazepam | 100:1 | Moderate safety margin [1] |
| Morphine | 70:1 | Requires careful dosing [1] |
| Cocaine | 15:1 | Narrow safety margin [1] |
| Ethanol | 10:1 | Narrow safety margin [1] |
| Paracetamol/Acetaminophen | 10:1 | Narrow safety margin; hepatotoxicity risk [1] |
| Digoxin | 2:1 | Very narrow safety margin; requires therapeutic drug monitoring [1] |
Narrow Therapeutic Index (NTI) Drugs
Drugs with a narrow therapeutic index (NTI) demonstrate only a small difference between the minimum effective concentration and the minimum toxic concentration in the blood [3]. Consequently, minor dosage increases or variations in bioavailability can precipitate toxic effects, while small decreases may result in therapeutic failure [3].
Common NTI drugs requiring careful clinical management include:
- Warfarin - anticoagulant
- Lithium - psychiatric disorders
- Theophylline - respiratory conditions
- Digoxin - cardiac glycoside
- Gentamicin - antibiotic [1] [3]
For NTI drugs, regulatory agencies impose stricter bioequivalence standards and often recommend therapeutic drug monitoring (TDM) to maintain plasma concentrations within the therapeutic window [1] [3].
Regulatory Standards for Bioequivalence
Bioequivalence Fundamentals
Bioequivalence (BE) assessment ensures that generic drugs perform similarly to their reference products, maintaining comparable safety and efficacy profiles. For NTI drugs, where small differences can have significant clinical consequences, regulatory agencies employ more stringent BE criteria [51].
The standard bioequivalence approach establishes equivalence if the 90% confidence interval (CI) for the ratio of geometric means of the key pharmacokinetic parameters (AUC and Cmax) falls entirely within the acceptance range [51]. For most drugs, this range is 80.00-125.00%, but NTI drugs face tighter restrictions.
Comparative Regulatory Frameworks
The FDA and EMA have established distinct, though similarly strict, bioequivalence criteria for NTI drugs, with ongoing efforts toward international harmonization through initiatives like ICH M13 [51] [59].
Table 3: Comparison of Bioequivalence Criteria for NTI Drugs
| Regulatory Agency | Standard BE Limits | NTI Drug BE Limits | Key Requirements |
|---|---|---|---|
| U.S. FDA (Current) | 80.00-125.00% | 90.00-111.11% | Stricter limits for reference product-dependent bioequivalence [51] |
| European EMA | 80.00-125.00% | 90.00-111.11% | Additional study design considerations and statistical approaches [51] |
| Proposed FDA Alternative | 80.00-125.00% | Capped minimum limits with alpha adjustment and point estimate constraint | Aims to harmonize with international standards while maintaining statistical rigor [51] |
The proposed alternative FDA criteria for NTI drugs aim to address limitations of current approaches, particularly improved performance for drugs with low within-reference standard deviation (σ < 0.1), maintained Type I error control, and closer alignment with international standards [51]. This harmonization effort through ICH M13 seeks to establish consistent global BE standards for NTI drugs, potentially streamlining drug development and regulatory approval processes across jurisdictions [51] [59].
Experimental Protocols and Methodologies
Determining Therapeutic Index in Drug Development
The protocol for determining therapeutic index has evolved from classical lethal dose measurements in animals to sophisticated exposure-based assessments in clinical trials [1]. The modern approach emphasizes plasma exposure levels rather than administered doses, recognizing that tissue exposure drives pharmacological and toxicological effects [1].
Experimental Protocol: Tiered TI Assessment
Preclinical Phase
- Conduct dose-range finding studies in relevant animal models
- Establish ED₅₀ for primary pharmacodynamic endpoints
- Determine TD₅₀ for clinically relevant toxicological endpoints
- Calculate preliminary TI using protective index (TD₅₀/ED₅₀)
Clinical Phase
- Determine human equivalent exposure levels using allometric scaling
- Conduct Phase I trials to establish human pharmacokinetics and safety profile
- Perform exposure-response modeling for efficacy and toxicity endpoints
- Calculate clinical TI using exposure at steady state rather than single-dose administration [1]
For toxicities that manifest after multiple administrations, TI should be calculated using steady-state exposure metrics to account for potential accumulation and delayed effects [1].
Bioequivalence Study Design for NTI Drugs
Establishing bioequivalence for NTI drugs requires meticulous study design and execution to ensure patient safety. The standard approach involves randomized, crossover studies in healthy volunteers or patients, with precise pharmacokinetic sampling [51].
Detailed BE Study Methodology:
Study Population
- Generally healthy volunteers (unless safety concerns preclude)
- Adequate sample size to ensure statistical power for tighter equivalence margins
- Consideration of genetic polymorphisms in drug metabolism
Study Design
- Randomized, single-dose, two-treatment, two-period, two-sequence crossover design
- Appropriate washout period (≥5 half-lives) between treatments
- Standardized conditions regarding fasting/feeding state
Pharmacokinetic Sampling
- Frequent sampling to adequately characterize AUC and Cmax
- Typically 12-18 blood samples over ≥3 terminal half-lives
- Sensitive and specific bioanalytical methods with demonstrated reproducibility
Statistical Analysis
- ANOVA on log-transformed PK parameters (AUC₀–t, AUC₀–∞, Cmax)
- Calculation of 90% confidence intervals for geometric mean ratios
- Assessment against tightened equivalence boundaries (90.00-111.11%)
The 2025 publication by Paixão et al. proposes refined statistical approaches including capped minimum BE limits, alpha adjustment, and point estimate constraints to improve BE determination for NTI drugs while supporting global harmonization efforts [51].
The Scientist's Toolkit: Essential Research Reagents and Materials
Successful determination of therapeutic index and demonstration of bioequivalence requires specific research tools and methodologies. The following table outlines essential components of the regulatory scientist's toolkit.
Table 4: Essential Research Materials and Methodologies for TI and BE Studies
| Research Tool | Function/Application | Technical Specifications |
|---|---|---|
| Validated Bioanalytical Assays | Quantification of drug concentrations in biological matrices | LC-MS/MS methods with demonstrated specificity, accuracy, precision, and reproducibility [51] |
| Pharmacokinetic Modeling Software | Analysis of concentration-time data to derive AUC, Cmax, Tmax | Software capable of noncompartmental analysis and population PK modeling (e.g., WinNonlin, NONMEM) |
| Statistical Analysis Packages | Bioequivalence statistical testing | Programs capable of ANOVA on log-transformed data with calculation of 90% confidence intervals (e.g., SAS, R) [51] |
| In Vitro Dissolution Apparatus | Assessment of drug release characteristics | USP-compliant dissolution systems (Apparatus 1-4) with validated analytical methods [59] |
| Clinical Database Systems | Management of clinical trial data | 21 CFR Part 11-compliant electronic data capture systems with audit trail functionality |
The determination of therapeutic index and establishment of bioequivalence represent fundamental components of modern pharmaceutical regulation. While the conceptual framework of TI has remained consistent, its application has evolved from simple lethal dose ratios in animals to sophisticated exposure-based assessments in human populations. For narrow therapeutic index drugs, regulatory agencies including the FDA and EMA have implemented stricter bioequivalence standards to ensure patient safety, with ongoing harmonization efforts through international initiatives like ICH M13.
The continuing evolution of TI assessment methodologies, including composite indices that integrate efficacy, safety, engagement, and evidence quality, promises to enhance drug development and regulatory decision-making. Similarly, refined statistical approaches for establishing bioequivalence will support the approval of safe and effective generic versions of NTI drugs, improving patient access to critical medications while maintaining rigorous safety standards.
The therapeutic index (TI) is a quantitative measurement of the relative safety of a drug, providing a critical risk-benefit assessment in pharmacology and toxicology [1]. It is a cornerstone concept in drug development and clinical prescription, serving as a key determinant in dosage optimization and therapeutic drug monitoring protocols [3]. The TI fundamentally compares the amount of a therapeutic agent that causes the desired therapeutic effect to the amount that induces toxicity [1]. Classically, for clinical indications of an approved drug, the TI refers to the ratio of the dose that produces a toxic effect in 50% of a population (TD~50~) to the dose that leads to the desired pharmacological effect in 50% of that population (ED~50~) [1] [6]. A related concept is the therapeutic window or safety window, which describes the range of doses optimized between efficacy and toxicity, aiming to achieve the greatest therapeutic benefit without resulting in unacceptable side-effects [1].
The clinical utility of the TI is profound. Drugs with a high therapeutic index are generally considered safer, as there is a wide margin between the doses required for efficacy and those causing harm [60]. Conversely, drugs with a narrow therapeutic index (NTI) possess a small difference between their minimum effective and toxic concentrations, meaning that small changes in dosage or blood concentration can lead to serious therapeutic failure or significant adverse drug reactions [50] [4]. For NTI drugs, careful dose titration and close therapeutic drug monitoring (TDM) are often mandatory to ensure patient safety [1] [4].
Calculation Methods and Metrics
Fundamental Formulas
The most classical method for calculating the therapeutic index is based on quantal dose-response curves, which plot the fraction of a population responding to a drug versus the dose. The standard formula is:
Therapeutic Index (TI) = TD~50~ / ED~50~
Where TD~50~ is the median toxic dose and ED~50~ is the median effective dose [1] [6]. In pre-clinical animal studies, the median lethal dose (LD~50~) is sometimes used in place of TD~50~, giving TI = LD~50~ / ED~50~ [1] [61]. However, since severe toxicities in humans often occur at sublethal doses, the use of TD~50~ is generally more relevant for clinical practice [1].
Table 1: Key Terms and Definitions in TI Calculation
| Term | Full Form | Definition |
|---|---|---|
| ED | Effective Dose | The dose or concentration of a drug that produces a biological response [1]. |
| ED~50~ | Median Effective Dose | The dose that leads to the desired pharmacological effect in 50% of the population [1] [6]. |
| TD | Toxic Dose | The dose at which toxicity occurs [1]. |
| TD~50~ | Median Toxic Dose | The dose that produces a defined toxic effect in 50% of subjects [1] [6]. |
| LD~50~ | Median Lethal Dose | The dose required to kill 50% of a test population [1] [6]. |
| TI | Therapeutic Index | A quantitative measurement of the relative safety of a drug [1]. |
Margin of Safety (MOS)
A significant limitation of the standard TI is that it ignores the slopes of the dose-response curves for efficacy and toxicity. To overcome this, the Margin of Safety (MOS) is often used as a more conservative and informative metric [60]. The MOS compares the dose that is toxic to 1% of the population (TD~01~) to the dose that is effective for 99% of the population (ED~99~) [60].
Margin of Safety (MOS) = TD~01~ / ED~99~
This calculation provides a more stringent safety assessment, as it considers the extremes of the population response rather than the median, ensuring protection for nearly all patients [60].
Types of Therapeutic Indices
Based on efficacy and safety endpoints, there are two primary types of therapeutic indices [1]:
- Safety-based Therapeutic Index (TI~safety~): TI~safety~ = LD~50~ / ED~50~. A higher value indicates a larger therapeutic window.
- Efficacy-based Therapeutic Index (TI~efficacy~): TI~efficacy~ = ED~50~ / TD~50~. A lower value indicates a larger therapeutic window.
The Protective Index is another related metric, calculated as TD~50~ / ED~50~, which is the reciprocal of TI~efficacy~ [1].
Comparative TI Analysis of Case Study Drugs
The therapeutic index varies dramatically among pharmaceutical agents, which directly influences their clinical monitoring requirements and risk profiles. The following analysis provides a comparative overview of common drugs with both narrow and wide therapeutic indices.
Table 2: Comparative Therapeutic Index Analysis of Common Drugs
| Drug | Therapeutic Class | Reported TI | Classification | Key Monitoring Parameters |
|---|---|---|---|---|
| Digoxin [3] [21] | Cardiac glycoside | ~2:1 [3] | Narrow | Heart rate, signs of toxicity (nausea, visual disturbances), serum drug levels [4] |
| Warfarin [3] [50] | Anticoagulant | Narrow [3] | Narrow | International Normalized Ratio (INR) [4] |
| Lithium [3] [50] | Mood stabilizer | Narrow [3] | Narrow | Serum drug levels, renal and thyroid function [1] |
| Phenytoin [50] [21] | Antiepileptic | Narrow [50] | Narrow | Serum drug levels, clinical seizure control |
| Gentamicin [50] [21] | Aminoglycoside antibiotic | Narrow [50] | Narrow | Trough and peak serum drug levels, renal function [50] |
| Theophylline [50] | Bronchodilator | Narrow [50] | Narrow | Serum drug levels, clinical respiratory status |
| Penicillin [3] | Antibiotic | High/Wide [3] | Wide | Clinical signs of infection; routine drug level monitoring not required |
| Diazepam [1] | Benzodiazepine | 100:1 [1] | Wide | Clinical sedation response |
| Morphine [1] | Opioid analgesic | 70:1 [1] | Wide | Respiratory rate, level of sedation/pain control |
| Remifentanil [1] | Opioid analgesic | 33,000:1 [1] | Wide | Continuous monitoring of ventilation and oxygenation |
In-Depth Case Study: Digoxin
Digoxin, a cardiac glycoside used for heart failure and atrial fibrillation, is a classic example of a drug with a very narrow therapeutic index, approximately 2:1 [3]. Its therapeutic effect is achieved at doses very close to those that cause toxicity.
- Mechanism of Action: Digoxin inhibits the Na+/K+ ATPase pump in cardiac myocytes, leading to increased intracellular calcium and enhanced myocardial contractility (positive inotropy). It also slows conduction through the AV node.
- Toxicology: The primary manifestations of digoxin toxicity include life-threatening cardiac arrhythmias (e.g., heart block, ventricular tachycardia), as well as gastrointestinal effects (anorexia, nausea, vomiting) and neurological effects (visual disturbances, confusion) [4].
- Therapeutic Drug Monitoring (TDM): Due to its narrow TI, TDM is essential. The therapeutic serum concentration range is typically 0.5-2.0 ng/mL. Toxicity risk increases significantly within this range and is high above 2.0 ng/mL [4]. Factors such as renal impairment, electrolyte disturbances (hypokalemia, hypomagnesemia), and drug interactions (e.g., with amiodarone, verapamil) can precipitate toxicity even at levels within the therapeutic range.
In-Depth Case Study: Warfarin
Warfarin is an oral anticoagulant with a narrow therapeutic index, where individual daily dose requirements can vary by more than 40-fold [4]. Small deviations from the optimal dose can lead to either therapeutic failure (thrombosis) or toxicity (hemorrhage).
- Mechanism of Action: It acts as a vitamin K antagonist, inhibiting the synthesis of vitamin K-dependent clotting factors (II, VII, IX, X).
- Defining the Therapeutic Window: The therapeutic effect and toxicity are monitored using the International Normalized Ratio (INR). For most indications, the target therapeutic range is an INR of 2.0 to 3.0. An INR below 2.0 increases the risk of thrombosis, while an INR above 3.0 significantly increases the risk of hemorrhage [4].
- Challenges and Monitoring: Warfarin has numerous drug-drug and drug-food interactions that can alter its metabolism or effect, making its management complex [4]. Pharmacogenomics plays a significant role, as polymorphisms in genes coding for the enzyme CYP2C9 (metabolism) and VKORC1 (target) can account for a large portion of the inter-individual variability in dose requirements [4].
In-Depth Case Study: Penicillin
In stark contrast to digoxin and warfarin, penicillin and many other antibiotics have a very wide therapeutic index [3].
- Mechanism of Action: Penicillins inhibit bacterial cell wall synthesis by binding to penicillin-binding proteins (PBPs), leading to bacteriolysis.
- Safety Profile: The targets of penicillin are specific to bacteria and are largely absent in human cells. This selective toxicity results in a high TI. Doses can be increased significantly to eradicate resistant infections without causing direct, dose-related toxicity in the host.
- Clinical Implication: Routine therapeutic drug monitoring is not required for penicillin. The primary safety concerns are hypersensitivity and allergic reactions, which are idiosyncratic and not dose-dependent, meaning the TI concept is less relevant for these specific adverse effects [6].
Experimental Protocols for TI Determination
Pre-Clinical In Vivo TI Assessment
The determination of a drug's TI begins in the pre-clinical phase, primarily using animal models to establish initial safety margins.
Title: Pre-clinical TI assessment workflow
Protocol Details:
- Animal Model Selection: Studies are typically conducted in two or more mammalian species (e.g., mice, rats) to evaluate interspecies variability [61].
- Dose-Ranging Study Design: Animals are randomly assigned to receive either a single dose or repeated doses of the test compound across a wide range. Control groups receive the vehicle alone.
- Efficacy Endpoint Assessment (ED~50~): The desired pharmacological effect must be quantitatively measurable. The ED~50~ is determined by plotting the fraction of animals achieving the predefined therapeutic effect against the log of the dose, generating a sigmoidal curve from which the median effective dose is derived [6].
- Toxicity Endpoint Assessment (TD~50~/LD~50~): Concurrently or in a separate study, animals are monitored for signs of toxicity. The TD~50~ is the dose causing a specific adverse effect in 50% of animals. In earlier toxicology, the LD~50~ (lethal dose for 50%) was commonly used, but modern practice focuses more on sublethal toxicities relevant to human exposure [1] [6].
- Plasma Exposure Analysis: Modern drug development emphasizes using plasma exposure (e.g., Area Under the Curve - AUC) rather than just administered dose to calculate TI, as it accounts for pharmacokinetic differences [1]. The TI is calculated as the ratio of the exposure at the TD~50~ to the exposure at the ED~50~.
- Data Analysis: The dose-response data for efficacy and toxicity are analyzed using statistical models (e.g., probit analysis, non-linear regression) to determine the ED~50~ and TD~50~ values with confidence intervals.
Clinical TI and Therapeutic Window Determination
In clinical trials, the TI is refined using human data, focusing on the therapeutic window.
Protocol Details:
- Phase I Trials: Healthy volunteers or patients receive escalating doses to determine pharmacokinetics and tolerability. The primary goal is to find the Maximum Tolerated Dose (MTD) and characterize dose-limiting toxicities (DLTs).
- Phase II/III Trials: Patients receive different doses to establish a dose-response relationship for efficacy. The effective dose (e.g., ED~90~) for the desired clinical endpoint is determined.
- Defining the Window: The therapeutic window is the range between the Minimum Effective Concentration (MEC) and the Minimum Toxic Concentration (MTC) in the blood [21]. This is more clinically useful than a single ratio.
- Therapeutic Drug Monitoring (TDM): For drugs subsequently identified as having an NTI, TDM is implemented in clinical practice. This involves regularly measuring drug concentrations in a patient's blood (e.g., trough levels for gentamicin) to ensure they remain within the therapeutic window, thus maximizing efficacy and minimizing toxicity [1] [50].
Regulatory and Clinical Implications of NTI Drugs
Drugs with a narrow therapeutic index present significant challenges for both regulators and clinicians. Regulatory agencies worldwide have established specific frameworks for their evaluation and approval, particularly for generic versions.
Regulatory Frameworks for NTI Drugs
There is notable international divergence in how NTI drugs are defined and regulated. A 2026 review highlights that the United States employs the most stringent bioequivalence (BE) standards for generic NTI drugs, requiring a fully replicated study design and reference-scaled average bioequivalence (RSABE) to ensure that generic versions are highly similar to the brand-name product [62] [63]. According to the US Code of Federal Regulations, a drug may be classified as having a narrow therapeutic ratio if there is less than a twofold difference in median LD~50~ and ED~50~ values, or in the minimum toxic and minimum effective concentrations in the blood [4] [63]. This stringent approach is crucial because even small deviations in the dose or plasma concentration of an NTI drug can lead to serious therapeutic failures or life-threatening adverse events [4].
Clinical Management and Risk Mitigation
In clinical practice, the management of NTI drugs requires heightened vigilance. Studies have shown that NTI drugs are significantly more often associated with drug-related problems (DRPs) compared to non-NTI drugs [50]. These problems most frequently fall into the categories of non-optimal dose, drug interactions, and the need for monitoring [50]. To mitigate these risks, the following strategies are essential:
- Therapeutic Drug Monitoring (TDM): Systematic measurement of drug concentrations in biological fluids to individualize dosage regimens, ensuring concentrations remain within the therapeutic window [1] [4].
- Pharmacogenomic Testing: For drugs like warfarin, genetic testing for variants in CYP2C9 and VKORC1 can inform initial dosing, reducing the risk of over- or under-anticoagulation during therapy initiation [4].
- Patient Education and Interprofessional Communication: Ensuring patients understand the signs of toxicity and the importance of adherence, and promoting clear communication among healthcare providers to manage complex drug regimens.
The Scientist's Toolkit: Key Research Reagents and Materials
Research into therapeutic indices relies on a suite of specialized reagents, models, and instrumentation.
Table 3: Essential Research Materials for TI Studies
| Tool/Reagent | Function/Application |
|---|---|
| In Vivo Animal Models | Used for initial determination of ED~50~, LD~50~, and TD~50~. Common models include rodents (mice, rats) and non-rodents (dogs, primates) [61]. |
| Cell-Based Assays | High-throughput screening for specific efficacy or toxicity endpoints (e.g., cytotoxicity assays, receptor binding assays). |
| Liquid Chromatography-Mass Spectrometry | Gold-standard technology for the precise and accurate quantification of drug concentrations in biological matrices (plasma, serum) for PK/PD analysis and TDM [4]. |
| Reference Standard | A highly characterized and pure sample of the drug substance, essential for calibrating analytical instruments and ensuring accurate concentration measurements. |
| Enzyme-Linked Immunosorbent Assay | An alternative, often faster, immunoassay technique for quantifying drug or biomarker levels in biological samples. |
| Pharmacogenomic Panels | Test kits for identifying genetic polymorphisms (e.g., in CYP2C9, VKORC1) that cause variability in drug response and influence the effective TI in subpopulations [4]. |
| Software for PK/PD Modeling | Programs like NONMEM, Phoenix WinNonlin used to model dose-exposure-response relationships and simulate therapeutic windows from sparse clinical data. |
The therapeutic index (TI) is a foundational concept in pharmacology, providing a quantitative measurement of a drug's relative safety by comparing the dose or exposure that causes toxicity to the dose that produces the desired therapeutic effect [1]. While the classic therapeutic index (TI = TD₅₀/ED₅₀ or LD₅₀/ED₅₀) remains widely recognized, modern drug development requires more sophisticated approaches to characterize the balance between efficacy and safety [1] [64]. This has led to the development and utilization of advanced indices, particularly the efficacy-based therapeutic index and the protective index, which offer nuanced perspectives for optimizing drug candidates.
The limitations of the classic TI calculation have become increasingly apparent in contemporary drug development. Traditional indices derived from animal studies, particularly those using lethal dose (LD₅₀) endpoints, often fail to accurately predict clinical safety in humans, where severe toxicities frequently occur at sublethal doses [1] [64]. Furthermore, the classic ratio does not adequately account for inter-individual variability in drug exposure due to polymorphisms in metabolism, drug-drug interactions, or differences in body weight [64]. These considerations have emphasized the importance of using exposure (drug concentration over time) rather than simple dose to calculate therapeutic indices, particularly for toxicities that manifest after multiple administrations [64].
Within this context, advanced indices provide a more refined framework for decision-making throughout the drug development pipeline. They enable researchers to systematically and quantitatively compare safety and efficacy data, applying this knowledge more effectively to identify drug candidates with appropriately balanced profiles for specific therapeutic indications [64].
Conceptual Framework of Advanced Indices
Efficacy-Based Therapeutic Index
The efficacy-based therapeutic index (TIₑffᵢcₐcᵧ) addresses the relationship between a drug's therapeutic effect and its specific toxic manifestations, providing a more clinically relevant safety margin than indices based on lethal endpoints. It is defined by the formula:
TIₑffᵢcₐcᵧ = ED₅₀ / TD₅₀
In this equation, ED₅₀ represents the median effective dose that produces the desired therapeutic response in 50% of the population, while TD₅₀ represents the median toxic dose that produces adverse effects in 50% of the population [1]. Unlike the classic safety-based TI, where higher values indicate a wider safety margin, a lower TIₑffᵢcₐcᵧ value is preferable as it indicates a larger separation between the effective dose and the toxic dose [1]. This inverse relationship with safety necessitates careful interpretation to avoid confusion in practical applications.
The TIₑffᵢcₐcᵧ is particularly valuable in contexts where the nature of the toxicity endpoint is more clinically relevant than lethality. For many modern therapeutics, especially those targeting chronic conditions, sublethal toxicities such as organ-specific damage or functional impairments represent the primary dose-limiting factors rather than outright mortality [1]. By focusing on these clinically meaningful adverse effects, the efficacy-based index provides a more translational safety assessment during drug development.
Protective Index
The protective index (PI) offers a complementary perspective on drug safety, serving as a practical alternative to the efficacy-based therapeutic index. It is defined as:
Protective Index = TD₅₀ / ED₅₀
The protective index essentially represents the reciprocal of the efficacy-based therapeutic index (PI = 1 / TIₑffᵢcₐcᵧ) [1]. In this framework, higher PI values indicate a more favorable safety profile, as they signify that the toxic dose is substantially higher than the effective dose. This intuitive directionality—where higher values correspond to greater safety—makes the protective index particularly useful for comparative assessments of drug candidates.
In preclinical settings, the protective index is widely used for screening compounds with selective anticonvulsant activity, where TD₅₀ is typically determined through tests for minimal neurological deficit such as the rotarod test or chimney test [65]. The protective index effectively quantifies the margin between desired pharmacological activity and undesirable neurological impairment, enabling researchers to prioritize compounds with the most favorable efficacy-safety balance for further development.
Table 1: Comparative Overview of Therapeutic Indices
| Index Type | Formula | Interpretation | Primary Application |
|---|---|---|---|
| Classic Therapeutic Index | LD₅₀/ED₅₀ | Higher value = Safer drug | Preclinical screening (animal studies) |
| Efficacy-Based Therapeutic Index | ED₅₀/TD₅₀ | Lower value = Safer drug | Clinical translation (sublethal toxicities) |
| Protective Index | TD₅₀/ED₅₀ | Higher value = Safer drug | Secondary screening & candidate optimization |
Quantitative Comparison of Drug Indices
The therapeutic indices of pharmaceuticals vary dramatically across drug classes and specific agents, reflecting their distinct safety margins. Drugs with narrow therapeutic indices pose significant clinical challenges and typically require therapeutic drug monitoring to ensure safe use, while those with wide indices offer greater dosing flexibility and reduced toxicity risk.
Table 2: Therapeutic and Protective Indices of Selected Drugs
| Drug | Therapeutic Class | Therapeutic Index | Protective Index | Clinical Implications |
|---|---|---|---|---|
| Remifentanil | Opioid analgesic | 33,000:1 [1] | - | Exceptionally wide safety margin |
| Diazepam | Benzodiazepine | 100:1 [1] | - | Moderate safety margin |
| Morphine | Opioid analgesic | 70:1 [1] | - | Requires careful dosing |
| Phenytoin | Anticonvulsant | - | >5 (MES threshold) [65] | Narrow margin necessitates monitoring |
| Carbamazepine | Anticonvulsant | - | >5 (MES threshold) [65] | Narrow margin necessitates monitoring |
| Valproate | Anticonvulsant | - | >5 (MES threshold) [65] | Narrow margin necessitates monitoring |
| Cocaine | Stimulant, local anesthetic | 15:1 [1] | - | High abuse and toxicity potential |
| Ethanol | Sedative | 10:1 [1] | - | Low safety margin |
| Paracetamol/Acetaminophen | Analgesic/antipyretic | 10:1 [1] | - | Hepatotoxicity at modest overdoses |
| Digoxin | Cardiac glycoside | 2:1 [1] | - | Extremely narrow margin; requires monitoring |
| Warfarin | Anticoagulant | Narrow [1] [3] | - | Requires frequent INR monitoring |
| Lithium | Mood stabilizer | Narrow [1] [3] | - | Requires serum concentration monitoring |
The data reveal critical patterns in drug safety profiling. Note that for anticonvulsants, protective indices exceeding 5 in seizure threshold models are considered sufficient to justify further development, while indices as low as 2 may be acceptable in traditional maximal electroshock seizure (MES) or subcutaneous pentylenetetrazol (PTZ) models to avoid overlooking promising compounds [65]. This threshold variation highlights the context-dependent nature of index interpretation and the importance of model selection in preclinical assessment.
Methodological Protocols for Index Determination
Experimental Workflow for Anticonvulsant Protective Index
The determination of protective indices for anticonvulsant drugs follows a standardized experimental workflow that integrates efficacy assessments, toxicity evaluations, and computational modeling. The protocol encompasses both in vivo biological testing and in silico prediction methods, providing a comprehensive framework for safety assessment.
Diagram 1: Protective index determination workflow.
Efficacy Assessment (ED₅₀ Determination)
Maximal Electroshock Seizure (MES) Test: This primary screen models generalized tonic-clonic seizures. Mice or rats receive the test compound at various doses via predetermined route (typically intraperitoneal or oral). After the peak drug effect time (usually 0.25, 0.5, 1, 2, 4, and 24 hours), a suprathreshold electrical stimulus (50 mA for mice, 150 mA for rats; 60 Hz AC for 0.2 seconds) is delivered via corneal electrodes. Abolition of the hind limb tonic extensor component is considered a protective effect. ED₅₀ values with 95% confidence limits are calculated using probit analysis according to Litchfield and Wilcoxon [65].
Subcutaneous Pentylenetetrazol (s.c. PTZ) Test: This method models absence and myoclonic seizures. Mice or rats receive the test compound at various doses followed by subcutaneous injection of PTZ (85 mg/kg for mice, 70 mg/kg for rats). Animals are observed for 30 minutes, and failure to observe a single episode of clonic spasms lasting at least 5 seconds is considered a protective effect. ED₅₀ values are calculated using probit analysis [65].
Seizure Threshold Tests: These more sensitive alternatives include the intravenous PTZ seizure threshold test, where PTZ is infused at a constant rate (0.3-0.5 mL/min of 0.5% solution) until minimal clonic seizures occur. The test compound's effect on seizure threshold is quantified, providing ED₅₀ values for threshold increases [65].
Toxicity Assessment (TD₅₀ Determination)
Rotarod Test: This standard motor impairment assessment places mice or rats on a rotating rod (approximately 6 rpm for mice, 8-10 rpm for rats). Animals are pretrained to maintain balance for at least 60 seconds. After test compound administration, inability to maintain balance on the rotating rod for the criterion time in two consecutive trials is considered a neurological deficit. TD₅₀ values are calculated using probit analysis [65].
Chimney Test: This alternative toxicity assay involves placing mice in a glass tube (30 cm long, 3 cm diameter) with a rough inner surface. Animals naturally crawl backward to exit. After test compound administration, failure to climb backward within 60 seconds is considered a motor impairment endpoint. TD₅₀ values are calculated using probit analysis [65].
Quantitative Structure-Index Relationship (QSIR) Modeling
Modern approaches to protective index estimation incorporate computational methods to predict indices based on chemical structure:
Descriptor Calculation: Molecular descriptors encoding structural, electronic, and physicochemical properties are calculated for each compound using software such as Dragon, MOE, or PaDEL-Descriptor [66].
Feature Selection: Relevant molecular descriptors are identified using recursive feature elimination methods, prioritizing descriptors associated with drug-like, pharmacological, and toxicological features [66].
Model Building: Support Vector Regression (SVR) with parameters optimized via greedy search methods establishes quantitative relationships between molecular descriptors and protective indices [66].
Model Validation: Internal validation (5-fold cross-validation) and external validation (withhold test set) assess predictive capability. A QSIR model is considered successful when its predictive accuracy surpasses the literature-reported threshold of good QSAR models [66].
The Scientist's Toolkit: Essential Research Reagents and Materials
Successful determination of advanced therapeutic indices requires specialized reagents, equipment, and experimental models. The following toolkit details essential resources for conducting these assessments in a preclinical research setting.
Table 3: Research Reagent Solutions for Therapeutic Index Studies
| Category | Specific Items | Function & Application | Technical Specifications |
|---|---|---|---|
| Animal Models | Male CF#1 mice (18-25g); Male Wistar rats (100-150g) [65] | Standardized seizure and toxicity models; ensure consistent pharmacokinetics and pharmacodynamics | Group sizes of 8-10 animals per dose; housed under controlled conditions (12h light/dark cycle) |
| Seizure Induction | Pentylenetetrazol (PTZ); Electroshock apparatus (e.g., Hugo Sachs Elektronik) [65] | PTZ: Chemical seizure induction (GABAA antagonism); Electroshock: Electrical seizure induction (ion channel modulation) | PTZ: 85 mg/kg (s.c. for mice); 70 mg/kg (s.c. for rats); Electroshock: 50mA/0.2s (mice); 150mA/0.2s (rats) |
| Toxicity Assessment | Rotarod apparatus; Glass chimney tubes (30cm length, 3cm diameter) [65] | Rotarod: Quantify motor coordination deficits; Chimney test: Assess minimal neurological impairment | Rotarod: 6 rpm (mice), 8-10 rpm (rats); criterion: 60s maintenance; Chimney: 60s backward climbing |
| Computational Tools | Dragon/MOE/PaDEL software; Support Vector Regression (SVR) algorithms [66] | Calculate molecular descriptors; Build predictive QSIR models for protective index estimation | Recursive feature elimination for descriptor selection; 5-fold cross-validation for model verification |
| Reference Compounds | Carbamazepine, Phenytoin, Phenobarbital, Valproate, Ethosuximide [65] | Positive controls for assay validation; Benchmark for comparing novel compounds | Clinical anticonvulsants with established protective indices across different seizure models |
This comprehensive toolkit enables researchers to establish robust experimental systems for therapeutic index determination. The selection of appropriate animal models, seizure induction methods, and toxicity assessments forms the foundation of reliable efficacy and safety profiling. Computational tools extend these capabilities by enabling predictive modeling of compound libraries, while reference compounds provide essential benchmarks for assay validation and cross-study comparisons.
Interpretation and Application in Drug Development
The interpretation of advanced therapeutic indices requires careful consideration of the specific biological and pharmacological context. A protective index of at least 5 has been proposed as a benchmark for anticonvulsant drugs to proceed to further evaluation [65]. However, various technical, biological, and pharmacological factors can influence both anticonvulsant and neurotoxic potencies, thereby affecting protective index values. For instance, using seizure threshold tests rather than traditional MES or s.c. PTZ models with fixed seizure stimuli often yields higher protective indices, reducing the likelihood of underestimating a compound's anticonvulsant selectivity [65].
In modern drug development, the therapeutic index is increasingly calculated based on plasma exposure levels rather than simple administered doses [1] [64]. This approach accounts for inter-individual variability in drug disposition due to polymorphisms in metabolism, drug-drug interactions, or differences in body weight and environmental factors [64]. For toxicities that manifest after multiple dose administrations, the TI should be calculated using exposure at steady state rather than after a single dose to account for potential accumulation and delayed toxicity onset [64].
The application of these advanced indices extends throughout the drug development continuum. During discovery, they inform structure-activity relationship (SAR) optimization and candidate selection. In preclinical development, they guide dose selection for toxicology studies and initial human trials. Clinically, they establish therapeutic windows and risk management strategies [64]. For drugs with narrow therapeutic indices, such as warfarin, lithium, theophylline, digoxin, and gentamicin, therapeutic drug monitoring is often implemented to maintain plasma concentrations within the target range, balancing efficacy and safety [1] [3].
The relationship between advanced therapeutic indices and clinical decision-making can be visualized as a sequential evaluation process:
Diagram 2: Clinical translation of protective index data.
Advanced therapeutic indices, particularly the efficacy-based therapeutic index and protective index, represent sophisticated refinements of the classic therapeutic ratio concept. These indices provide more nuanced, clinically relevant assessments of a drug's efficacy-safety balance by focusing on therapeutic doses relative to sublethal toxicities rather than lethal endpoints. The protective index, with its intuitive interpretation where higher values indicate greater safety, has proven particularly valuable in anticonvulsant drug development, where a threshold of 5 often separates candidates worthy of further development from those requiring optimization or rejection.
The successful application of these advanced indices requires rigorous methodological approaches, including standardized efficacy models (MES test, s.c. PTZ test), neurological toxicity assessments (rotarod test, chimney test), and emerging computational methods (QSIR modeling). Interpretation must account for the specific experimental models employed, as protective indices derived from seizure threshold tests often exceed those from traditional fixed-stimulus models. Furthermore, modern drug development increasingly relies on exposure-based calculations rather than simple dose ratios, particularly for toxicities that emerge after repeated administration.
As drug discovery continues to evolve toward more targeted therapies and personalized medicine approaches, the accurate determination and interpretation of advanced therapeutic indices will remain essential for optimizing candidate selection, guiding clinical development, and ultimately ensuring that new therapeutics offer favorable benefit-risk profiles for specific patient populations.
The therapeutic index (TI) serves as a critical concept in radiotherapy, providing a quantitative framework for balancing the competing goals of achieving tumor control and minimizing normal tissue complications. This technical guide explores the fundamental principles, calculation methodologies, and clinical applications of TI in modern radiation oncology. By correlating Tumor Control Probability (TCP) with Normal Tissue Complication Probability (NTCP), radiotherapists can optimize treatment strategies to maximize curative potential while maintaining acceptable toxicity profiles. This review synthesizes current computational models, experimental protocols, and clinical validation studies, with particular emphasis on applications in cervical cancer radiotherapy. The comprehensive analysis presented herein aims to equip researchers and clinicians with the necessary tools to implement TI-based treatment optimization in both research and clinical settings.
In radiotherapy, the therapeutic index (TI) represents a quantitative correlation between tumor control probability (TCP) and normal tissue complication probability (NTCP) across different radiation doses [67]. The primary objective of curative radiotherapy is to maximize tumor cure while minimizing normal tissue complications, a balance directly governed by the TI [67]. Tumors exhibiting a wide therapeutic index are generally more easily curable by radiotherapy, as they allow for administration of tumoricidal doses without exceeding normal tissue tolerance limits [67].
The conceptual foundation of TI has driven radiation oncology research for decades, with ongoing efforts focused on expanding the TI through technological and biological innovations [68]. Modern precision radiotherapy approaches, including image-guided radiation therapy (IGRT) and intensity-modulated radiation therapy (IMRT), have significantly enhanced the TI by improving dose conformity to tumor volumes while sparing surrounding healthy tissues [68]. The clinical significance of TI extends throughout the treatment planning process, where it serves as a crucial decision-making tool for optimizing prescription doses and fractionation schemes based on individual patient anatomy and tumor characteristics.
Theoretical Framework: TCP and NTCP Models
Fundamental Mathematical Relationships
The therapeutic index in radiotherapy is quantitatively expressed through the relationship between TCP and NTCP across a range of radiation doses [67]. At its core, this relationship leverages biomathematical models that translate physical radiation doses into biological effects on both malignant and normal tissues.
Tumor Control Probability (TCP) models are predominantly based on the principle that tumor control requires inactivation of all clonogenic cells within the target volume. The classical TCP model employs Poisson statistics combined with the Linear Quadratic (LQ) model to calculate the probability of complete cancer-cell inactivation as a function of radiation dose [69]. For uniform dose distributions, TCP is calculated as:
TCP = exp [-ρV exp (-αBEDt)] [70]
Where:
- ρ = clonogenic cell density
- V = target volume
- α = coefficient of lethal damage (radiosensitivity parameter)
- BEDt = biologically effective dose to the target
For non-uniform dose distributions, the concept of Biologically Effective Equivalent Uniform Dose (BEEUD) is employed to account for dose heterogeneity across the target volume [70].
Normal Tissue Complication Probability (NTCP) models utilize different mathematical approaches, with the Niemierko model providing a commonly used framework:
NTCP = 1 / [1 + (TD50/EUD)^γ50] [70]
Where:
- γ50 = slope of the sigmoid dose-response curve at 50% complication probability
- TD50 = tolerance dose producing 50% complication probability
- EUD = equivalent uniform dose
The EUD is itself calculated using another model [70]:
EUD = [Σ (Vi × EQD2i^a) / Σ Vi]^(1/a)
Where EQD2i represents the equivalent dose in 2 Gy fractions, Vi is the volume of each element, and 'a' is a volume effect parameter.
Advanced Modeling Approaches
Contemporary TCP and NTCP modeling has evolved beyond traditional dose-volume histogram (DVH) based approaches to incorporate more sophisticated biological parameters [69]. Advanced models now account for:
- Intra-tumoral heterogeneity in radiosensitivity and clonogen density
- Regional biological variations identified through functional imaging (PET, MRI)
- Temporal factors including overall treatment time and repopulation kinetics
- Multi-organ interaction effects in normal tissue toxicity
These enhanced models facilitate a transition toward precision radiation medicine, enabling treatment individualization based on patient-specific and tumor-specific biological parameters rather than population-based averages [69].
Quantitative Data and Clinical Evidence
Recent clinical studies provide robust quantitative data on TCP and NTCP values across different treatment regimens. A 2024 prospective study of 150 cervical cancer patients offers particularly insightful comparative data [70].
Table 1: TCP and NTCP Values Across Different Brachytherapy Fractionation Schedules
| Parameter | Arm 1 (9.5 Gy × 2) | Arm 2 (7.5 Gy × 3) | Arm 3 (6.0 Gy × 4) |
|---|---|---|---|
| Median TCP | 99.6% | 94.0% | 98.1% |
| Rectal NTCP | 4.73% | 4.35% | 3.17% |
| Bladder NTCP | 0.17% | 0.04% | 0.07% |
| Overall Survival (24 months) | 90% | 86% | 84% |
This study demonstrated that Arm 1 (9.5 Gy × 2 fractions) achieved the highest TCP (99.6%) with manageable normal tissue complications (rectal NTCP = 4.73%, bladder NTCP = 0.17%) [70]. The overall survival rate was also highest in this group (90% at 24 months), supporting its designation as the optimal fractionation regimen when considering both efficacy and toxicity profiles [70].
The relatively higher TCP in Arm 1, despite its larger fraction size, highlights the importance of radiobiological optimization in treatment planning. The comparable NTCP values across all arms, with all complications reported as "less, low grade, and manageable," suggests that the higher fraction size in Arm 1 did not significantly increase clinically relevant toxicity [70].
Table 2: Patient and Treatment Characteristics in Cervical Cancer Study
| Characteristic | Arm 1 (n=50) | Arm 2 (n=50) | Arm 3 (n=50) |
|---|---|---|---|
| Median Age (years) | 57.5 | 55.5 | 53 |
| FIGO Stage IIB | 20 | 18 | 25 |
| FIGO Stage IIIB | 30 | 32 | 25 |
| Target Volume (cc, mean±SD) | 33.6±9.4 | 35.4±11.2 | 34.5±8.2 |
| Overall Treatment Time (days) | 47±6.2 | 57±6.4 | 60±8 |
Experimental Protocols and Methodologies
Clinical Study Design for TI Assessment
The cervical cancer study provides a robust methodological framework for evaluating therapeutic index in clinical settings [70]. The key components of this protocol include:
Patient Selection and Staging:
- Enrollment of 150 patients with histologically confirmed squamous cell carcinoma
- Staging according to International Federation of Gynecology and Obstetrics (FIGO) system
- Inclusion of Stage IIB and IIIB patients
- Exclusion of patients with lymph node involvement
Treatment Protocol:
- External Beam Radiotherapy (EBRT): 46 Gy in 23 fractions over 4.5 weeks
- Concurrent chemotherapy: Cisplatin (3-weekly cycles)
- Intracavitary Brachytherapy (ICBT): Randomized to three fractionation schemes:
- Arm 1: 9.5 Gy per fraction in 2 fractions
- Arm 2: 7.5 Gy per fraction in 3 fractions
- Arm 3: 6.0 Gy per fraction in 4 fractions
Dosimetric and Volumetric Analysis:
- Application of CT-compatible Fletcher suit applicator with uterine tandem and ovoids
- Contouring of High-Risk Clinical Target Volume (HR-CTVOAR) on CT slices
- Prescription to Manchester Point A with 3D planning
- Delineation of organs at risk (rectum and bladder) on each CT slice
Computational Methods for TCP/NTCP Calculation
TCP Calculation Methodology: For non-uniform dose distributions, TCP was calculated using the BEEUD concept with target volume divided into four regions, each with its own BED [70]:
BEEUDt = -(1/α) ln[(1/V) Σvi exp{-α BEDti}]
The comprehensive TCP was then calculated as: TCP = exp[-ρTVDref{[(1-CI)/CI] exp(-αBEEUD1) + DHI exp(-αBEEUD2) + (DNR-ODI) exp(-αBEEUD3) + ODI exp(-αBEEUD4)}]
Where CI, DHI, DNR, and ODI represent coverage index, dose homogeneity index, dose nonuniformity ratio, and overdose volume index, respectively [70].
NTCP Calculation Methodology: NTCP was calculated using the Niemierko model [70], with equivalent uniform dose (EUD) determined using the Kutcher method [70]. The EQD2 (equivalent dose in 2 Gy fractions) was calculated for both EBRT and brachytherapy components, with summation to determine the total equivalent dose.
Novel Experimental Approaches for TI Expansion
Emerging research focuses on molecular strategies to expand the therapeutic index. FTO inhibition represents one promising approach recently investigated in head and neck cancer models [71]. The experimental protocol includes:
In Vitro Assessment:
- Clonogenic survival assays following radiation with FTO inhibition
- Analysis of DNA damage repair (γH2AX foci quantification)
- Assessment of mRNA methylation patterns
In Vivo Validation:
- Xenograft tumor models in immunodeficient mice
- Tumor growth delay analysis with combination treatment
- Immunohistochemical analysis of tumor and normal tissue biomarkers
This methodology aims to determine whether FTO inhibition selectively sensitizes tumor cells to radiation while protecting normal tissues, thereby expanding the therapeutic index [71].
Visualization of Key Concepts
Relationship Between TCP, NTCP, and Therapeutic Index
Figure 1: Therapeutic Index Concept - The relationship between TCP and NTCP as functions of radiation dose, showing the optimal therapeutic window where tumor control is maximized while normal tissue complications remain acceptable.
Experimental Workflow for TI Assessment in Clinical Studies
Figure 2: Experimental Workflow for Therapeutic Index Assessment - Comprehensive methodology for evaluating TI in clinical studies, from patient treatment to outcome analysis.
Research Reagents and Computational Tools
Table 3: Essential Research Reagents and Computational Solutions for TI Research
| Category | Specific Tools/Reagents | Application in TI Research |
|---|---|---|
| Radiation Planning Systems | Pinnacle TPS, TomoTherapy TPS | 3D treatment planning and dose optimization |
| Brachytherapy Equipment | MicroSelectron HDR V3, Fletcher suit applicator | Precise dose delivery to target volumes |
| Dosimetry Systems | Thermoluminescent dosimeters (TLD), Ionization chambers | Dose verification in target and OARs |
| Computational Models | Linear Quadratic model, Niemierko NTCP model | Calculation of biological effective doses |
| Imaging Modalities | CT simulation, MRI-guided brachytherapy | Target and OAR delineation, dose planning |
| Biological Assays | Clonogenic survival, γH2AX foci staining | Assessment of radiation sensitivity and DNA damage |
| Molecular Reagents | FTO inhibitors, Growth factors (KGF, FGF) | Investigation of TI expansion strategies |
Discussion and Clinical Implications
The correlation between TCP and NTCP provides a powerful framework for optimizing radiotherapy treatment strategies. Clinical evidence demonstrates that fractionation regimen significantly influences both therapeutic efficacy and normal tissue toxicity [70]. The superior TCP (99.6%) and overall survival (90% at 24 months) observed with the 9.5 Gy × 2 fractionation scheme, coupled with acceptable NTCP values, underscores the importance of radiobiological optimization in treatment planning.
The expansion of therapeutic index remains a central focus in radiation oncology research. Current strategies include:
- Technological innovations in treatment delivery improving dose conformity [68]
- Biological targeting approaches utilizing functional imaging to identify radioresistant subvolumes [69]
- Molecular modifiers that selectively sensitize tumors or protect normal tissues [68] [71]
- Advanced modeling incorporating spatial dose information and tissue-specific radiosensitivity [69]
Clinical implementation of TI-based treatment planning requires careful consideration of institutional expertise, available technology, and patient-specific factors. The methodologies and data presented in this review provide a foundation for evidence-based protocol development and optimization.
Therapeutic index quantification through TCP and NTCP correlation represents a cornerstone of modern radiation oncology practice. The integration of computational models with clinical validation studies enables data-driven treatment individualization, ultimately improving the therapeutic ratio. Future research directions should focus on:
- Multi-parameter models incorporating genomic, imaging, and clinical data
- Real-time adaptive planning based on temporal biological changes
- Expanded clinical validation across diverse tumor sites and patient populations
- Standardization of reporting metrics for therapeutic index assessment
As radiotherapy continues its evolution toward precision medicine, the strategic assessment and optimization of therapeutic index will remain essential for maximizing clinical outcomes while minimizing treatment-related morbidity.
The Therapeutic Index (TI) is a fundamental pharmacological ratio that quantifies the safety margin of a drug by comparing the dose or concentration at which it becomes toxic to the dose required for its therapeutic effect [3] [15]. It is a cornerstone of drug safety, guiding dosing decisions in clinical practice and informing risk-benefit assessments throughout drug development [3].
The standard calculation for the Therapeutic Index in preclinical studies is:
Therapeutic Index (TI) = Toxic Dose 50 (TD₅₀) / Effective Dose 50 (ED₅₀)
- TD₅₀: The dose that produces a toxic effect in 50% of the population.
- ED₅₀: The dose that produces a therapeutic effect in 50% of the population [3] [15].
In clinical practice, this concept is often translated to the comparison of minimum toxic concentrations (MTC) and minimum effective concentrations (MEC) in the blood [15]. A high TI indicates a wide safety margin, whereas a Narrow Therapeutic Index (NTI) indicates that small increases in dose can lead to toxic effects, necessitating careful patient monitoring and, often, therapeutic drug monitoring (TDM) [3] [15]. Drugs like warfarin, lithium, and digoxin are classic examples of NTI drugs [3].
Table 1: Traditional TI Calculation and Drug Classification
| Term | Definition | Role in TI Assessment |
|---|---|---|
| ED₅₀ | Dose effective in 50% of a population | Establishes baseline potency and efficacy for the denominator in the TI ratio [3] |
| TD₅₀ | Dose toxic in 50% of a population | Establishes baseline safety concern for the numerator in the TI ratio [3] |
| LD₅₀ | Dose lethal in 50% of an animal population | Used in preclinical animal studies to estimate potential lethal dose [3] |
| Wide TI | A large ratio between TD₅₀ and ED₅₀ (often >10) | Indicates a safer drug with a broad margin between effective and toxic doses (e.g., penicillin) [3] |
| Narrow TI (NTI) | A small ratio between TD₅₀ and ED₅₀ (e.g., <2) | Indicates a higher-risk drug where small dose changes can cause toxicity or lack of efficacy (e.g., digoxin, warfarin) [15] |
The Need for Enhanced Prediction in Modern Drug Development
The traditional approach to determining TI has significant limitations. It often relies on population averages (ED₅₀, TD₅₀), which mask inter- and intra-individual variability caused by genetics, comorbidities, drug interactions, and other factors [15]. This variability is a major challenge, particularly for NTI drugs, where it can lead to therapeutic failure or severe adverse events [15].
Furthermore, the drug development pipeline is increasingly focused on complex diseases and novel modalities like cell and gene therapies, for which traditional TI models are insufficient [72] [73]. This creates a pressing need for more precise, predictive tools that can deconvolute patient variability and provide an individualized safety assessment early in the development process. Enhancing TI prediction is critical for accelerating the development of safer, more effective targeted therapies.
Computational Modeling for TI Prediction
Artificial intelligence (AI) and computational modeling are revolutionizing TI prediction by moving beyond static population averages to dynamic, multi-factorial simulations.
AI and Machine Learning in Pharmacokinetics/Pharmacodynamics (PK/PD)
AI and machine learning (ML) are now applied to analyze vast datasets—including genomic, proteomic, and clinical data—to predict a drug's absorption, distribution, efficacy, and toxicity profile [74] [75]. These models can identify complex, non-linear relationships that are difficult for humans to discern. For instance, AI is used to forecast disease progression and treatment responses based on biomarker profiles, thereby refining predictions of a drug's effective and toxic doses for specific patient subpopulations [76].
Quantitative Systems Pharmacology (QSP) and Virtual Patients
Quantitative Systems Pharmacology (QSP) represents a paradigm shift. QSP models simulate drug effects on virtual patient populations by integrating knowledge of biological pathways, disease processes, and drug mechanisms [73]. This approach allows for the creation of "digital twins" or virtual patient cohorts, enabling researchers to run thousands of simulated clinical trials [73]. These simulations test dosing regimens and refine inclusion criteria before a single patient is dosed, providing a powerful method to predict TI and optimize trial design for both efficacy and safety with unprecedented confidence and speed [73].
Table 2: Computational Approaches for Enhanced TI Prediction
| Methodology | Core Function | Application in TI Prediction |
|---|---|---|
| AI/ML Predictive Analytics | Analyzes multimodal datasets (genomic, clinical, trial data) to identify patterns [72] [76] | Predicts patient-specific therapeutic responses and adverse effect risks, personalizing the TI [74] |
| Quantitative Systems Pharmacology (QSP) | Models complex interactions between drugs and biological systems on a whole-body scale [73] | Simulates TI in virtual patient populations, accounting for system-level biology and variability [73] |
| Virtual Patient/Digital Twin | Creates in-silico representations of patients or control arms for clinical trials [73] | Enables high-throughput in-silico testing of TI across diverse virtual populations, de-risking real-world trials [73] |
| In-silico Discovery & Design | Uses generative AI and molecular modeling to design novel drug candidates [74] [77] | Predicts toxicity and efficacy of molecules prior to synthesis, influencing early TI estimates [74] |
Experimental Protocol: Implementing a QSP Workflow for TI Estimation
Objective: To develop and validate a QSP model for predicting the TI of a novel drug candidate in a specific disease context.
Model Construction:
- Literature Review & Data Curation: Systematically gather existing in-vitro and in-vivo data on the target pathway, disease pathophysiology, and relevant compound class. Data includes rate constants, protein expression levels, and known drug-target binding affinities [74].
- Model Encoding: Formalize the biological system as a set of ordinary differential equations (ODEs) representing key pathways. Populate the model with initial parameters from the curated data.
Virtual Population Generation:
- Define physiological and genetic parameter distributions (e.g., enzyme expression levels, organ volumes, glomerular filtration rate) from real-world demographic and omics databases [76].
- Use Monte Carlo sampling to generate a cohort of 1,000-10,000 virtual patients reflecting natural population variability [73].
Simulation and TI Analysis:
- Simulate the administration of a range of drug doses to the virtual population.
- For each virtual patient and dose, record the primary efficacy endpoint and the severity of key adverse events.
- Calculate population-level dose-response curves for both efficacy and toxicity.
Model Validation and Refinement:
- Compare simulation outputs against data from early-phase clinical trials (if available) or historical comparator data.
- Iteratively refine model parameters to improve predictive accuracy. A validated model can then be used to predict TI in new patient subgroups or to optimize dosing regimens for Phase III trials.
Diagram 1: QSP modeling workflow for predicting therapeutic index. The process integrates diverse biological data to build and validate a predictive model through iterative refinement.
The Role of Biomarkers in Precision TI Assessment
Biomarkers are measurable indicators of biological processes, and their integration is pivotal for transitioning from a population-based TI to a patient-specific TI.
Expanding the Biomarker Toolbox: Multi-Omics and Liquid Biopsies
The trend toward multi-omics integration—combining genomics, proteomics, metabolomics, and transcriptomics—provides a holistic view of disease mechanisms and patient-specific drivers of drug response [76]. This comprehensive profiling enables the identification of biomarker signatures that can predict both efficacy and toxicity before they manifest clinically.
Furthermore, liquid biopsy technologies are advancing rapidly. Analysis of circulating tumor DNA (ctDNA) and exosomes allows for non-invasive, real-time monitoring of disease progression and treatment response [76]. In the context of TI, this means that the "effective dose" can be dynamically tailored based on a molecular response, and early signs of toxicity can be detected through changes in specific protein or metabolic biomarkers, allowing for preemptive dose adjustments.
Biomarker-Driven Clinical Trial Designs
AI is also transforming clinical trial design, making trials smarter and more efficient. AI-powered trial simulations use historical and real-world data to optimize protocols, predict recruitment rates, and identify the patients most likely to respond to treatment [77] [78]. This leads to more precise cohort identification and enhances the ability to detect a meaningful TI within a specific population. The use of AI-generated synthetic control arms, built from real-world data, can reduce the number of patients required for a trial while providing robust efficacy and safety comparisons, thereby refining TI estimation [73].
Table 3: Biomarker Categories for Precision TI Assessment
| Biomarker Category | Measured Component | Utility in TI Assessment |
|---|---|---|
| Genomic Biomarkers | DNA sequences, mutations, polymorphisms (e.g., CYP450 variants) [15] | Predicts metabolic capacity and PK variability, identifying patients at risk of toxicity or non-response [15] |
| Proteomic Biomarkers | Protein expression and post-translational modification levels (e.g., phospho-Tau) [73] | Monitors proximal drug target engagement and early efficacy/toxicity signals in accessible biofluids [76] |
| Metabolomic Biomarkers | Small-molecule metabolite profiles | Provides a functional readout of physiological state and drug-induced metabolic shifts, indicating toxicity [76] |
| Circulating Tumor DNA (ctDNA) | Tumor-derived DNA fragments in blood [76] | Enables real-time monitoring of tumor burden and response, dynamically defining the "effective dose" [76] |
| Functional Biomarkers (e.g., ERP) | Event-Related Potentials (ERP) from EEG [78] | Provides objective, functional readouts of brain activity for CNS drugs, quantifying efficacy and potential side effects [78] |
Experimental Protocol: Developing a Predictive Biomarker Signature for TI
Objective: To discover and validate a multi-omics biomarker signature that predicts the risk of hepatotoxicity (a key toxic dose determinant) for a new drug.
Study Design & Sample Collection:
- Conduct a prospective clinical study with standardized dosing. Collect baseline and serial post-dose blood samples from a diverse patient cohort.
- Isolate plasma for proteomic/metabolomic analysis and DNA for genomic sequencing.
Multi-Omics Profiling:
- Genomics: Perform whole-genome sequencing or targeted sequencing of pharmacogenes (e.g., genes involved in the drug's metabolism).
- Proteomics/Metabolomics: Use LC-MS/MS platforms to quantify protein and metabolite levels in plasma samples collected before and after drug exposure [76].
Data Integration and Signature Discovery:
- Use machine learning algorithms (e.g., random forest, regularized regression) to integrate the multi-omics data with clinical outcomes (e.g., ALT levels for liver injury).
- Identify a parsimonious panel of biomarkers (e.g., a specific SNP, a protein, and a metabolite) that collectively stratify patients into low, medium, and high risk of hepatotoxicity.
Analytical and Clinical Validation:
- Analytical Validation: Establish a robust, clinically applicable assay (e.g., multiplex immunoassay or targeted MS panel) for the biomarker signature.
- Clinical Validation: Validate the predictive power of the signature in a large, independent patient cohort to confirm its utility in personalizing the drug's TI and guiding safe dosing.
Diagram 2: Multi-omics biomarker signature development. Data from diverse molecular layers is integrated computationally to derive a signature that can stratify patients by toxicity risk, enabling a personalized TI.
The Scientist's Toolkit: Essential Reagents and Technologies
Success in this new paradigm requires a specific set of research tools and technologies that enable high-dimensional data generation and analysis.
Table 4: Key Research Reagent Solutions for Advanced TI Research
| Tool / Reagent | Function | Specific Application in TI Research |
|---|---|---|
| Multiplex Immunoassay Panels | Simultaneously quantify multiple proteins/cytokines in a single sample (e.g., using Luminex or Olink) [76] | Profiles complex pharmacodynamic responses and early inflammatory toxicity signals across many pathways at once [72] |
| Targeted Mass Spectrometry Kits | Pre-optimized assays for precise quantification of specific metabolites or proteins (e.g., via SRM/MRM) [76] | Validates candidate biomarker panels discovered in untargeted screens for robust clinical translation [76] |
| CRISPR-based Screening Libraries | Genome-wide or pathway-focused guide RNA libraries for functional genomics | Systematically identifies genetic modifiers of drug efficacy and toxicity in cellular models [73] |
| Stable Cell Line Panels | Engineered cell lines expressing variant pharmacogenes (e.g., CYP2D6 *1, *4, *10) [15] | Models the impact of human genetic polymorphism on drug metabolism and cellular toxicity in vitro [15] |
| AAV Immunogenicity Assays | Measures pre-existing and treatment-induced immunity to AAV capsids [72] | Critical for assessing toxicity risk and defining safe dosing for gene therapies, a key component of their TI [72] |
| Spatial Biology Reagents | Multiplexed immunohistochemistry/in situ hybridization kits (e.g., CODEX, GeoMx) | Characterizes complex cell-cell interactions and drug distribution within tissues, linking location to effect/toxicity [72] |
The future of Therapeutic Index prediction is being fundamentally reshaped by the convergence of computational modeling and advanced biomarker science. The move away from static, population-level ratios toward dynamic, patient-specific predictions represents a paradigm shift in drug development. By leveraging QSP models, AI-powered analytics, and multi-omics biomarker signatures, researchers can now more accurately deconvolute the complex interplay between efficacy and toxicity. This enhanced predictive power enables the design of safer, more effective drugs from the outset and allows for their deployment in precisely defined patient populations, ultimately maximizing therapeutic benefit while minimizing risk. The ongoing integration of these technologies promises to accelerate the development of new medicines, particularly for diseases with high unmet need and for complex therapeutic modalities like gene and cell therapies.
Conclusion
The therapeutic index remains a cornerstone of drug safety assessment, providing an essential, though not exhaustive, metric for balancing efficacy and toxicity. A thorough understanding of its calculation, interpretation, and limitations is crucial for drug development professionals. For NTI drugs, meticulous patient monitoring and personalized dosing are imperative. Future directions will likely involve greater integration of pharmacogenomic data, refined physiologically-based pharmacokinetic (PBPK) modeling, and advanced biomarkers to better predict individual patient response, ultimately aiming to widen the therapeutic index and improve the safety profile of new therapeutic agents.
References
- 1. Therapeutic index [https://en.wikipedia.org/wiki/Therapeutic_index]
- 2. The determination and interpretation of the therapeutic ... [https://pubmed.ncbi.nlm.nih.gov/22935759/]
- 3. What is the therapeutic index of drugs? [https://www.medicalnewstoday.com/articles/therapeutic-index]
- 4. Drug Therapeutic Index - an overview [https://www.sciencedirect.com/topics/nursing-and-health-professions/drug-therapeutic-index]
- 5. Therapeutic Index [https://pharmacologycanada.org/Therapeutic-Index]
- 6. Therapeutic index, ED50, TD50 and LD50 [https://derangedphysiology.com/main/cicm-primary-exam/pharmacodynamics/Chapter-413/therapeutic-index-ed50-td50-and-ld50]
- 7. 7.2: Therapeutic index [https://chem.libretexts.org/Courses/Brevard_College/CHE_202%3A_Organic_Chemistry_II/07%3A_Organic_Chemistry_of_Drugs/7.02%3A_Therapeutic_index]
- 8. A Comparative Study upon the Therapeutic Indices of ... [https://pmc.ncbi.nlm.nih.gov/articles/PMC3586832/]
- 9. Quantal Dose-Response Curve [https://pharmacologycanada.org/Quantal-Dose-Response-Curve]
- 10. Quantal Dose-Response Curves - (Intro to Pharmacology) [https://fiveable.me/key-terms/introduction-to-pharmacology/quantal-dose-response-curves]
- 11. ED50 - StatPearls - NCBI Bookshelf - NIH [https://www.ncbi.nlm.nih.gov/books/NBK538269/]
- 12. Quantal Dose—Response: Probits [https://link.springer.com/chapter/10.1007/978-1-4612-4974-0_10]
- 13. Pharmacodynamic Mechanisms - General Principles of ... [https://www.dentalcare.com/en-us/ce-courses/ce580/pharmacodynamic-mechanisms]
- 14. Therapeutic Window - an overview [https://www.sciencedirect.com/topics/nursing-and-health-professions/therapeutic-window]
- 15. Narrow therapeutic index drugs: a clinical pharmacological ... [https://pmc.ncbi.nlm.nih.gov/articles/PMC4412688/]
- 16. Margin of Safety in Pharmacology | Definition & Equation [https://study.com/learn/lesson/margin-safety-calculation-formula.html]
- 17. Therapeutic Index: Definition, Importance, and Examples [https://knyamed.com/blogs/resources/what-is-therapeutic-index?srsltid=AfmBOopFVCydMxmMdzXVx2gbBOLDW2-y-05csHxC2MydKzgzYm2_u4dh]
- 18. Making drugs from T cells: The quantitative pharmacology ... [https://www.nature.com/articles/s41540-024-00355-3]
- 19. Therapeutic Window - an overview [https://www.sciencedirect.com/topics/pharmacology-toxicology-and-pharmaceutical-science/therapeutic-window]
- 20. Overview of Therapeutic Drug Monitoring - PMC [https://pmc.ncbi.nlm.nih.gov/articles/PMC2687654/]
- 21. Therapeutic Index - Pharmacology [https://step1.medbullets.com/pharmacology/107009/therapeutic-index]
- 22. Therapeutic Index: Definition & Formula | Vaia [https://www.vaia.com/en-us/explanations/medicine/pharmacology-toxicology/therapeutic-index/]
- 23. A systematic literature review approach to estimate the ... [https://pmc.ncbi.nlm.nih.gov/articles/PMC5235278/]
- 24. Identification of the key target profiles underlying the drugs ... [https://www.sciencedirect.com/science/article/pii/S2001037021001471]
- 25. An optimized thermodynamics integration protocol for ... [https://pmc.ncbi.nlm.nih.gov/articles/PMC10235760/]
- 26. Bridging Preclinical and Clinical Gaps: Strategies to Improve ... [https://gvrp.in/bridging-preclinical-and-clinical-gaps-strategies-to-improve-translational-success/]
- 27. Bridging the Gap: Translating Preclinical Biomarkers to ... [https://blog.crownbio.com/bridging-the-gap-translating-preclinical-biomarkers-to-clinical-success]
- 28. Preclinical vs. Clinical Biomarkers: Understanding Their ... [https://blog.crownbio.com/preclinical-vs-clinical-biomarkers-understanding-their-distinct-roles-in-drug-development]
- 29. Advanced Methods for Dose and Regimen Finding During ... [https://pmc.ncbi.nlm.nih.gov/articles/PMC5529745/]
- 30. Application of Pharmacokinetic/Pharmacodynamic Modeling ... [https://pmc.ncbi.nlm.nih.gov/articles/PMC9251408/]
- 31. Understanding Pharmacokinetics & Pharmacodynamics [https://alimentiv.com/pharmacokinetics-vs-pharmacodynamics/]
- 32. Therapeutic Index: Definition, Importance, and Examples [https://knyamed.com/blogs/resources/what-is-therapeutic-index?srsltid=AfmBOooS7f6WE4flhYJKaR4kVnUyjuI2x4xRnrCohINrjm8QjX14SC07]
- 33. Consideration of Pharmacokinetic Pharmacodynamic ... - NCBI [https://www.ncbi.nlm.nih.gov/books/NBK57267/]
- 34. The evolving role of investigative toxicology in ... [https://www.nature.com/articles/s41573-022-00633-x]
- 35. In vitro safety pharmacology profiling: an essential tool for ... [https://www.sciencedirect.com/science/article/abs/pii/S1359644605036329]
- 36. Predicting Treatment Effects Using Biomarker Data in a ... [https://pmc.ncbi.nlm.nih.gov/articles/PMC4153610/]
- 37. A Bayesian prediction model between a biomarker and ... - Trials [https://trialsjournal.biomedcentral.com/articles/10.1186/1745-6215-15-500]
- 38. Early Adverse Event Derived Biomarkers in Predicting ... [https://www.mdpi.com/2072-6694/15/9/2521]
- 39. Setting and Implementing Standards for Narrow ... [https://www.fda.gov/drugs/cder-conversations/setting-and-implementing-standards-narrow-therapeutic-index-drugs]
- 40. Narrow Therapeutic Index Drugs: FDA Experience, Views, ... [https://pubmed.ncbi.nlm.nih.gov/39529254/]
- 41. Analysis on the Impact of U.S. FDA's Narrow Therapeutic ... [https://link.springer.com/article/10.1208/s12248-025-01020-1]
- 42. A Two-Way Proposal for the Determination of ... [https://pmc.ncbi.nlm.nih.gov/articles/PMC11125232/]
- 43. Meta-analysis of inter-patient pharmacokinetic variability ... [https://pmc.ncbi.nlm.nih.gov/articles/PMC3877184/]
- 44. Pharmacogenetics: An Important Part of Drug Development ... [https://pmc.ncbi.nlm.nih.gov/articles/PMC7255432/]
- 45. Exploring inter-ethnic and inter-patient variability ... [https://www.frontiersin.org/journals/pharmacology/articles/10.3389/fphar.2024.1363259/full]
- 46. Chapter 1 Pharmacokinetics & Pharmacodynamics - NCBI - NIH [https://www.ncbi.nlm.nih.gov/books/NBK595006/]
- 47. Pharmacogenetic Application in Drug Development and ... [https://www.sciencedirect.com/science/article/abs/pii/S0090955624041928]
- 48. State of Art of Dose Individualization to Support tacrolimus ... [https://www.frontierspartnerships.org/journals/transplant-international/articles/10.3389/ti.2025.14201/full]
- 49. Therapeutic drug monitoring in patients treated with vancomycin [https://pmc.ncbi.nlm.nih.gov/articles/PMC12457563/]
- 50. Drugs with narrow therapeutic index as indicators in the ... [https://pmc.ncbi.nlm.nih.gov/articles/PMC4140577/]
- 51. A Proposal for Alternative FDA Bioequivalence Criteria ... [https://pubmed.ncbi.nlm.nih.gov/41168569/]
- 52. Drug–drug–gene interactions and adverse drug reactions [https://www.nature.com/articles/s41397-019-0122-0]
- 53. The Influence of Pharmacogenetics on the Clinical ... [https://pmc.ncbi.nlm.nih.gov/articles/PMC8160673/]
- 54. Biomarkers as Prognostic Predictors and Therapeutic Guide in ... [https://pmc.ncbi.nlm.nih.gov/articles/PMC9965041/]
- 55. Predictive Safety Testing Consortium [https://c-path.org/program/predictive-safety-testing-consortium/]
- 56. From Pharmacokinetics to Pharmacogenomics: A New ... [https://www.sciencedirect.com/science/article/pii/S1600613522074706]
- 57. Bioequivalence, Drugs with Narrow Therapeutic Index and the ... [https://pmc.ncbi.nlm.nih.gov/articles/PMC9394341/]
- 58. The Composite Digital Therapeutic Index (cDTI) [https://pmc.ncbi.nlm.nih.gov/articles/PMC12066087/]
- 59. Investigation of bioequivalence - Scientific guideline [https://www.ema.europa.eu/en/investigation-bioequivalence-scientific-guideline]
- 60. 2.6.6.2.4: Determining the Safety of a Drug [https://bio.libretexts.org/Courses/Coastline_College/ENVS_C100%3A_Environmental_Science_(Hoerer)/02%3A_Environmental_Chemistry/2.06%3A_Toxicology_MSDT/2.6.06%3A_Principles_of_Toxicology/2.6.6.02%3A_Dose_and_Dose_Response/2.6.6.2.04%3A_Determining_the_Safety_of_a_Drug]
- 61. Comparative therapeutic index, lethal time and safety margin ... [https://pmc.ncbi.nlm.nih.gov/articles/PMC7296648/]
- 62. Regulatory Divergence in Narrow Therapeutic Index Drugs [https://pubmed.ncbi.nlm.nih.gov/41219563/]
- 63. Regulatory Divergence in Narrow Therapeutic Index Drugs [https://link.springer.com/article/10.1208/s12248-025-01159-x]
- 64. The determination and interpretation of the therapeutic ... [https://www.nature.com/articles/nrd3801]
- 65. The role of technical, biological and pharmacological ... [https://pubmed.ncbi.nlm.nih.gov/1884714/]
- 66. Predicting the protective index of anticonvulsants using a ... [https://pubmed.ncbi.nlm.nih.gov/27262528/]
- 67. Therapeutic Index and Its Clinical Significance [https://link.springer.com/chapter/10.1007/978-981-15-0073-2_31]
- 68. Expanding the therapeutic index of radiation therapy by ... [https://pmc.ncbi.nlm.nih.gov/articles/PMC6435054/]
- 69. Increasing the power of tumour control and normal tissue ... [https://tcr.amegroups.org/article/view/14116/html]
- 70. Tumor Control and Normal Tissue Complications in High-dose ... [https://pmc.ncbi.nlm.nih.gov/articles/PMC11548083/]
- 71. FTO inhibition enhances the therapeutic index of radiation ... [https://insight.jci.org/articles/view/184968]
- 72. How AI & Biomarkers Are Reshaping the Next Frontier in ... [https://www.precisionformedicine.com/blog/how-ai-biomarkers-are-reshaping-the-next-frontier-in-drug-development]
- 73. The latest trends in drug discovery [https://www.cas.org/resources/cas-insights/2025-drug-discovery-trends]
- 74. The future of pharmaceuticals: Artificial intelligence in drug ... [https://www.sciencedirect.com/science/article/pii/S2095177925000656]
- 75. Drug Development 2025: Top Pharma Trends to Watch [https://www.piramalpharmasolutions.com/resources/blogs/drug-development-key-trends-2025]
- 76. Challenges and Future Trends in Biomarker Analysis for ... [https://blog.crownbio.com/challenges-and-future-trends-in-biomarker-analysis-for-clinical-research-whats-ahead-in-2025]
- 77. Tech, ML and AI: Industry predictions for 2025 [https://www.ddw-online.com/tech-ml-and-ai-industry-predictions-for-2025-33318-202501/]
- 78. 5 expert predictions cover synthetic data, hybrid trials and more [https://www.drugdiscoverytrends.com/drug-development-in-2025-5-expert-predictions-cover-synthetic-data-hybrid-trials-and-more/]