Traditional vs. Mechanism-Based PK Modeling: A Strategic Guide for Drug Development
This article provides a comprehensive comparison for researchers and drug development professionals between traditional (compartmental, non-compartmental) and mechanism-based (PBPK, PK/PD) pharmacokinetic modeling approaches.
Traditional vs. Mechanism-Based PK Modeling: A Strategic Guide for Drug Development
Abstract
This article provides a comprehensive comparison for researchers and drug development professionals between traditional (compartmental, non-compartmental) and mechanism-based (PBPK, PK/PD) pharmacokinetic modeling approaches. We explore their foundational principles, methodological applications, and strategic selection criteria. Drawing on recent studies and trends, the content synthesizes key differentiators, practical implementation challenges, and validation paradigms. The objective is to equip scientists with the knowledge to select the optimal modeling framework for enhancing predictive accuracy, streamlining development, and informing critical decisions from preclinical translation to clinical dose optimization.
Core Concepts: Defining Traditional Empiricism and Mechanistic Principles in PK Modeling
What is Pharmacokinetic Modeling? Defining the ADME Framework
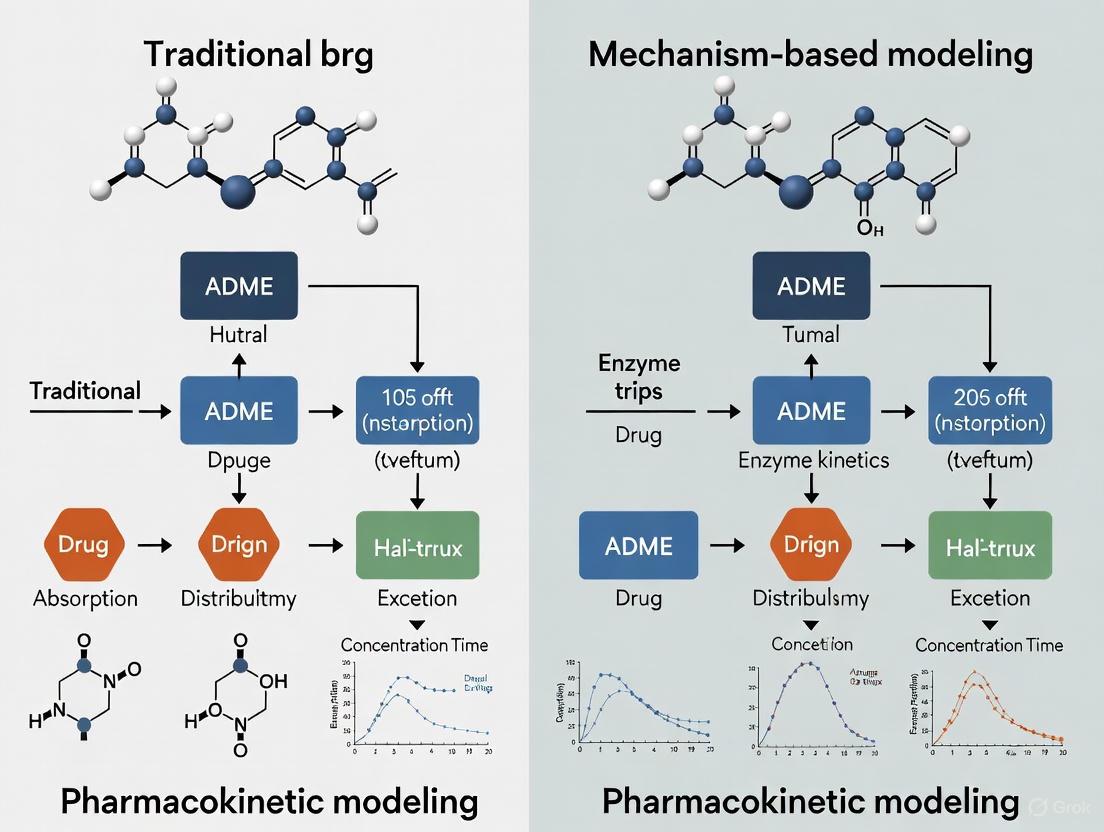
Pharmacokinetic (PK) modeling is a mathematical discipline that quantifies how the body absorbs, distributes, metabolizes, and excretes a drug. By describing the time course of drug concentrations in the body, these models are indispensable for predicting efficacy, optimizing dosing regimens, and ensuring patient safety during drug development [1]. The foundation of pharmacokinetics is the ADME framework, which encompasses the key processes a drug undergoes after administration.
This guide compares two fundamental approaches in the field: traditional compartmental modeling and advanced mechanism-based modeling, providing researchers with a clear analysis of their methodologies, applications, and performance.
The ADME Framework: Core of Pharmacokinetics
The ADME framework describes the journey of a drug through the body, with each process influencing the drug's concentration at its site of action [1].
- Absorption: This is the process by which a drug enters the systemic circulation from its site of administration (e.g., the gastrointestinal tract for an oral drug). Factors like formulation and food effects can significantly impact the rate and extent of absorption, determining the drug's bioavailability [1].
- Distribution: Once in the bloodstream, the drug is distributed to various tissues and fluids. This process is influenced by blood flow, tissue permeability, and the degree of plasma protein binding, which affects how much free drug is available to exert its effect [1].
- Metabolism: The body typically transforms drugs into more water-soluble metabolites, primarily in the liver. Metabolism can inactivate a drug, activate a prodrug, or sometimes produce toxic metabolites. The cytochrome P450 enzyme family is a major player in this process [2] [1].
- Excretion: This is the removal of the drug and its metabolites from the body, occurring mainly through the kidneys (urine) or liver (bile) [1].
The following diagram illustrates the interconnected nature of these processes and their relationship with pharmacodynamics (PD), which studies the drug's effect on the body.
Traditional vs. Mechanism-Based Pharmacokinetic Modeling
The core difference between traditional and modern PK modeling lies in their descriptive versus predictive nature. The table below summarizes the key characteristics of each approach.
Table 1: Comparison of Traditional and Mechanism-Based PK Modeling Approaches
| Feature | Traditional Compartmental Modeling | Mechanism-Based PBPK/PKPD Modeling |
|---|---|---|
| Core Philosophy | Empirically describes plasma concentration-time data [3] | Mechanistically simulates biological and drug-specific processes [4] [5] |
| Model Structure | Abstract "compartments" not directly tied to physiology (e.g., central, peripheral) [3] | Physiologically realistic structure representing organs/tissues with blood flows [6] [5] |
| Primary Output | Estimates of model parameters (e.g., clearance, volume of distribution) [3] | Prediction of drug concentrations in specific tissues and the impact of system perturbations [6] [7] |
| Extrapolation Power | Limited; relies on data from similar scenarios [4] | High; can extrapolate across populations, diseases, and dosing regimens by altering system parameters [6] [4] |
| Key Application | Population PK (PopPK) analysis to identify sources of variability in patient exposure [3] [8] | Predicting drug-drug interactions (DDIs), first-in-human dosing, and effects in special populations [6] [5] [2] |
The Evolution to Mechanism-Based Models
Mechanism-based pharmacokinetic-pharmacodynamic (PK/PD) modeling represents a significant advancement. Unlike empirical models that merely describe data, mechanism-based models incorporate specific expressions to characterize the causal path between drug administration and its effect [4]. This includes:
- Target Occupancy: Modeling the binding of a drug to its molecular target (e.g., receptors, enzymes) [4].
- Target Activation: Quantifying the signal transduction processes that follow target binding [4] [9].
- Disease Progression: Integrating models of how a disease evolves over time and how a drug modifies this progression [7].
This mechanistic foundation provides vastly improved properties for extrapolation and prediction, forming a scientific basis for rational drug discovery and development [4].
Experimental Data and Model Performance Comparison
Case Study 1: PBPK for Drug-Drug Interaction (DDI) Prediction
A study developed a PBPK model for suraxavir marboxil (GP681), a prodrug, and its active metabolite (GP1707D07) to assess DDI risk with CYP3A4 inhibitors [2].
- Methodology: The model was built using in vitro physicochemical and metabolic parameters and verified against clinical data from a phase I DDI study with the strong inhibitor itraconazole [2].
- Results: The validated model predicted a significant increase in the active metabolite's exposure when co-administered with moderate inhibitors like fluconazole (AUC ratio 2.82) and verapamil (AUC ratio 2.35), comparable to the effect of itraconazole [2]. This demonstrates the utility of PBPK modeling for efficient DDI assessment without the need for multiple clinical trials.
Case Study 2: PBPK for Pediatric Dose Selection
A PBPK model was developed for ALTUVIIIO, a novel hemophilia A therapy, to support dosing in children under 12 [5].
- Methodology: A minimal PBPK model for monoclonal antibodies was used, incorporating the FcRn recycling pathway. The model was first validated using clinical data from a similar drug (ELOCTATE) by optimizing age-dependent parameters like FcRn abundance [5].
- Results: The model accurately predicted exposure in both adults and children, with prediction errors for key metrics (Cmax and AUC) within ±25%, confirming its utility for pediatric dose justification before clinical data collection [5].
Quantitative Model Performance Metrics
When comparing PopPK models, especially for clinical Model-Informed Precision Dosing (MIPD), performance is evaluated using specific metrics. The following table outlines the key metrics and why the forecasting approach is considered the gold standard for real-world applicability [10].
Table 2: Key Metrics for Evaluating Pharmacokinetic Model Performance
| Metric | Definition | Interpretation in PK Context | Gold Standard Approach |
|---|---|---|---|
| Bias (MPE) | Mean Prediction Error: Average difference between predicted and observed concentrations [10] | Measures whether a model consistently under- or over-predicts drug levels. Ideal value is 0 [10]. | Forecasting future drug levels (Approach 3) [10] |
| Accuracy (e.g., % within range) | Percentage of predictions within a pre-defined acceptable range (e.g., within 15% of the observed value) [10] | A more critical measure than bias; indicates the proportion of clinically usable predictions. Higher is better [10]. | Forecasting future drug levels (Approach 3) [10] |
| AIC/BIC | Akaike/Bayesian Information Criterion: Penalizes the model's objective function value for complexity [3] | Used for structural model selection during development. Lower values indicate a better balance of fit and parsimony [3]. | Model fitting to historical data (Approach 2) [10] |
Research Toolkit: Essential Methods and Reagents
Successful PK modeling relies on a combination of in silico, in vitro, and in vivo tools.
Diagram: Integrated Workflow in Modern PK Modeling
Key Research Reagents and Solutions
| Tool / Reagent | Function in PK Modeling |
|---|---|
| LC-MS/MS (Liquid Chromatography-Tandem Mass Spectrometry) | Gold-standard analytical method for the sensitive and specific quantification of drug and metabolite concentrations in biological samples (e.g., plasma, tissues) [1]. |
| Recombinant CYP Enzymes / Human Hepatocytes | In vitro systems used to characterize a drug's metabolic stability, identify metabolizing enzymes, and obtain parameters (e.g., Km, Vmax) for PBPK models [2]. |
| CRISPR/Cas9 Gene Editing | Technology to create novel animal models (e.g., humanized enzyme rats) for studying the specific role of genetic factors in drug metabolism and transport [6]. |
| NLME Software (e.g., NONMEM) | Industry-standard software for performing population PK analysis using non-linear mixed-effects models, which handle sparse and dense data from diverse populations [3] [8]. |
| PBPK Software Platforms (e.g., GastroPlus, Simcyp) | Commercial platforms containing extensive physiological and demographic databases to build, simulate, and verify PBPK models for prediction in virtual populations [6] [5]. |
The evolution from traditional compartmental models to mechanism-based PBPK and PK/PD modeling marks a paradigm shift in drug development. While traditional PopPK remains valuable for analyzing variability in observed clinical data [3] [8], mechanism-based models offer superior predictive power for de-risking development [6] [4]. The integration of these models with artificial intelligence and machine learning is further automating and enhancing their capabilities, promising even faster and more effective development of safe, personalized therapies [6] [8]. The choice between approaches is not mutually exclusive; rather, they are complementary tools that, when used together, provide a comprehensive quantitative framework for informed decision-making from the lab to the clinic.
In the evolving landscape of model-informed drug development (MIDD), traditional pharmacokinetic analysis methods remain fundamental tools for characterizing drug behavior in vivo [11]. Compartmental modeling and non-compartmental analysis (NCA) represent two cornerstone approaches for quantifying drug absorption, distribution, metabolism, and excretion (ADME) properties [12]. While mechanism-based approaches like physiologically based pharmacokinetic (PBPK) modeling continue to advance, compartmental and NCA methods provide the critical foundation for understanding fundamental pharmacokinetic parameters [7] [5]. These traditional frameworks continue to play essential roles across drug discovery, preclinical development, and clinical trials, supporting critical decisions from lead optimization to dosage selection [11] [13].
The strategic selection between compartmental modeling and NCA depends largely on the specific research questions, available data quality, and intended application of results [11] [12]. Both approaches offer distinct advantages and limitations, making them suitable for different contexts of use throughout the drug development pipeline. This guide provides a comprehensive comparison of these traditional pharmacokinetic analysis methodologies, their experimental applications, and their positioning within the broader framework of modern pharmacometric approaches.
Theoretical Foundations and Key Concepts
Non-Compartmental Analysis (NCA)
Non-compartmental analysis is a model-independent approach that calculates pharmacokinetic parameters directly from observed concentration-time data without assuming a specific structural model [14] [12]. This method provides a straightforward determination of exposure metrics without requiring prior knowledge of the drug's underlying distribution characteristics [12]. NCA is particularly valuable for its simplicity, reduced potential for model-based bias, and ability to generate actionable parameters quickly [14].
Key NCA Parameters:
- C~max~: The peak concentration observed during a dosing interval, crucial for understanding safety and acute effects [14]
- AUC (Area Under the Curve): A measure of total drug exposure, highly relevant to therapeutic and toxic effects [14]
- T~max~: The time to reach maximum concentration [14]
- Terminal Half-Life: The time required for plasma concentration to decrease by 50% during the terminal phase [14]
Compartmental Analysis
Compartmental modeling divides the body into one or more hypothetical compartments, representing groups of tissues with similar distribution characteristics [12]. Unlike NCA, this approach employs mathematical models to describe the kinetics of drug transfer between compartments and elimination from the body [12]. Compartmental models range from simple one-compartment structures to complex multi-compartment systems that more accurately represent drug distribution patterns [12].
Model Progression:
- One-Compartment Model: Simplifies the body to a single homogeneous unit [12]
- Two-Compartment Model: Distinguishes between central (plasma and highly perfused tissues) and peripheral (poorly perfused tissues) compartments [12]
- Three-Compartment Model: Further separates distribution into plasma, highly perfused tissues, and scarcely perfused tissues [12]
- Population PK (PopPK): Extends compartmental modeling to quantify and explain variability in drug exposure across individuals [15]
Methodological Comparison: NCA vs. Compartmental Analysis
The table below summarizes the fundamental characteristics, advantages, and limitations of each approach.
Table 1: Fundamental Comparison Between NCA and Compartmental Analysis
| Characteristic | Non-Compartmental Analysis (NCA) | Compartmental Analysis |
|---|---|---|
| Theoretical Basis | Model-independent; based on statistical moments [12] | Model-dependent; based on hypothetical compartments [12] |
| Structural Assumptions | No compartmental structure assumed [14] | Assumes specific number and arrangement of compartments [12] |
| Data Requirements | Rich sampling preferable for accurate AUC [14] | Can accommodate sparse data through population approaches [15] |
| Primary Outputs | Direct exposure parameters (AUC, C~max~, half-life) [14] | Model parameters (clearance, volume, rate constants) [12] |
| Key Strengths | Simplicity, speed, reduced model bias [14] | Predictive capability for different scenarios [12] |
| Major Limitations | Limited extrapolation beyond observed data [14] | Model misspecification risk, complexity [12] |
Regulatory Context and Parameter Usage
Regulatory agencies including the FDA and EMA rely heavily on specific NCA parameters for critical decisions. For bioequivalence assessments, food effect evaluations, and drug-drug interaction studies, regulators primarily focus on C~max~ and AUC~last~ values rather than parameters derived from terminal slope estimations [14]. This regulatory preference underscores the importance of well-designed sampling schemes to generate reliable NCA parameters for submission packages.
Experimental Applications and Case Studies
Protocol: NCA in Formulation Development
Objective: Compare pharmacokinetic profiles of novel extended-release (ER) ketorolac tromethamine tablet-in-tablet (TIT) formulation versus conventional immediate-release (IR) tablets [16].
Methodology:
- Study Design: Single-dose, crossover study in beagle dogs (n=18) [16]
- Formulations: Conventional IR tablets (10 mg) vs. novel ER TIT formulation [16]
- Dosing: Oral administration after 12-hour fast [16]
- Blood Sampling: Serial blood collection at predetermined time points [16]
- Bioanalysis: LC-MS/MS quantification of ketorolac plasma concentrations [16]
- NCA Parameters: C~max~, T~max~, AUC~last~, AUC~inf~, half-life [16]
Key Findings: The TIT formulation demonstrated extended-release characteristics with significantly longer T~max~ (5 h vs. 1 h) and lower C~max~ compared to conventional tablets, confirming the feasibility of once-daily dosing [16].
Protocol: Population PK (PopPK) in Clinical Development
Objective: Develop a population pharmacokinetic model for subcutaneous nivolumab to support non-inferiority assessment against intravenous formulation [17].
Methodology:
- Study Design: Phase III trial (CheckMate 67T) in patients with renal cell carcinoma [17]
- Modeling Approach: Population PK using NONMEM with PRIOR subroutine [17]
- Data Integration: Leveraged extensive historical nivolumab PK data across tumor types [17]
- Exposure Metrics: Time-averaged serum concentration over first 28 days (C~avgd28~) and steady-state trough concentration (C~minss~) [17]
- Validation: Clinical trial simulations to assess robustness [17]
Key Findings: Model-based analysis provided more accurate exposure estimates than NCA, demonstrating non-inferiority of subcutaneous administration and supporting regulatory approval [17].
Research Toolkit: Essential Reagents and Materials
Table 2: Essential Research Materials for Traditional PK Studies
| Material/Resource | Function/Application | Example Context |
|---|---|---|
| LC-MS/MS System | Bioanalytical quantification of drug concentrations in biological matrices [16] | Ketorolac plasma concentration measurement [16] |
| NONMEM Software | Non-linear mixed effects modeling for population PK analysis [17] [15] | Subcutaneous nivolumab PPK model development [17] |
| Stable Isotope IS | Internal standard for bioanalytical method accuracy [16] | [²H₅]-Ketorolac as internal standard [16] |
| PK Sampling Scheme | Strategic blood collection timepoints for rich or sparse data [14] | Optimal sampling for reliable AUC estimation [14] |
Integration with Modern Modeling Approaches
Traditional PK analysis methods are increasingly integrated with advanced modeling approaches within the MIDD paradigm [11]. The selection between NCA and compartmental modeling follows a "fit-for-purpose" principle, aligning the methodology with specific research questions and context of use [11].
Strategic Implementation:
- Early Discovery: NCA for rapid screening of formulations or lead compounds [13]
- Preclinical Development: Compartmental modeling for interspecies scaling and first-in-human dose prediction [13]
- Clinical Development: Population PK to quantify variability and identify covariates [15]
- Regulatory Submission: Hybrid approaches incorporating both NCA and model-based analysis [17] [5]
This integrated approach enables more efficient drug development, with traditional methods providing foundational exposure data that informs mechanism-based models including PBPK and quantitative systems pharmacology (QSP) [11] [7].
Visual Guide: Method Selection and Workflow
The following diagram illustrates the decision-making process for selecting between NCA and compartmental analysis, and their positioning within the modern MIDD framework.
Diagram 1: PK Method Selection in Modern Drug Development
Both non-compartmental and compartmental analyses maintain critical positions in contemporary pharmacokinetic research and drug development. NCA provides unbiased exposure assessment essential for regulatory decision-making, while compartmental modeling enables predictive simulations and population-based variability analysis [17] [14]. The strategic integration of these traditional approaches with emerging mechanism-based methodologies represents the future of efficient, scientifically rigorous drug development [11] [5].
Understanding the appropriate context of use for each method allows researchers to construct a comprehensive pharmacokinetic assessment strategy that progresses from traditional exposure assessment to sophisticated predictive modeling, ultimately accelerating the development of safe and effective therapeutics [11] [13].
Pharmacokinetic (PK) modeling is a cornerstone of modern drug development, enabling researchers to understand a drug's behavior in the body. This guide compares traditional compartmental PK modeling with mechanism-based approaches, primarily Physiologically Based Pharmacokinetic (PBPK) and Pharmacokinetic/Pharmacodynamic (PK/PD) modeling. While traditional models offer a simplified, empirical description of drug concentrations, mechanism-based models integrate physiological, biological, and pharmacological details to provide a mechanistic understanding of drug absorption, distribution, metabolism, excretion (ADME), and effect. This comparison explores the fundamental principles, applications, and experimental protocols for each approach, providing researchers with the data needed to select the appropriate tool for their development challenges.
Pharmacokinetic modeling is a mathematical technique used to quantify and predict the fate of pharmaceutical compounds in the body [18]. In drug development, these models are critical for reducing failure rates and increasing the efficiency of bringing new therapies to market. The evolution of PK modeling has progressed from traditional, empirical methods to more sophisticated, mechanism-based frameworks that align with the goals of Model-Informed Drug Development (MIDD).
Traditional compartmental models view the body as a series of interconnected compartments, typically one or two, that do not necessarily correspond to specific anatomical entities. These models are "top-down," starting from observed clinical plasma concentration-time data to estimate parameters like clearance and volume of distribution [19]. Their strength lies in their simplicity and efficiency in characterizing average drug behavior in a population.
In contrast, mechanism-based models, including PBPK and PK/PD models, adopt a "bottom-up" approach. PBPK models represent the body as a network of anatomically meaningful compartments (e.g., liver, kidney, brain) linked by the circulatory system. They incorporate independent prior knowledge of human physiology and the drug's physicochemical properties to achieve a mechanistic representation of ADME processes [20]. PK/PD modeling extends this further by linking the drug concentration at the site of action (predicted by PBPK or other PK models) to the magnitude of the pharmacological effect, creating a multiscale model that describes both drug behavior and its impact on the biological system [20] [7].
The following sections provide a detailed, data-driven comparison of these paradigms, highlighting their respective roles in advancing drug development.
Comparative Analysis: Traditional vs. Mechanism-Based Modeling
The table below summarizes the core characteristics of traditional population PK (PopPK), PBPK, and integrated PBPK/PD models, providing a clear, structured comparison.
Table 1: Fundamental Comparison of Pharmacokinetic Modeling Approaches
| Feature | Traditional PopPK Models | Mechanism-Based PBPK Models | Integrated PBPK/PD Models |
|---|---|---|---|
| Fundamental Approach | Empirical, "top-down"; data-driven [19] | Mechanistic, "bottom-up"; physiology-driven [20] [19] | Multiscale and mechanistic; integrates physiology and pharmacology [20] |
| Structural Basis | Abstract compartments (central, peripheral) without direct physiological correspondence [18] | Anatomically meaningful compartments representing specific organs and tissues [20] | PBPK structure linked to a pharmacodynamic model describing the drug's effect [20] |
| Key Input Parameters | Observed clinical PK data; patient covariates (weight, renal function) [19] | Drug physicochemical properties (lipophilicity, pKa), in vitro data, and physiological parameters (organ volumes, blood flows) [20] | All PBPK inputs, plus PD parameters (e.g., Emax, EC50) derived from in vitro or in vivo effect data [21] |
| Primary Outputs | Population estimates of CL, Vd, and inter-individual variability [8] | Concentration-time profiles in plasma and specific tissues/organs [20] | Concentration-time and effect-time profiles; prediction of efficacy and toxicity [21] |
| Typical Applications | Dose optimization, identifying covariate relationships, study design [22] [8] | Predicting drug-drug interactions (DDI), extrapolation to special populations (pediatric, organ impairment), formulation assessment [20] [23] [5] | Target engagement analysis, dose selection to maximize efficacy/safety, preclinical to clinical translation [20] [21] |
Workflow and Application Comparison
The fundamental difference in approach leads to distinct workflows, as illustrated in the diagrams below.
Traditional Empirical Modeling Workflow illustrates the standard top-down process for building population PK models.
Mechanistic PBPK Modeling Workflow shows the bottom-up process of building a physiologically-based model.
Experimental Protocols and Case Studies
Protocol: Building and Qualifying a PBPK Model
The "middle-out" approach for PBPK model development is commonly used, integrating in vitro and pre-clinical data, then refining with clinical data.
Table 2: Key Research Reagents and Platforms for PBPK/PK/PD Modeling
| Tool / Reagent | Type | Primary Function in Research |
|---|---|---|
| Simcyp Simulator | Software Platform | Population-based PBPK simulator with extensive physiological and enzyme database [23]. |
| GastroPlus | Software Platform | PBPK modeling platform focused on absorption prediction and biopharmaceutics [20]. |
| NONMEM | Software Platform | Industry-standard software for non-linear mixed effects (population) PK/PD modeling [8]. |
| PK-Sim & MoBi | Software Platform | Whole-body PBPK modeling and model integration toolkit [20]. |
| Fraction Unbound (fu) | In Vitro Parameter | Measured fraction of drug unbound to plasma proteins; critical for estimating effective drug concentration [18]. |
| Tissue:Plasma Partition Coefficient (Kp) | In Vitro/Derived Parameter | Predicts the distribution of a drug into specific tissues relative to plasma [20]. |
Detailed Methodology:
- Parameter Collection: Gather the drug's physicochemical properties (molecular weight, lipophilicity expressed as Log P, acid dissociation constant pKa) and in vitro ADME data. This includes permeability, fraction unbound in plasma (fu), and metabolic clearance data from human liver microsomes or recombinant CYP enzymes [20] [23].
- Model Construction: Input these parameters into a PBPK software platform (e.g., Simcyp, GastroPlus). The platform uses built-in physiological databases (organ volumes, blood flow rates) and distribution models (e.g., Poulin and Theil) to estimate tissue-plasma partition coefficients (Kp) and build the initial model structure [20].
- Model Verification & Qualification: Simulate clinical PK studies (e.g., single-dose IV infusion) in a virtual population and compare the simulated concentration-time profiles to observed clinical data. Key metrics like AUC (Area Under the Curve) and Cmax (maximum concentration) are compared, typically aiming for a prediction within a 2-fold error range [23] [18].
- Model Application: Once qualified, the model is used for simulation and extrapolation. This includes predicting DDIs, exploring PK in special populations (e.g., pediatrics, renally impaired), or supporting dose selection for new clinical scenarios [20] [5].
Case Study: PBPK for Pediatric Dose Selection of a Novel Antibiotic
Objective: To predict an effective pediatric dose of gepotidacin for pneumonic plague where clinical trials in children are not feasible [23].
Experimental Protocol:
- Model Development: A gepotidacin PBPK model was constructed in Simcyp using physicochemical and in vitro data. The model was optimized using clinical PK data from a dose-escalation intravenous study in healthy adults [23].
- Model Qualification: The model was verified by simulating other adult clinical studies, including a human mass balance study, and comparing predictions to observed data [23].
- Pediatric Extrapolation: The qualified adult model was scaled to pediatric populations by incorporating age-dependent changes in physiology (organ sizes, blood flows), body composition, and the ontogeny (maturation) of key elimination pathways (CYP3A4 enzyme and renal function) [23].
- Dose Prediction: Simulations were run for various pediatric age and weight brackets. The proposed dosing regimen was weight-based for subjects ≤40 kg. The goal was for ~90% of the predicted pediatric exposure (AUC) to fall between the 5th and 95th percentiles of the effective adult exposure [23].
Supporting Data: The study reported that both PBPK and a traditional PopPK model could reasonably predict gepotidacin exposures in children, though they differed in predictions for children under 3 months old, highlighting PBPK's advantage in accounting for enzyme maturation [23].
Case Study: AI-Enhanced PBPK/PK/PD for Aldosterone Synthase Inhibitors
Objective: To predict the PK/PD properties of aldosterone synthase inhibitors (ASIs) from their structural formulas during early drug discovery to select candidates with high potency and selectivity [21].
Experimental Protocol:
- AI-PBPK Model Workflow: The protocol involved a multi-step workflow as shown in the diagram below.
- Model Calibration and Validation: Baxdrostat, the ASI with the most clinical data, was used as the model compound. The AI-predicted PK parameters were calibrated against its published clinical trial data. External validation was performed using data for other ASIs (Dexfadrostat, Lorundrostat) [21].
- PD Modeling: A pharmacodynamic model was developed based on the simulated free (unbound) plasma concentrations of each drug. An Emax model was used to predict the inhibition rate of the target enzyme (aldosterone synthase) and the off-target enzyme (11β-hydroxylase). The selectivity index (SI) was calculated as the ratio of the IC50 for the off-target to the IC50 for the target [21].
Supporting Data: The study demonstrated that the AI-PBPK model could infer the PK/PD properties of an ASI from its structural formula within a certain error range, providing a reference for early lead compound screening and optimization [21].
Regulatory Perspective and Future Directions
Regulatory agencies like the U.S. Food and Drug Administration (FDA) increasingly recognize the value of mechanism-based models. A landscape analysis of submissions to the FDA's Center for Biologics Evaluation and Research (CBER) from 2018 to 2024 shows a growing trend in the use of PBPK modeling, supporting applications for gene therapies, therapeutic proteins, and other biological products [5]. These submissions often aim to justify and optimize dosing, particularly in special populations like pediatrics, and to provide a mechanistic understanding of a drug's behavior [5].
The future of mechanism-based modeling is being shaped by several key advancements:
- Automation and Machine Learning: AI and automation are being applied to streamline model development. Automated PopPK tools can now identify optimal model structures from vast search spaces in a fraction of the time required for manual development [8]. As demonstrated in the case study, AI is also being integrated with PBPK models to predict ADME parameters directly from molecular structures, accelerating early drug discovery [21].
- Hybrid and Multi-Scale Models: The line between model types is blurring. Research confirms the compatibility between PBPK and traditional compartment models, showing that a PBPK model can be theoretically "lumped" into a simpler compartmental structure with similar predictive power for plasma concentrations [18]. This allows for more flexible, fit-for-purpose model development.
- Expansion into Novel Modalities: PBPK and PK/PD modeling are expanding beyond small molecules to support the development of complex biological products, including therapeutic proteins, monoclonal antibodies, cell and gene therapies, and mRNA therapeutics [5].
In the field of pharmacokinetics (PK), two dominant modeling philosophies compete and complement each other: the data-driven, empirical approach of traditional compartmental modeling and the mechanism-based, biology-driven approach of physiologically-based pharmacokinetic (PBPK) modeling. This guide provides an objective comparison for researchers and drug development professionals.
Philosophical Foundations and Core Applications
Empirical Curve-Fitting: Traditional Compartmental Modeling
This approach conceptualizes the body as a system of abstract mathematical compartments, often without direct physiological correlates. The primary goal is to find a mathematical model that best fits observed plasma concentration-time data. Population PK (PopPK) is a widely used implementation that employs nonlinear mixed-effects (NLME) models to characterize inter- and intra-individual variability in drug exposure [8].
Biology-Driven Simulation: Physiologically-Based Pharmacokinetic (PBPK) Modeling
PBPK modeling is structured on a mechanism-driven paradigm, representing the body as a network of physiological compartments (e.g., liver, kidney) interconnected by blood circulation. It integrates system-specific physiological parameters (e.g., organ weights, blood flow rates) with drug-specific properties (e.g., lipophilicity, protein binding) to quantitatively predict PK profiles [24].
Core Applications in Drug Development: PBPK modeling has gained substantial traction in regulatory submissions. An analysis of FDA-approved new drugs from 2020-2024 shows that 26.5% (65 of 245) of NDAs/BLAs included PBPK models as pivotal evidence [24]. Its applications are diverse, as shown in the table below.
Table: Primary Application Domains of PBPK Models in Regulatory Submissions (2020-2024)
| Application Domain | Proportion of Instances | Specific Use Cases |
|---|---|---|
| Drug-Drug Interactions (DDI) | 81.9% | Enzyme-mediated (e.g., CYP3A4), transporter-mediated (e.g., P-gp), acid-reducing agent effects [24]. |
| Dosing in Organ Impairment | 7.0% | Hepatic impairment (4.3%), renal impairment (2.6%) [24]. |
| Pediatric Dosing | 2.6% | Extrapolation from adult data using known physiological differences [24]. |
| Other (Food-effect, etc.) | 8.5% | Formulation development, bioequivalence studies [24]. |
Experimental Protocols and Methodologies
Protocol for Automated Empirical PopPK Model Development
Modern approaches aim to automate the traditionally labor-intensive process of PopPK model development. The following workflow, enabled by tools like pyDarwin, can identify robust model structures in less than 48 hours on average [8].
Detailed Methodology [8]:
Define Model Search Space: A generic model space containing over 12,000 unique PopPK model structures for extravascular drugs is constructed. This space includes variations in:
- Number of compartments (1, 2, or 3)
- Absorption models (first-order, zero-order, transit compartments)
- Elimination models (linear and non-linear, e.g., Michaelis-Menten)
- Residual error models (e.g., additive, proportional, combined)
Run Optimization Algorithm: A machine learning-driven optimization (e.g., Bayesian optimization with a random forest surrogate) explores the model space. The algorithm efficiently evaluates a small fraction (<2.6%) of all possible models to identify promising candidates.
Model Evaluation and Selection: A custom penalty function is applied to select the final model. This function balances:
- Goodness-of-fit: Using criteria like Akaike Information Criterion (AIC) to prevent over-parameterization.
- Biological Plausibility: Penalizing abnormal parameter values (e.g., unrealistically high clearance or volume of distribution) that would be rejected by a domain expert.
Protocol for Developing and Qualifying a PBPK Model
The development of a biology-driven PBPK model is an iterative process of building, evaluating, and refining a mechanistic hypothesis.
Detailed Methodology [25] [24]:
System Data Collection: Gather human physiological parameters for the target population (e.g., organ volumes, blood flow rates, expression levels of enzymes/transporters). These can be specific to age, disease state, or other covariates.
Drug Data Collection: Obtain drug-specific parameters, ideally from in vitro assays. Key parameters include:
- Physicochemical properties: Lipophilicity (Log P), pKa, solubility.
- Binding data: Plasma protein binding.
- Metabolism/Transport: Kinetic parameters (e.g., V~max~, K~m~) from human liver microsomes or transfected cell lines for relevant enzymes and transporters.
Model Building & Implementation: Integrate system and drug data into a mathematical model structure, typically a system of ordinary differential equations (ODEs). The model can be implemented as a stand-alone application for a specific drug or using a flexible template or superstructure that can be configured for multiple chemicals [26].
Model Verification and Validation (V&V):
- Verification: Ensure the computer code correctly implements the intended mathematical model (quality assurance).
- Validation: Compare model simulations against observed clinical PK data not used for model building (e.g., from drug-drug interaction studies or special populations). This step is critical for establishing model credibility.
Model Application: The qualified model is used to simulate and predict drug exposure in untested clinical scenarios, such as complex DDIs, pediatric populations, or patients with organ impairment, to inform dosing recommendations and clinical trial design.
Performance Comparison: Quantitative Data
Predictive Accuracy and Regulatory Impact
Table: Comparison of Modeling Approaches Based on Published Data
| Performance Metric | Empirical PopPK / Curve-Fitting | Biology-Driven PBPK |
|---|---|---|
| Regulatory Acceptance (2020-2024) | Standard for exposure-response and dose justification. | Used in 26.5% of new drug approvals; dominant in DDI assessment (81.9% of PBPK applications) [24]. |
| Therapeutic Area Focus | Universal, applied across all disease areas. | Highest use in Oncology (42%), followed by Rare Diseases (12%) and CNS (11%) [24]. |
| Key Strength | Optimizes description of observed data; robust for interpolation within studied population. | Strong extrapolation capability to untested populations and conditions (e.g., pediatrics, organ impairment) [24]. |
| Primary Limitation | Limited extrapolation power; parameters lack direct physiological meaning [24]. | Relies on accurate in vitro to in vivo translation; model complexity can be high [25]. |
Computational Efficiency and Implementation
Computational performance is a key practical consideration, especially for large-scale simulations like Monte Carlo analyses.
Table: Computational and Implementation Factors
| Factor | Empirical PopPK | Biology-Driven PBPK |
|---|---|---|
| Model Development Time | Automated search can find robust structures in <48 hours [8]. | Development is typically longer, requiring extensive data collection and model qualification. |
| Simulation Speed | Generally fast, due to simpler model structures with fewer compartments. | Can be slower; a 30% computational time saving was achieved by fixing body weight parameters instead of treating them as time-varying [26]. |
| Software & Platforms | NONMEM, Monolix, nlmixr2, Pharmpy, pyDarwin [27] [8]. |
Simcyp (industry leader, ~80% usage), GastroPlus, Open Systems Pharmacology (OSP) suite [24] [28]. |
| Automation Potential | High (e.g., pyDarwin automates model structure search) [8]. |
Moderate. Template-based approaches (e.g., EPA's PBPK template) reduce implementation time and QA review burden [26]. |
The Scientist's Toolkit: Essential Research Reagents and Solutions
Table: Key Tools and Platforms for PK Modeling
| Tool/Reagent | Function/Benefit | Example Use Case |
|---|---|---|
| pyDarwin | An automated tool that uses optimization algorithms to efficiently search the PopPK model space [8]. | Automates the identification of the structural PopPK model from clinical data, reducing manual effort and improving reproducibility [8]. |
| PBPK Model Template | A pre-verified model "superstructure" containing common equations found in PBPK models [26]. | Accelerates the implementation of chemical-specific PBPK models and streamlines the quality assurance (QA) review process [26]. |
| Simcyp Simulator | The industry-leading platform for PBPK modeling and simulation [24]. | Used extensively for predicting drug-drug interactions and pharmacokinetics in virtual patient populations [24]. |
| R / nlmixr2 Package | An open-source environment for population PK/PD modeling and analysis [27]. | Used in a pipeline to compute initial parameter estimates for PopPK models, handling both rich and sparse data scenarios [27]. |
| Open Systems Pharmacology (OSP) | An open-source software suite that supports PBPK and quantitative systems pharmacology modeling [28]. | Used to develop a physiologically based biopharmaceutics model (PBBM) for vericiguat, integrating dissolution and solubility data [28]. |
Integrated Applications and Future Directions
The distinction between empirical and mechanistic modeling is blurring with the emergence of hybrid approaches and artificial intelligence (AI).
Synergistic Applications:
- Model-Informed Drug Development (MIDD): Both PopPK and PBPK are pivotal MIDD tools. A "fit-for-purpose" strategy selects the appropriate tool based on the key question, context of use, and available data at different drug development stages [11].
- AI/ML Integration: Machine learning is being applied to both paradigms. For PopPK, it automates model development [8]. For PBPK, ML aids in parameter estimation, uncertainty quantification, and simplifying complex models, helping to address the "large parameter space" challenge [25] [29].
Future Outlook: The integration of PBPK modeling with AI and multi-omics data is poised to enhance predictive accuracy further [24]. The market growth of biosimulation, projected to reach $9.65 billion by 2029, underscores the increasing reliance on these in silico technologies to improve the efficiency and success rate of drug development [30].
In the field of pharmacokinetics (PK) and pharmacodynamics (PD), the traditional parameters of Area Under the Curve (AUC) and Maximum Concentration (Cmax) have long been foundational for assessing drug exposure in plasma. However, growing evidence underscores that these plasma-based metrics often fail to accurately predict clinical efficacy and toxicity, as they may not reflect drug concentrations at the site of action or account for complex pharmacological mechanisms [31]. This guide objectively compares the traditional reliance on AUC/Cmax with the more nuanced approaches of tissue distribution and receptor occupancy, framing the discussion within the broader thesis of traditional versus mechanism-based PK/PD modeling research. The integration of tissue exposure and target engagement parameters is critical, as slight structural modifications can significantly alter a drug's tissue selectivity and clinical profile without substantially changing its plasma PK [31].
Comparative Analysis of Key Parameters
The following tables summarize the core characteristics, experimental methodologies, and functional outputs of the discussed pharmacokinetic and pharmacodynamic parameters.
Table 1: Core Parameter Comparison
| Parameter | Definition | Primary Source Matrix | Key Strengths | Principal Limitations |
|---|---|---|---|---|
| AUC | The total drug exposure over time | Plasma/Serum | Standardized, high-throughput assays; Well-established regulatory acceptance [31] | Poor correlation with target tissue exposure; Relies on free drug hypothesis [31] |
| Cmax | The peak drug concentration after administration | Plasma/Serum | Simple to determine; Useful for assessing acute toxicity risk [31] | Single time-point metric; Does not inform on exposure duration |
| Tissue Distribution | Drug concentration in specific organs or tissues | Tissue Homogenate (e.g., tumor, liver, brain) | Directly measures exposure at the disease site; Can explain efficacy/toxicity discrepancies [31] | Invasive sampling; Complex, low-throughput methodologies [31] |
| Receptor Occupancy | The proportion of target receptors bound by a drug | Target Tissue (often inferred) | Directly measures target engagement; Links PK to pharmacological effect [32] | Technically challenging to measure in vivo; Requires specialized tools (e.g., PET ligands) [32] |
Table 2: Experimental and Output Comparison
| Parameter | Primary Experimental Methods | Key Output Metrics | Role in Model-Informed Drug Development (MIDD) |
|---|---|---|---|
| AUC | Serial blood sampling followed by LC-MS/MS bioanalysis [31] | AUC0-t, AUC0-∞ | Input for traditional non-compartmental analysis (NCA) and PopPK models [23] |
| Cmax | Serial blood sampling followed by LC-MS/MS bioanalysis [31] | Cmax, Tmax | Used in dose selection and for setting safe starting doses in clinical trials |
| Tissue Distribution | Terminal tissue sampling, homogenization, and LC-MS/MS analysis [31] | Tissue-to-Plasma Ratio; Tissue Specific Selectivity Index [31] | Critical for verifying and refining PBPK models; Informs human tissue exposure predictions [31] [23] |
| Receptor Occupancy | Radioligand binding assays; Positron Emission Tomography (PET); Indirect Response PD Models [32] | % RO vs. Time; IC50 or Kd for binding | Central to mechanism-based PK/PD models; Enables prediction of clinical efficacy from in vitro potency [32] |
Experimental Protocols for Key Measurements
Protocol for Tissue Distribution Studies
A definitive tissue distribution study involves quantifying drug concentrations in various organs relative to plasma [31].
- Animal Model: Use relevant disease models (e.g., transgenic MMTV-PyMT mice for breast cancer studies) [31].
- Dosing and Sampling: Administer the drug (e.g., 5 mg/kg orally) and euthanize animals at predetermined time points (e.g., 0.08, 0.5, 1, 2, 4, 7 h). Collect blood (for plasma) and all tissues of interest (e.g., tumor, fat pad, bone, uterus, liver) [31].
- Sample Processing: Weigh and homogenize tissue samples. Precipitate proteins from plasma and tissue homogenates using ice-cold acetonitrile with an internal standard. Vortex and centrifuge the samples to obtain a clean supernatant [31].
- Bioanalysis: Analyze the supernatant using Liquid Chromatography with tandem Mass Spectrometry (LC-MS/MS) to determine the drug concentration in each matrix. Calculate tissue-to-plasma ratios and tissue selectivity indices [31].
Protocol for Assessing Receptor Occupancy via Indirect Response Models
Receptor occupancy can be inferred through integrated PK/PD modeling when direct measurement is infeasible [32].
- Pharmacokinetic Data: First, establish the plasma concentration-time profile (AUC, Cmax) of the drug in the test system.
- Pharmacodynamic Response: Measure a relevant, reversible pharmacological response that is directly mediated by the target receptor (e.g., prolactin release as a response to D2 receptor antagonism) [32].
- Model Fitting: Apply an indirect response model, where the drug inhibits or stimulates the production or loss of the PD marker. The model structure is defined by a set of differential equations (see Section 4.2).
- Parameter Estimation: Use software (e.g., NONMEM, Phoenix) to fit the model to the data, estimating the IC50 (concentration producing 50% of the maximum inhibitory effect). The estimated IC50 is a direct reflection of in vivo receptor affinity and occupancy [32].
Modeling Approaches: From Traditional to Mechanism-Based
Traditional Compartmental PK Modeling
Traditional models describe the body as a system of compartments, focusing solely on the time course of drug in plasma.
Traditional PK Model Workflow
Mechanism-Based PK/PD Modeling with Tissue Distribution and Receptor Occupancy
Mechanism-based models integrate drug-specific (e.g., tissue distribution, receptor binding) and system-specific (e.g., disease progression) parameters to predict the effect-time course.
Mechanism-Based PK/PD Integration
The Scientist's Toolkit: Essential Research Reagents and Materials
Table 3: Key Research Reagent Solutions
| Reagent / Material | Primary Function | Specific Application Example |
|---|---|---|
| Liquid Chromatography with tandem Mass Spectrometry (LC-MS/MS) | Highly sensitive and specific quantification of drug concentrations in complex biological matrices [31] | Measuring AUC from plasma and drug levels in tissue homogenates (e.g., tumor, bone) [31] |
| Stable Isotope-Labeled Internal Standards | Normalizes extraction efficiency and mitigates matrix effects during LC-MS/MS analysis [31] | Added to plasma and tissue homogenates during sample preparation for reliable bioanalysis [31] |
| Transgenic Animal Models | Provides a physiologically relevant in vivo system that mimics human disease for tissue distribution studies [31] | MMTV-PyMT mouse model for spontaneous breast cancer to study tumor penetration of SERMs [31] |
| PBPK Modeling Software (e.g., Simcyp) | Mechanistic platform that integrates in vitro and physiological data to predict PK in virtual human populations [23] | Predicting paediatric gepotidacin exposure and dose by incorporating age-dependent physiology [23] |
| Mechanism-Based PD Models | Mathematical frameworks (e.g., indirect response, signal transduction) that link drug exposure to pharmacological effect [32] | Modeling the time course of anticoagulant effect based on the inhibition of clotting factor synthesis [32] |
The comparative analysis demonstrates that while traditional parameters like AUC and Cmax provide a essential foundation for understanding systemic exposure, they are insufficient alone for predicting clinical outcomes. The integration of tissue distribution data provides a critical link to understanding efficacy and toxicity at the target site, while receptor occupancy closes the loop by quantifying target engagement. The future of optimized drug development lies in the rigorous application of mechanism-based models that synthesize these multi-faceted parameters, moving beyond the limitations of traditional plasma-centric pharmacokinetics to a more holistic, predictive, and physiologically realistic framework.
Model in Action: Methodologies and Real-World Applications in Drug Development
In the field of pharmacokinetics (PK), the process of building a model revolves around two core, interdependent tasks: structural identification and parameter estimation. Structural identification involves determining the mathematical representation that best describes the drug's journey through the body—such as a one- or two-compartment model. Parameter estimation is the subsequent process of quantifying the rate constants, volumes of distribution, and clearances that define the chosen structure [3]. This guide focuses on characterizing traditional modeling approaches, primarily compartmental models and population pharmacokinetics (PopPK), and objectively compares them with emerging mechanism-based and machine-learning-driven methodologies.
Traditional pharmacometric models, often implemented via non-linear mixed-effects (NLME) modeling in software like NONMEM, are the established standard for informing dosing strategies and regulatory submissions [33] [8]. In contrast, mechanism-based models, such as Physiologically-Based Pharmacokinetic (PBPK) models, incorporate granular physiological details, while nascent machine learning (ML) approaches seek to automate and augment the model-building process [34] [35]. Understanding the capabilities and limitations of each approach is crucial for selecting the right tool in drug development.
Core Concepts and Methodologies
The Traditional Modeling Workflow: PopPK and Compartmental Models
The conventional process for building a PopPK model is often manual and iterative. It typically begins with a simple structural model (e.g., a one-compartment model), which is then progressively complexified—by adding compartments or alternative absorption models—until it adequately describes the observed data [33] [8].
- Structural Model Development: The structural model describes the typical concentration-time course within a population. Mammillary compartment models are predominant, where the number of compartments (one, two, or three) often corresponds to the number of distinct exponential phases observed in the log concentration-time curve. These models can be parameterized using derived rate constants or, preferentially, as volumes and clearances, which are more easily interpreted biologically [3].
- Statistical and Covariate Models: The statistical model accounts for "unexplainable" random variability, including between-subject, between-occasion, and residual variability. Covariate models explain variability by linking subject characteristics (e.g., weight, renal function) to model parameters [3].
- Parameter Estimation and Model Comparison: Parameter estimation is typically performed using maximum likelihood methods. The objective function value (OFV) is a key output used for model comparison. For nested models, the likelihood ratio test can be used, while for non-nested models, information criteria like the Akaike Information Criterion (AIC) or Bayesian Information Criterion (BIC) are employed, with lower values indicating a better fit while penalizing for model complexity [3].
Emerging Automated and Machine Learning Approaches
A modern alternative to the manual workflow is automated PopPK model development. One approach uses the pyDarwin library to search a vast pre-defined space of model structures. This method employs a penalty function that balances goodness-of-fit with model plausibility, using global optimization algorithms to efficiently identify suitable structures with minimal user configuration [33] [8].
Another innovative framework is the hierarchical ML approach, which operates in two steps: first, QSAR models predict PK parameters from chemical structures; second, another ML model uses these predicted parameters to forecast the full human PK profile [34].
Performance Comparison: Traditional vs. Emerging Methods
The table below summarizes a quantitative comparison of traditional and automated PopPK modeling approaches based on published studies.
Table 1: Performance Comparison of Traditional vs. Automated PopPK Modeling
| Aspect | Traditional PopPK Modeling | Automated PopPK Modeling (pyDarwin) |
|---|---|---|
| Development Time | Manual, time-consuming; timelines depend on modeler expertise and data complexity [33]. | Average of <48 hours per model in a 40-CPU environment [33] [8]. |
| Model Search Strategy | Sequential, "greedy" local search; prone to finding local minima [33] [8]. | Global search (e.g., Bayesian Optimization); evaluates <2.6% of model space to find near-optimal solution [33] [8]. |
| Key Performance Metric | Relies on OFV, AIC, BIC, and biological plausibility assessed by an expert [3]. | Uses a custom penalty function combining AIC and plausibility checks on parameter values [33] [8]. |
| Reproducibility | Subject to variation based on individual modeler's decisions and preferences [33]. | High; the automated process explicitly encodes selection criteria, standardizing results [33] [8]. |
| Primary Advantage | Mechanistic interpretability; deep expert oversight. | Speed, exhaustive search, and reduced manual effort. |
The performance of traditional QSAR models in predicting physicochemical and PK parameters is well-established. For instance, a recent study demonstrated that consensus QSAR models could predict human clearance (CL) and volume of distribution at steady state (VDss) within a 2-fold error for 62-64% of test compounds [34]. When these parameters were used in a hybrid ML-PBPK framework, the prediction accuracy for human AUC and Cmax was within a 2-fold error for 40-60% of compounds and within a 5-fold error for 80-90% of compounds [34].
Table 2: Predictive Performance of QSAR Models for Key PK Parameters
| PK Parameter | Best Model Algorithm | Geometric Mean Fold Error (GMFE) | % Compounds within 2-fold Error |
|---|---|---|---|
| Fraction Unbound (Fu) | SVM with Merged Descriptors [34] | 2.01 [34] | 60% [34] |
| Clearance (CL) | Consensus Model [34] | 2.00 [34] | 64% [34] |
| Volume of Distribution (VDss) | Consensus Model [34] | 1.88 [34] | 62% [34] |
Beyond model building, the choice of modeling framework significantly impacts outcomes in applied fields like pharmacoeconomics. A 2025 comparative analysis of sunitinib therapy in gastrointestinal stromal tumors (GIST) found that a pharmacometric-based model more accurately captured real-world toxicity trends and changes in drug exposure over time compared to traditional time-to-event and Markov models used in cost-utility analyses [36]. The traditional models excessively forecasted the percentage of patients with subtherapeutic concentrations (98.7% at cycle 16 vs. 34.1% predicted by the pharmacometric model) [36].
Experimental Protocols and Workflows
Protocol for Traditional PopPK Model Building
The following workflow, used by expert modelers, was detailed in a 2025 study on automation and served as the benchmark for comparison [33] [8].
- Base Model Development: Begin with a one-compartment model with first-order absorption and elimination. Estimate population parameters (fixed effects), inter-individual variability (random effects), and residual error.
- Model Progression: Sequentially test a two-compartment model, then different absorption models (e.g., zero-order, sequential zero-first-order, transit compartments).
- Covariate Model Building: Incorporate patient demographics (e.g., body weight, age, organ function) and other covariates into the model. Use stepwise forward addition and backward elimination based on statistical significance (e.g., change in OFV).
- Model Evaluation: Assess the final model using diagnostic plots, visual predictive checks, and bootstrap analysis to ensure robustness and predictive performance.
Protocol for a Hybrid ML-PBPK Analysis
A 2025 study provided a detailed protocol for a hybrid machine learning and PBPK analysis, which can be used for early human PK prediction [34].
- Data Curation and Digitization: Compile a large dataset of small molecules' physicochemical and PK properties from public sources like ChEMBL and PubChem. Digitize human plasma concentration-time profiles from literature to create a comprehensive training set.
- QSAR Model Training: For each parameter (e.g., Fu, CL, VDss, pKa), train multiple QSAR models using different ML algorithms (e.g., SVM, XGBoost) and molecular descriptors. Develop a consensus model by averaging predictions from the top-performing individual models.
- PBPK Simulation: Use the ML-predicted drug-specific parameters as inputs for a PBPK software platform. Use system-specific parameters representing human physiology.
- Validation: Compare the PBPK-simulated plasma concentration-time profiles against actual clinical data for a test set of compounds withheld from model training. Report accuracy as the percentage of predictions within 2-fold and 5-fold error ranges for AUC and Cmax.
The following diagram illustrates the logical workflow and key decision points in the traditional PopPK model-building process.
The Scientist's Toolkit: Essential Research Reagents and Software
The following table lists key software tools and computational resources used in the featured experiments and the broader field of pharmacokinetic modeling.
Table 3: Key Research Tools for Pharmacokinetic Modeling
| Tool / Reagent | Function / Application | Context / Study |
|---|---|---|
| NONMEM | Industry-standard software for non-linear mixed-effects (NLME) modeling, used for PopPK model development and parameter estimation. | Used as the core estimation engine in both traditional and automated PopPK studies [33] [8]. |
| pyDarwin | A Python library containing optimization algorithms for automating the search of PopPK model structures. | Employed for global search of model space using Bayesian optimization with a random forest surrogate [33] [8]. |
| PBPK Software | Software platforms (e.g., GI-Sim, Simcyp, PK-Sim) that simulate ADME processes using physiological and drug-specific parameters. | Used in hybrid ML-PBPK frameworks to generate human PK profiles from ML-predicted parameters [34]. |
| ChEMBL / PubChem | Public databases providing extensive data on drug properties, activities, and chemical structures for training QSAR models. | Used as data sources for curating large datasets of physicochemical and PK properties [34]. |
| Tofts Model | A specific, widely-used pharmacokinetic model for analyzing Dynamic Contrast-Enhanced MRI (DCE-MRI) data to estimate tissue permeability (Ktrans) and extravascular volume (ve). | Implemented in specialized software like DCE@urLAB for preclinical image analysis [37]. |
| SVM / XGBoost | Machine learning algorithms used to develop quantitative structure-activity relationship (QSAR) models for predicting PC/PK parameters from chemical structures. | Among the top-performing algorithms for predicting parameters like Fu, CL, and VDss [34]. |
The comparative analysis reveals that traditional pharmacokinetic modeling, centered on NLME PopPK, remains a robust, interpretable, and regulatory-accepted methodology. Its strengths lie in mechanistic plausibility and deep expert oversight. However, emerging approaches present compelling advantages. Machine Learning and Automation significantly accelerate model development, improve reproducibility, and can achieve predictive accuracy comparable to traditional methods, especially in early-stage discovery for predicting human PK parameters [34] [33] [8]. Furthermore, mechanism-based models like PBPK and detailed pharmacometric models offer superior biological fidelity, more accurately capturing real-world dynamics such as time-varying toxicity and drug exposure, which translates into better predictions for pharmacoeconomic and clinical outcomes [36].
The future of pharmacokinetic modeling does not lie in the outright replacement of one approach by another, but in their strategic integration. Hybrid frameworks that leverage the speed and pattern-recognition capabilities of ML for parameter prediction, the physiological grounding of PBPK, and the rigorous statistical framework of traditional PopPK will likely define the next generation of tools, enabling more efficient and informative drug development.
Physiologically-based pharmacokinetic (PBPK) modeling represents a fundamental shift from traditional compartmental pharmacokinetic approaches, integrating detailed physiological, biochemical, and anatomical data to predict drug behavior throughout the body. Unlike classical "top-down" pharmacokinetic methods that lack physiological specificity, PBPK modeling adopts a mechanistic "bottom-up" approach that incorporates species- and population-specific parameters to simulate drug concentrations in various tissues and organs [38]. This comparative analysis examines the construction, applications, and advantages of PBPK modeling against traditional pharmacokinetic methods, highlighting how the integration of physiological realism enhances predictive accuracy in drug development.
Conceptual Foundations: Traditional PK vs. PBPK Modeling
Traditional Compartmental Pharmacokinetic Modeling
Traditional pharmacokinetic (PK) modeling employs a "top-down" approach that reduces complex physiological systems into abstract mathematical compartments. These models typically characterize drug absorption, distribution, metabolism, and excretion (ADME) using central and peripheral compartments without direct correspondence to anatomical structures [38]. Parameters such as C~max~ (maximum plasma concentration), T~max~ (time to reach C~max~), AUC (area under the concentration-time curve), and half-life are derived from plasma concentration data without mechanistic physiological basis [38]. While useful for describing observed data, these models have limited predictive capability for extrapolating to different populations, disease states, or dosing regimens due to their empirical nature and lack of physiological specificity.
PBPK Modeling: A Mechanistic Framework
PBPK modeling represents a paradigm shift toward mechanism-based prediction, constructing mathematical representations of the human body as interconnected physiological compartments corresponding to specific organs and tissues [39]. Each compartment is characterized by its anatomical and physiological properties, including tissue volume, blood flow rate, and tissue composition [38] [39]. The model integrates these system parameters with drug-specific physicochemical properties and biochemical processes to simulate concentration-time profiles in blood and individual tissues [38]. This mechanistic framework allows PBPK models to extrapolate predictions across populations, disease states, and dosing scenarios with greater scientific rigor than traditional approaches.
Table 1: Fundamental Differences Between Traditional PK and PBPK Modeling Approaches
| Characteristic | Traditional PK Modeling | PBPK Modeling |
|---|---|---|
| Fundamental Approach | Top-down, empirical | Bottom-up, mechanistic |
| Model Structure | Abstract compartments (central, peripheral) | Physiological compartments (organs, tissues) |
| Parameter Basis | Statistical fitting to plasma data | Physiological constants and drug properties |
| Tissue Concentration Predictions | Limited to plasma/blood | Multiple specific tissues and organs |
| Extrapolation Capability | Limited to similar conditions | Robust across populations, diseases, ages |
| Regulatory Acceptance | Established for PK parameter estimation | Growing acceptance for specific applications [38] |
PBPK Model Construction: Methodology and Workflow
Structural Design and Compartmentalization
The construction of a PBPK model begins with defining an appropriate anatomical structure comprising compartments representing key organs and tissues involved in drug disposition. A full PBPK model typically includes compartments for the liver, kidneys, gut, brain, lungs, heart, adipose tissue, muscle, and blood (both arterial and venous) [39] [40]. The specific compartments included depend on the drug's properties and the model's purpose, with tissues sharing similar characteristics sometimes "lumped" together to reduce complexity [39]. Each compartment is characterized by organ-specific volumes, blood flow rates, and composition data obtained from physiological literature [38].
The tissue model specification determines whether distribution is flow-limited (perfusion rate-limited) or membrane-limited (permeability rate-limited) [39]. Flow-limited models assume instantaneous equilibrium between blood and tissue, while membrane-limited models incorporate diffusion barriers using multiple subcompartments [39]. This distinction critically influences the mathematical equations governing drug transport and the parameterization requirements for accurate prediction.
Figure 1: PBPK Model Development Workflow
Mathematical Framework and Parameterization
PBPK models are constructed using mass balance differential equations that describe the rate of change of drug amount in each compartment [39] [40]. For a typical organ compartment, the general form of the distribution equation is:
dM~i~/dt = Q~i~ × (C~a~ - C~v~,~i~)
Where:
- dM~i~/dt = rate of change of drug amount in tissue i
- Q~i~ = blood flow to tissue i
- C~a~ = arterial drug concentration
- C~v~,~i~ = venous drug concentration leaving tissue i [40]
The model requires three categories of parameters:
- System-specific parameters: Species- and population-specific physiological values including organ volumes, blood flow rates, tissue composition, and protein levels [38]
- Drug-specific parameters: Physicochemical properties such as molecular weight, lipophilicity (logP/logD), pKa, solubility, and permeability [38]
- Drug-biological interaction parameters: Including fraction unbound in plasma (f~u~), tissue-plasma partition coefficients (K~p~), and metabolic clearance values [38]
These parameters are obtained from in vitro experiments, predictive algorithms, and literature sources, with refinement through in vitro-in vivo extrapolation (IVIVE) approaches [38] [41].
Figure 2: Anatomical Structure of a Full PBPK Model
Model Calibration, Validation, and Software Tools
PBPK model development follows a rigorous process involving calibration with available in vivo data and validation using independent datasets [38]. The "middle-out" approach, which integrates both "bottom-up" mechanism-based predictions and "top-down" parameter estimation from observed data, is frequently employed to address scientific knowledge gaps [38]. Model validation confirms predictive performance before application to simulation scenarios.
Specialized software platforms facilitate PBPK model construction and application:
Table 2: Comparative Analysis of PBPK Modeling Platforms
| Software | Developer | Key Features | Typical Applications | Access Type |
|---|---|---|---|---|
| Simcyp Simulator | Certara | Extensive physiological libraries, virtual population modeling, DDI prediction | Human PK prediction, DDI assessment, pediatric/special population modeling | Commercial [38] |
| GastroPlus | Simulation Plus | Oral absorption modeling, dissolution, physiology-based biopharmaceutics | Formulation optimization, bioavailability prediction | Commercial [38] |
| PK-Sim | Open Systems Pharmacology | Whole-body PBPK modeling, open-source capabilities | Cross-species extrapolation, academic research | Open Source [38] |
Experimental Validation: Comparative Case Study in GIST Therapy
Experimental Design and Methodology
A comprehensive comparative analysis evaluated the performance of PBPK modeling against traditional pharmacoeconomic models in predicting outcomes of sunitinib therapy for gastrointestinal stromal tumors (GIST) [36]. The study simulated a two-arm trial comparing sunitinib 37.5 mg daily versus no treatment using a pharmacometric-based PBPK framework to generate "true" clinical outcomes for 1000 virtual patients with metastatic/unresectable GIST [36]. Simulations ran over 104 weeks, incorporating realistic clinical practices including dose reductions based on adverse events.
The PBPK model framework incorporated multiple interconnected components:
- Time course models for adverse events (hypertension, neutropenia, hand-foot syndrome, fatigue, thrombocytopenia)
- Soluble Vascular Endothelial Growth Factor Receptor-3 (sVEGFR-3) concentration kinetics
- Tumor growth dynamics
- Overall survival (Weibull time-to-event model) [36]
Traditional modeling approaches included time-to-event (exponential and Weibull) and Markov (discrete and continuous) models with logistic regression for adverse events [36]. All models were compared against the PBPK-generated "truth" for accuracy in predicting clinical outcomes and cost-utility ratios.
Comparative Performance Results
The PBPK framework demonstrated superior performance in capturing dynamic toxicity patterns and drug exposure changes compared to traditional models:
Table 3: Comparative Performance of Modeling Approaches in Sunitinib GIST Therapy
| Model Framework | Cost-Utility Prediction | Deviation from PBPK Result | Toxicity Pattern Accuracy | Drug Exposure Prediction |
|---|---|---|---|---|
| PBPK (Reference) | 142,756 €/QALY | Baseline | Captured dynamic changes (e.g., HFS incidence peak at cycle 4) | Accurate (13.7% to 34.1% subtherapeutic) |
| Discrete Markov | 112,483 €/QALY | -21.2% | Stable incidence over all cycles | Overestimated (24.6% to 98.7% subtherapeutic) |
| Continuous Markov | 121,215 €/QALY | -15.1% | Stable incidence over all cycles | Overestimated (24.6% to 98.7% subtherapeutic) |
| TTE Weibull | 152,980 €/QALY | +7.2% | Stable incidence over all cycles | Overestimated (24.6% to 98.7% subtherapeutic) |
| TTE Exponential | 199,282 €/QALY | +39.6% | Stable incidence over all cycles | Overestimated (24.6% to 98.7% subtherapeutic) |
The PBPK model accurately represented the increase in hand-foot syndrome incidence until cycle 4 followed by a decrease, while traditional models showed stable incidence across all treatment cycles [36]. Additionally, traditional models excessively forecasted the percentage of patients experiencing subtherapeutic sunitinib concentrations over time compared to the PBPK framework [36].
Successful PBPK model construction requires specialized tools and resources across multiple domains:
Table 4: Essential Research Reagents and Resources for PBPK Modeling
| Category | Specific Tools/Reagents | Function in PBPK Modeling |
|---|---|---|
| Software Platforms | Simcyp, GastroPlus, PK-Sim, NONMEM, Phoenix WinNonlin | Model construction, simulation, parameter estimation, and data analysis [38] |
| Physiological Databases | ICRP publications, Brown et al. species-specific data | Source of physiological parameters (organ volumes, blood flows, tissue composition) [39] |
| In Vitro Assay Systems | Caco-2 permeability assays, metabolic stability assays, plasma protein binding assays | Generation of drug-specific parameters for model input [38] |
| Predictive Algorithms | Poulin & Theil, Rodgers & Rowland, Schmitt methods | Estimation of tissue:plasma partition coefficients from physicochemical properties [39] |
| Organ-on-a-Chip Platforms | Liver, intestine, kidney, multi-organ chips | Validation of model predictions using engineered human tissues [42] |
PBPK modeling represents a transformative approach that integrates physiology, biochemistry, and anatomy to overcome limitations of traditional pharmacokinetic methods. The mechanistic foundation of PBPK models provides superior predictive capability for drug behavior across diverse populations and conditions, as demonstrated in the sunitinib case study where the PBPK framework more accurately captured toxicity dynamics and drug exposure patterns [36]. While requiring more extensive parameterization and specialized expertise, PBPK modeling offers enhanced scientific rigor for drug development decisions, particularly for special populations, drug-drug interactions, and formulation optimization [38]. As these modeling approaches continue to evolve through integration with emerging technologies like organ-on-a-chip platforms and machine learning, they promise to further transform pharmacokinetic prediction and personalized therapy optimization [42].
Pharmacokinetic/Pharmacodynamic (PK/PD) modeling represents a critical discipline in clinical pharmacology that quantitatively integrates pharmacokinetics (what the body does to a drug) with pharmacological systems and pathophysiological processes to understand the intensity and time-course of drug effects on the body [43]. These mathematical models characterize the temporal aspects of drug effects by emulating mechanisms of action, allowing for the quantification and prediction of drug-system interactions for both therapeutic and adverse drug responses [43]. The field has evolved significantly from traditional empirical approaches toward more sophisticated mechanism-based models that offer greater predictive power and biological relevance.
The fundamental goal of PK/PD modeling is to integrate known system components, functions, and constraints to generate and test competing hypotheses of drug mechanisms and system responses under new conditions [43]. While traditional phenomenological models operate as "black boxes" simply linking an input to an output, mechanism-based models seek to incorporate understanding of the underlying biological processes, providing not just predictive capability but also biological explanations for observed phenomena [44]. This evolution from descriptive to predictive modeling has profound implications for drug development, particularly in optimizing dosing regimens and balancing efficacy with toxicity.
Traditional vs. Mechanism-Based Modeling Approaches: A Comparative Analysis
Fundamental Philosophical Differences
Traditional PK/PD modeling typically employs empirical approaches that describe observed data without attempting to incorporate underlying biological mechanisms. These models are often praised for their simplicity and practicality in real-world settings [44]. As noted in research on hematological toxicities, "phenomenological models have demonstrated their utility in real-world settings, not despite the fact that they are black boxes, but precisely because they are black boxes" [44]. The classic Friberg model for myelosuppression, for instance, uses a simplified compartmental description of hematopoiesis that has been extensively applied for describing myelosuppressive effects of various cytotoxics [44].
In contrast, mechanism-based models embrace biological complexity, seeking to represent the actual physiological processes underlying drug effects. These models incorporate known pathophysiology and drug mechanisms, offering the potential for better extrapolation and understanding of drug effects across different conditions [43]. As one publication notes, "mechanistic models can help understand the underlying cellular or molecular mechanisms," whereas "phenomenological models are merely descriptive" [44].
Comparative Performance Across Applications
Table 1: Comparison of Traditional vs. Mechanism-Based Modeling Approaches
| Feature | Traditional Models | Mechanism-Based Models |
|---|---|---|
| Biological Basis | Empirical, descriptive | Incorporates physiological mechanisms |
| Model Complexity | Simple, parsimonious | Complex, multi-parameter |
| Predictive Capability | Limited extrapolation | Better extrapolation potential |
| Parameter Identifiability | Good with sparse data | Challenging with sparse data |
| Clinical Translation | Easier implementation | Difficult implementation |
| Biological Insights | Limited | Substantial |
| Development Time | Shorter | Longer |
| Data Requirements | Moderate | Extensive |
Practical Implementation Challenges
The transition from traditional to mechanism-based modeling presents significant practical challenges. Mechanism-based Quantitative Systems Pharmacology (QSP) models are "frequently based on dozens of parameters, a large number of them being fixed from literature data," making them "dependent on the variability and/or possible biases of the experiments used for their very identification" [44]. Furthermore, the "practical identifiability from sparse individual data collected at bedside is expected to be poor, resulting in uncertainty in quantitative model predictions in real-world practice" [44].
This fundamental tension is acknowledged across the literature: "For an efficient in silico-to-bedside transposition, we believe that the more complex is a phenomenon, the simpler should be the mathematical model describing it" [44]. This principle of parsimony suggests that model complexity should be carefully balanced against available data and intended application.
Experimental Protocols and Methodologies
Foundational Modeling Requirements and Workflow
The construction and evaluation of relevant PK/PD models require suitable pharmacokinetic data, appreciation for molecular and cellular mechanisms of pharmacological responses, and quantitative measurements of meaningful biomarkers within the causal pathway between drug-target interactions and clinical effects [43]. Good experimental designs are essential to ensure sensitive and reproducible data collection covering appropriate dose/concentration ranges and study duration [43].
Table 2: Essential Components of PK/PD Model Development
| Component | Requirements | Purpose |
|---|---|---|
| PK Data | Appropriate sampling schedule and duration | Characterize drug exposure |
| PD Biomarkers | Sensitive, gradual, quantitative, reproducible | Measure drug effects |
| Dose Range | Wide concentration range | Estimate nonlinear parameters |
| Study Design | Multiple dose levels | Adequate parameter estimation |
| Model Structure | Plausible pharmacological basis | Biological relevance |
The standard model building process begins with defining analysis objectives and careful graphical analysis of raw data [43]. Appropriate pharmacokinetic functions are derived from concentration-time profiles, which often serve as a driving function for the pharmacodynamic model [43]. Model parameters are estimated using nonlinear regression techniques, with selection of final models based on objective fitting criteria and diagnostic checks [43].
Specific Protocol: Myelosuppression Modeling
Semi-mechanistic models for myelosuppression represent one of the most successful applications of mechanism-based PK/PD modeling. The well-established Friberg model structure incorporates key physiological processes of hematopoiesis [45]:
Model Equations:
Experimental Requirements:
- Absolute neutrophil counts (ANC) or white blood cell counts (WBC) over time
- Drug concentration measurements for PK modeling
- Baseline hematological parameters
- Multiple dose levels to characterize exposure-response
This model successfully captures the proliferation, maturation, and circulation of neutrophils while incorporating a feedback mechanism to describe rebound effects [45]. The system-related parameters have demonstrated consistency across different drugs, enabling interchangeability and broader application [45].
Advanced Protocol: Cytokine Release Syndrome Modeling
Recent research has developed mechanistic PK/PD models to describe cytokine release associated with CD3 T-cell engager therapies, representing cutting-edge applications in immuno-oncology [46]. The model structure incorporates key biological players: TCE pharmacokinetics, tumor cells, T-cells in different activation states, and interleukins.
Key Model Components:
- PK Model: 1-compartment model with linear clearance
- T-cell Dynamics: Three states (naive, activated, desensitized)
- Activation Signal: Emax-like relationship with TCE concentration
- Cytokine Release: Linked to T-cell activation state
- Tumor Cell Killing: Uncoupled from cytokine release
Experimental Foundation: The model was developed based on preclinical data from Li et al. where mammary tumor-bearing mice were treated with two subsequent doses of anti-HER2 T-cell Bispecific at different dosing intervals (0, 1, 7, 14, 21, or 28 days) [46]. Systemic cytokine release (IL-6) was monitored two hours after each treatment, with the unique IL-6 sample assumed to reflect maximum levels [46].
Visualization of Core Modeling Concepts
Fundamental PK/PD Model Structure
Myelosuppression Model Structure
T-cell Engager Cytokine Release Model
The Scientist's Toolkit: Essential Research Reagents and Solutions
Table 3: Key Research Reagent Solutions for PK/PD Modeling
| Reagent/Resource | Function | Application Examples |
|---|---|---|
| Nonlinear Mixed-Effects Software | Parameter estimation and model fitting | NONMEM, Monolix, Phoenix NLME |
| Ordinary Differential Equation Solvers | Numerical solution of model equations | R (RxODE2), MATLAB, Berkeley Madonna |
| Biomarker Assays | Quantification of physiological responses | ELISA, flow cytometry, clinical chemistry |
| Bioanalytical Methods | Drug concentration measurement | LC-MS/MS, HPLC-UV |
| Clinical Data Management Systems | Collection and organization of patient data | Electronic data capture (EDC) systems |
| Virtual Population Generators | Simulation of representative patients | Trial simulator software, copula modeling |
| Model Diagnostic Tools | Assessment of model performance | Visual predictive checks, goodness-of-fit plots |
| Sensitivity Analysis Tools | Identification of influential parameters | Parameter sensitivity analysis algorithms |
Recent advances have introduced machine learning approaches to population pharmacokinetic modeling automation, with tools like pyDarwin demonstrating capability to automatically identify optimal model structures from predefined search spaces containing >12,000 unique popPK model structures [8]. These automated approaches can evaluate model structures in less than 48 hours on average while assessing fewer than 2.6% of models in the search space [8].
The evolution from traditional to mechanism-based pharmacodynamic models represents a paradigm shift in pharmacokinetic/pharmacodynamic modeling. While traditional empirical models continue to offer practical advantages for bedside application due to their simplicity and easier parameter identifiability [44], mechanism-based models provide superior biological insight and potential for extrapolation.
The choice between these approaches should be guided by the specific research context, available data quality and quantity, and intended application of the model. For early drug development and understanding complex biological systems, mechanism-based models offer unparalleled insights. For clinical dose optimization and therapeutic drug monitoring, simplified semi-mechanistic or even empirical models may provide more practical solutions.
Future directions in the field point toward increased integration of quantitative systems pharmacology, machine learning approaches for model development [8], and more sophisticated translational frameworks that bridge preclinical and clinical development [47]. As these technologies mature, the distinction between traditional and mechanism-based approaches may blur, leading to hybrid models that balance biological fidelity with practical utility across the drug development continuum.
In the evolving landscape of pharmacokinetics, the choice between traditional and mechanism-based modeling approaches is pivotal. While mechanistic models like Physiologically-Based Pharmacokinetic (PBPK) modeling offer a "bottom-up" approach based on physiology and drug properties, traditional pharmacokinetic models remain the established, "fit-for-purpose" standard for specific, well-defined applications such as bioequivalence studies and initial PK profiling. [11] [48] This guide objectively compares the performance of traditional models against emerging alternatives, providing data and methodologies that underscore their continued relevance.
Traditional Models in Action: Core Use Cases and Data
Traditional compartmental and noncompartmental analysis (NCA) models provide robust, efficient solutions for key development milestones. The following table summarizes their primary applications and quantitative performance based on recent literature and regulatory submissions.
Table 1: Showcase of Traditional Model Applications and Performance
| Application Area | Specific Use Case | Modeling Approach | Reported Performance & Outcome |
|---|---|---|---|
| Bioequivalence (BE) Assessment | BCS Class III Biowaiver Support | Physiologically Based Biopharmaceutics Modeling (PBBM) | PBBM can justify biowaivers, avoiding costly BE studies when excipient differences are within 10%. [49] |
| Initial PK Profiling | First-in-Human (FIH) Dose Prediction | PBPK (Middle-Out) | For 78% of chemicals in a DNT study, PBPK-predicted doses were within three-fold of in vivo effect levels. [41] |
| Special Population Dosing | Pediatric Dose Optimization for Hemophilia A | Minimal PBPK (mPBPK) | mPBPK predicted adult and pediatric AUC and Cmax for coagulation factors within ±25% of observed data. [5] |
| Model-Informed Precision Dosing (MIPD) | Forecasting Individual Drug Exposure | Population PK (PopPK) with Bayesian Forecasting | PopPK models enable model-informed precision dosing by forecasting future drug levels for individual patients. [10] |
Experimental Protocols: Methodologies for Key Applications
The reliable performance of these models hinges on rigorous, standardized experimental protocols. Below are detailed methodologies for two critical applications.
Protocol for Bioequivalence Assessment Using PBBM
This protocol outlines the use of Physiologically Based Biopharmaceutics Modeling (PBBM) to support a Biopharmaceutics Classification System (BCS) Class III biowaiver, as an advanced application that builds upon traditional concepts. [49]
- Objective: To demonstrate bioequivalence for a highly soluble, low-permeability drug (BCS Class III) without a new clinical study, by leveraging modeling.
- Materials:
- Drug Substance: Comprehensive physicochemical data (solubility, pKa, particle size distribution).
- Formulation Data: Detailed qualitative and quantitative composition of both test and reference products.
- In Vitro Data: Dissolution profiles under multiple conditions (pH 1.2-6.8).
- Software: A validated PBBM platform (e.g., GastroPlus). [50]
- Procedure:
- Model Development: Build and validate a PBPK model for the reference drug product using its clinical PK data.
- Input Integration: Incorporate the drug's permeability data and the reference product's dissolution profile into the model.
- Virtual Trial Simulation: Execute virtual bioequivalence trials using the dissolution profile of the test product.
- Comparison & Risk Assessment: Compare the simulated PK exposure (AUC, Cmax) of the test product against the reference. Assess the impact of any excipient variations (must be ≤10% cumulative difference). [49]
- Output Analysis: The biowaiver is supported if the 90% confidence intervals for the ratios of simulated AUC and Cmax fall within the 80-125% bioequivalence range.
Protocol for Initial PK Profiling via PBPK
This protocol describes a "middle-out" approach to PBPK for initial PK profiling, integrating prior knowledge ("top-down") with mechanistic principles ("bottom-up"). [48]
- Objective: To predict human pharmacokinetics and select a safe starting dose for First-in-Human (FIH) trials.
- Materials:
- Procedure:
- Parameterization: Enter drug-specific parameters (e.g., molecular weight, lipophilicity, intrinsic clearance) into the PBPK software.
- System Selection: Select the appropriate virtual population (e.g., healthy volunteers).
- Model Verification (Middle-Out): Calibrate the initial model using any available in vivo PK data from preclinical species.
- Human PK Simulation: Run simulations for the proposed FIH dosing regimens.
- Dose Selection: Analyze the simulated exposure (AUC, Cmax) to determine a safe starting dose that provides adequate margins relative to preclinical toxicology findings.
- Output Analysis: The key outputs are the predicted concentration-time profile in humans and the derived PK parameters (AUC, Cmax, half-life), which form the basis for the FIH trial design.
The workflow for this middle-out modeling approach is summarized below.
Comparative Analysis: Traditional vs. Mechanism-Based Modeling
While traditional compartmental/NCA models are efficient for specific questions, mechanism-based PBPK models offer distinct advantages and limitations, as shown in the table below. A "middle-out" approach, which integrates both, is often most effective. [48]
Table 2: Comparison of Traditional and Mechanism-Based PK Modeling Approaches
| Aspect | Traditional Compartmental/NCA | Mechanistic PBPK Modeling |
|---|---|---|
| Core Approach | "Top-down"; empirical fitting to observed data. | "Bottom-up" or "Middle-out"; based on physiology and drug properties. [48] |
| Primary Strength | High efficiency and reliability for well-defined questions like BE and initial PK. | Mechanistic insight; ability to extrapolate to new scenarios (e.g., DDI, special populations). [5] [48] |
| Data Requirements | Relies on rich in vivo PK data. | Heavily depends on in vitro and in silico data for parameterization. [48] |
| Regulatory Acceptance | Gold standard for bioequivalence and initial PK profiling. | Growing acceptance for specific contexts (e.g., DDI, pediatric extrapolation) but requires rigorous validation. [5] [49] |
| Key Limitation | Limited ability to extrapolate outside studied conditions. | Predictions may not always fit observed data without calibration ("Middle-out" is often needed). [48] |
The Scientist's Toolkit: Essential Research Reagents and Solutions
Successful implementation of these modeling approaches requires a suite of specialized software and methodologies.
Table 3: Essential Tools for Pharmacokinetic Modeling and Analysis
| Tool Name / Category | Type | Primary Function in PK Modeling |
|---|---|---|
| Phoenix WinNonlin [51] | Software | Industry-standard for Noncompartmental Analysis (NCA) and PK/PD modeling. |
| GastroPlus [50] | Software | A PBPK/PBBM platform for predicting absorption, PK, and bioequivalence. |
| Simcyp Simulator [48] | Software | A PBPK platform specialized for predicting drug-drug interactions and population variability. |
| PK-Sim [48] | Software | An open-source whole-body PBPK modeling platform. |
| Noncompartmental Analysis (NCA) [11] | Methodology | Model-independent calculation of exposure parameters (AUC, Cmax, half-life) from concentration-time data. |
| Population PK (PopPK) [10] | Methodology | Identifies sources of variability in drug exposure across a population using sparse data. |
| Bayesian Forecasting [10] | Methodology | Technique for individualizing drug dosing by combining population PK models with patient-specific data. |
| In Vitro-In Vivo Correlation (IVIVC) [52] [51] | Methodology | Correlates in vitro dissolution data with in vivo PK to support biowaivers. |
The relationship between the core questions in drug development and the modeling tools used to answer them is fundamental.
Traditional pharmacokinetic models, including advanced applications of PBBM and "middle-out" PBPK, continue to be indispensable for answering critical questions in bioequivalence and initial PK profiling. Their strength lies in a "fit-for-purpose" approach—providing efficient, reliable, and regulatory-accepted solutions for well-defined problems. [11] [49] As the field advances, the strategic integration of these traditional methodologies with more mechanistic models will continue to enhance the efficiency and success of drug development.
In modern drug development, the shift from traditional empirical models to mechanistic, physiology-based approaches represents a fundamental change in pharmacokinetic (PK) and pharmacodynamic (PD) modeling. Traditional models, including non-compartmental analysis (NCA) and standard population PK (PopPK), primarily describe observed data patterns without extensively incorporating biological realism. In contrast, mechanism-based models such as Physiologically Based Pharmacokinetic (PBPK) modeling and Quantitative Systems Pharmacology (QSP) integrate knowledge of drug properties with human (or animal) physiology to create a biological framework that can simulate drug disposition and effects across various scenarios and populations [53] [54].
This guide objectively compares the performance of these modeling paradigms, focusing on three critical applications in drug development: drug-drug interaction (DDI) prediction, pediatric extrapolation, and first-in-human (FIH) dose selection. We present supporting experimental data, detailed methodologies, and key reagent solutions to inform researchers and drug development professionals.
Drug-Drug Interaction (DDI) Prediction
Performance Comparison of DDI Prediction Models
Drug-drug interactions can significantly alter a drug's exposure, leading to reduced efficacy or increased toxicity. Various modeling approaches are employed to predict these interactions, ranging from simple static to complex dynamic models [54] [55].
Table 1: Comparison of DDI Prediction Modeling Approaches
| Model Type | Key Characteristics | Typical Input Parameters | Strengths | Limitations | Reported Accuracy (AUC ratio prediction) |
|---|---|---|---|---|---|
| Basic Static Model | - Single time point assessment- Uses maximal inhibitor concentrations- Simple equations | - f~m~ (Fraction metabolized)- [I]~max~ (Max. inhibitor concentration)- K~i~ (Inhibition constant) | - Simple, rapid screening- Conservative (often worst-case)- Low resource requirement | - Tends to overpredict DDI risk- No temporal considerations- Population averages only | Often >2-fold overprediction for CYP3A4 TDI [56] |
| Mechanistic Static Model (MSM) | - Accounts for multiple interaction mechanisms- Uses average systemic concentrations- Multiplicative model for enzymes/transporters | - f~m~, K~i~, IC~50~, E~max~- [I]~avg,ss~ (Avg. steady-state conc.)- Gut concentration parameters | - More refined than basic model- Considers concurrent mechanisms- Suitable for regulatory filing support [55] | - Still limited to population averages- Less suitable for complex TDI | Comparable to PBPK for AUC ratio; ~80% concordance with PBPK for regulatory decisions [55] |
| Dynamic PBPK Model | - Time-varying drug concentrations- Incorporates system physiology- Simulates virtual populations | - All MSM parameters plus:- System-specific parameters (organ volumes, blood flows)- Enzyme turnover (k~deg~)- Tissue composition data | - Handles complex scenarios (e.g., time-dependent inhibition, induction)- Can simulate inter-individual variability- Enables "what-if" scenario testing | - High resource requirement- Extensive data needs- Complex model verification | Within 0.8-1.25-fold of observed for 75% of CYP3A4 DDIs with optimized assays [56] [57] |
Experimental Protocol for CYP3A4/5 Time-Dependent Inhibition (TDI) Assessment
Accurate DDI prediction, especially for time-dependent inhibition, relies on robust in vitro data. The following protocol is used for definitive TDI parameter (K~I~ and k~inact~) determination [56]:
- Incubation Setup: Pooled human liver microsomes (HLM) are pre-incubated with varying concentrations of the perpetrator drug and NADPH regeneration system for multiple time points (e.g., 0, 5, 10, 20, 30 minutes).
- Activity Measurement: After pre-incubation, an aliquot is transferred to a secondary incubation containing a probe substrate (e.g., midazolam for CYP3A4/5) at a concentration near its K~m~ value. The reaction is quenched after a short, defined period.
- Analytical Quantification: Metabolite formation (e.g., 1′-hydroxymidazolam) is quantified using LC-MS/MS.
- Data Analysis: The natural logarithm of the remaining enzyme activity is plotted against pre-incubation time for each perpetrator concentration. The slope of this line represents the observed inactivation rate (k~obs~) at that concentration.
- Parameter Estimation: k~obs~ values are plotted against perpetrator concentrations and fitted to a nonlinear hyperbolic model to derive the inactivation constant (K~I~) and maximal inactivation rate (k~inact~).
Alternative Assay Modifications: To improve in vitro-in vivo extrapolation (IVIVE), modifications such as adding glutathione (GSH) to trap reactive metabolites or using suspended human hepatocytes (in buffer or plasma) can be implemented. These systems more closely mimic the in vivo environment and have been shown to reduce the overprediction tendency of traditional HLM assays [56].
PBPK Model Workflow for DDI Prediction
The following diagram illustrates the core workflow for developing and applying a PBPK model to predict drug-drug interactions, integrating in vitro data into a physiological framework.
Diagram 1: PBPK-Prediction Workflow
Pediatric Extrapolation
Pediatric Dose Prediction: Simple Methods vs. PBPK Modeling
Selecting a safe and effective first-in-pediatric dose is challenging due to physiological and biochemical differences between children and adults. Various methods are employed, from simple scaling rules to complex PBPK models [58].
Table 2: Comparison of Pediatric Dose Prediction Methods
| Method | Description | Key Inputs | Performance (Prediction Error ≤30%) | Remarks |
|---|---|---|---|---|
| Weight-Based Allometry (Exponent 0.75) | Scaling based on body weight raised to a theoretical exponent of 0.75 | Adult dose, child weight, exponent=0.75 | ~70% of observations across 27 drugs [58] | Theoretical exponent; less suitable for children ≤2 years |
| Weight-Based Allometry (Exponent 0.9) | Scaling based on body weight raised to an exponent of 0.9 | Adult dose, child weight, exponent=0.9 | >70% of observations across 27 drugs [58] | Advocated as a middle-ground exponent in previous publications |
| Salisbury Rule | Simple weight-based method | Adult dose, child weight | Works fairly well in children >30 kg [58] | Simple, can be used in clinical settings |
| Clearance-Based Prediction | Uses predicted pediatric clearance to estimate dose | Adult clearance, child weight, allometric exponent | >70% of observations across 27 drugs [58] | Requires prediction or measurement of pediatric clearance |
| Whole-Body PBPK | Mechanistic model incorporating ontogeny of enzymes, transporters, and organ function | Drug-specific parameters, system data with age-dependent physiology | Predictive performance comparable to simple methods (>70% accuracy) [58] | Can simulate from preterm neonates to adolescents; accounts for complex physiology |
A study comparing these methods across 27 drugs with 113 observations (from preterm neonates to adolescents) found that the simple methods (allometric scaling and Salisbury rule) performed comparably to the whole-body PBPK model, with at least ≤30% prediction error for more than 70% of observations [58].
Case Study: PBPK for Pediatric Dose Selection of a Novel Therapy
PBPK modeling is particularly valuable for extrapolating adult data to special pediatric populations, especially when clinical data is limited. A notable case is the application of a minimal PBPK model for ALTUVIIIO, a recombinant Factor VIII therapy for hemophilia A, to support dose selection in children under 12 years [5].
- Model Structure: A minimal PBPK model for monoclonal antibodies was used, describing distribution and clearance mechanisms involving the FcRn recycling pathway.
- Model Verification: The model was first developed and evaluated using clinical data from a similar FDA-approved product (ELOCTATE, an Fc fusion protein) in adults and children. The model predicted the maximum concentration (C~max~) and area under the curve (AUC) values in both adults and children with reasonable accuracy (prediction error within ±25%) [5].
- Pediatric Extrapolation: The verified model, incorporating the effects of age on FcRn abundance and vascular reflection coefficient, was used to simulate the PK of ALTUVIIIO in pediatric patients. The simulations informed the dosing regimen by predicting the time for which FVIII activity levels were maintained above therapeutically relevant thresholds.
First-in-Human Dose Selection
Decision Framework for Model Selection in FIH Dose Estimation
Selecting the first-in-human dose requires a careful balance between ensuring safety and achieving therapeutic exposure. The choice of modeling approach depends on the available data, drug characteristics, and development stage. The following diagram outlines a decision pathway for selecting the appropriate modeling strategy.
Diagram 2: FIH-Dose Selection
Key Research Reagent Solutions for Mechanism-Based Modeling
The development and application of mechanism-based models rely on specific in vitro tools and software to generate critical input parameters.
Table 3: Essential Research Reagents and Tools for PBPK and DDI Modeling
| Reagent / Tool Category | Specific Examples | Function in Model Development | Key Applications |
|---|---|---|---|
| In Vitro Reagents | Pooled Human Liver Microsomes (HLM) | Provide a system for determining metabolic stability and enzyme kinetic parameters (K~m~, V~max~) | Intrinsic clearance prediction, metabolic phenotyping |
| Cryopreserved Human Hepatocytes (Suspended & Plated) | Assess metabolic clearance, transporter effects, and enzyme induction (E~max~, EC~50~) | IVIVE for clearance and DDIs; induction potential assessment | |
| Recombinant CYP Enzymes | Identify specific CYP enzymes involved in metabolism and determine enzyme kinetics | Reaction phenotyping, determining fraction metabolized (f~m~) | |
| Software Platforms | PBPK Modeling Software (e.g., Simcyp, GastroPlus, PK-Sim) | Integrated platforms for PBPK model building, simulation, and virtual population generation | FIH dose prediction, DDI risk assessment, pediatric and organ impairment extrapolation |
| Biomarkers & Clinical Tools | Plasma-based Liquid Biopsy (sEVs) | Less invasive profiling of enzyme/transporter expression from patient blood samples | Model verification, independent DDI data [53] |
| Clinical Probe Substrates (e.g., Midazolam for CYP3A4) | Sensitive markers to assess enzyme activity in vivo in clinical DDI studies | PBPK model verification and calibration [53] [56] |
The transition from traditional to mechanism-based models represents a significant advancement in model-informed drug development. As the case studies and data demonstrate:
- For DDI prediction, dynamic PBPK models excel in complex scenarios (e.g., time-dependent inhibition, transporter-enzyme interplay), while refined mechanistic static models can be sufficient and resource-efficient for AUC ratio prediction in many standard cases [56] [55].
- For pediatric extrapolation, simple allometric methods demonstrate remarkable utility and can be comparable in accuracy to whole-body PBPK for initial dose projection. However, PBPK models provide a superior mechanistic framework for simulating across the entire pediatric age range and accounting for complex ontogeny [58] [5].
- For FIH dose selection, the choice of model is context-dependent. Simple methods provide a rapid, reliable starting point, while PBPK models offer a more holistic and flexible approach, particularly when extrapolating to special populations or anticipating complex drug interactions.
The future of mechanism-based modeling lies in the integration of novel data sources, such as liquid biopsy for model verification [53], and the adoption of machine learning to enhance model building and DDI prediction from large datasets [57]. A fit-for-purpose approach, selecting the model complexity that matches the decision at hand, will maximize efficiency and confidence in drug development.
In drug development, understanding the relationship between drug concentration and physiological effect is paramount. Traditionally, this has been approached using empirical pharmacokinetic-pharmacodynamic (PK/PD) models. These models are often data-driven, using mathematical functions like the Hill equation to describe the relationship between plasma drug concentration and the observed effect without explicitly representing the underlying biological system [59]. While useful, such empirical models have limited predictive power when extrapolating to new dosing regimens, different patient populations, or even similar drugs, as they lack mechanistic insight [59] [60].
In contrast, Physiologically Based Pharmacokinetic-Pharmacodynamic (PBPK-PD) modeling represents a mechanism-based approach. PBPK models simulate drug absorption, distribution, metabolism, and excretion (ADME) by incorporating specific, physiologically meaningful compartments for tissues, connected by blood flow, and parameterized with anatomical, physiological, and biochemical data [60]. When linked to a PD component, this framework can predict drug concentration at the actual site of action and its resulting effect, providing a more holistic and predictive understanding of drug behavior [5] [59]. This case study explores a specific application of a PBPK-PD model to quantify heart rate changes induced by delta-9-tetrahydrocannabinol (THC), illustrating the power and utility of this modern methodology.
As cannabis becomes more widely legalized, assessing the risk of THC-induced tachycardia—a well-documented side effect—has gained clinical and regulatory importance. A 2025 study set out to develop and verify a PBPK-PD model specifically designed to assess the impact of THC and its active metabolite, 11-hydroxy-THC (11-OH-THC), on the heart rate of healthy adults [61].
The core objective was to create a single model capable of accurately predicting heart rate changes following THC administration via different routes, including intravenous (IV), oral, and inhaled. The model was built and validated using clinical data from published studies and was subsequently used to simulate the risk of tachycardia across a virtual population of 500 individuals aged 18-65 years [61].
Key Structural Components of the Model
The model's architecture integrated several key mechanistic components:
- PBPK Model: This component predicted the pharmacokinetics of both THC and 11-OH-THC. It was a full physiologically-based model that simulated the concentration of these compounds over time in various tissues, including the blood, brain, and heart [61].
- PD Model: The pharmacodynamic component was a direct nonlinear Emax model. This model was driven by the sum of the total THC and 11-OH-THC concentrations in their effect compartments, which were linked to the heart compartments simulated in the PBPK model [61].
- Final Workflow: The model development involved first creating a PBPK-PD model for IV 11-OH-THC, followed by a comprehensive model for IV THC that included the formation of its metabolite. This model was then verified, validated, and adapted for oral and inhaled routes of administration [61].
The diagram below illustrates the logical workflow and integration of the PBPK and PD components in this study.
Experimental Protocol and Workflow
The development and application of the THC PBPK-PD model followed a rigorous, multi-stage protocol. The methodology can be broken down into three primary phases, which ensured the model's robustness and predictive capability.
Phase 1: Model Development and Structural Identification
The first phase involved building the structural foundation of the model.
- PBPK Model Construction: The model was built using physiologically realistic compartments. Key parameters, such as tissue volumes and blood flow rates, were sourced from anatomical and physiological literature. Drug-specific parameters for THC and 11-OH-THC, including lipophilicity and plasma protein binding, were incorporated [61] [60].
- PD Model Selection: Different PD model structures were tested, including models driven by the plasma, brain, and heart concentrations of THC and its metabolite. The model that best described the observed data was a direct nonlinear Emax model driven by the sum of total THC and 11-OH-THC concentrations in their effect compartments linked to the heart [61].
- Parameter Estimation: Critical PD parameters—the maximum possible heart rate increase (Emax), the concentration producing half of Emax (EC50), and the equilibrium rate constant between plasma and the effect site (ke0)—were estimated by fitting the model to observed clinical data [61] [62].
Phase 2: Model Verification and Validation
A crucial step was ensuring the model accurately reflected real-world observations.
- Verification: The model's predictive performance was tested against the clinical datasets used for its development. This process involved ensuring that the implemented computer code correctly solved the mathematical equations and that the model could recover the original data [62].
- Validation: The model was then challenged with independent clinical data not used during the model-building process. The study reported that for 42 simulated dosing regimens (THC doses from 2 to 69.4 mg), 97% of the observed heart rates or heart rate changes fell within the 5th to 95th percentiles of the model's predictions. Similarly, for IV 11-OH-THC, 93% of observations fell within this range, demonstrating high predictive accuracy [61].
Phase 3: Simulation and Risk Assessment
The final phase utilized the validated model to generate novel, clinically relevant insights.
- Virtual Population Simulation: The model was used to simulate heart rate responses in a virtual population of 500 healthy adults (age 18-65, 1:1 sex ratio) with a baseline heart rate of 70 beats per minute [61].
- Tachycardia Risk Quantification: Simulations were run for various doses of oral and inhaled THC. The model calculated the dose at which half of the simulated population would experience tachycardia. This was identified as 60 mg for oral administration and 15 mg for inhaled administration [61].
Results and Data Analysis
The PBPK-PD model provided quantitative, dose-dependent predictions of THC's effect on heart rate. The following table summarizes the key pharmacokinetic and pharmacodynamic parameters that were integral to the model's function, along with the primary simulation output for tachycardia risk.
Table 1: Key Model Parameters and Simulation Output for THC-Induced Tachycardia
| Category | Parameter | Description | Value/Role in Model |
|---|---|---|---|
| PD Parameters | Emax | Maximum possible increase in heart rate (as a fraction of baseline) | Estimated from clinical data [61] |
| EC50 | Concentration of (THC + 11-OH-THC) producing half of Emax | Estimated from clinical data [61] | |
| ke0 | Equilibrium rate constant between plasma and effect site | Estimated from clinical data [61] | |
| PBPK Components | Heart Compartment | Represents the physiological heart tissue | Linked to the PD effect compartment [61] |
| Effect Compartment | A theoretical compartment linked to the heart where the drug exerts its effect | Drives the nonlinear Emax model [61] | |
| Validation Output | Prediction Accuracy | Percentage of observed clinical data within model's 5th-95th percentile | 97% for THC, 93% for 11-OH-THC [61] |
| Risk Simulation | Tachycardia Threshold (50% of population) | Dose at which half the virtual population experiences tachycardia | Oral: 60 mg; Inhaled: 15 mg [61] |
The model's successful validation across a wide range of doses (2-69.4 mg) and routes of administration confirms its utility as a predictive tool. The significant difference in tachycardia risk between oral and inhaled doses highlights the critical importance of route-specific pharmacokinetics, which the PBPK model is uniquely equipped to handle.
Building and applying a PBPK-PD model of this complexity requires a suite of computational and experimental resources. The table below details key "research reagent solutions" essential for work in this field.
Table 2: Essential Toolkit for PBPK-PD Modeling Research
| Tool/Resource | Type | Function in Research |
|---|---|---|
| PBPK Software Platform (e.g., Simcyp, PK-Sim) | Software | Provides a pre-validated, physiological simulation environment to build, verify, and run PBPK and PBPK-PD models [62] [63]. |
| Clinical PK/PD Datasets | Data | Serves as the essential ground truth for model calibration (parameter estimation) and validation (predictive performance) [61] [8]. |
| Model Verification & Validation (V&V) Framework | Methodology | A structured process to ensure the model is implemented correctly (verification) and that it accurately predicts independent data (validation) [62]. |
| Virtual Population Generator | Software Algorithm | Creates simulated populations with realistic physiological variability (e.g., in age, organ size, blood flow) to assess inter-individual variability in drug response [61] [63]. |
| Sensitivity Analysis Tools | Software Algorithm | Identifies which model parameters (e.g., enzyme activity, tissue affinity) have the greatest influence on the output, guiding future research and highlighting uncertainty [63]. |
Discussion: Advantages of a Mechanism-Based Approach
The application of a PBPK-PD model to THC-induced tachycardia offers a compelling case for the advantages of mechanism-based modeling over traditional empirical approaches.
- Enhanced Predictive Power: Unlike traditional PK/PD models that are often limited to interpolating within existing data, the mechanistic foundation of the PBPK-PD model allows for justifiable extrapolation. The model successfully predicted outcomes for different routes of administration (IV, oral, inhaled) and across a wide range of doses, a task that is challenging for purely empirical models [61] [60].
- Translational Utility in Drug Development: This case study exemplifies how PBPK-PD models can de-risk drug development and inform clinical use. By simulating outcomes in a virtual population, the model identified route-specific dosing thresholds for tachycardia, providing valuable information for both clinical trial design and consumer safety guidelines [61] [22]. Regulatory agencies like the FDA increasingly encourage the use of such models to support dosing decisions [5] [22].
- Accounting for Complex Biology: The model incorporated the role of the active metabolite 11-OH-THC, which is known to contribute to THC's psychoactive and physiological effects. This ability to integrate complex ADME processes, such as metabolite formation and tissue-specific distribution, is a hallmark of the PBPK approach and provides a more systems-level understanding of the drug's effects [61] [64].
It is important to note that the authors acknowledged the model does not fully elucidate the biological mechanism of THC-induced tachycardia, which remains complex and not fully understood. The PD component remains an empirical Emax model, albeit driven by a mechanistically-predicted tissue concentration [61] [62]. Future work could focus on developing a more truly mechanistic PD model that incorporates the physiological pathways influencing heart rate.
This case study demonstrates that a rigorously developed and validated PBPK-PD model can successfully quantify heart rate changes following THC administration in healthy adults. The model's ability to accurately predict clinical data and simulate tachycardia risk across different routes of administration underscores the value of the mechanism-based PBPK approach. By integrating physiological and drug-specific information, this methodology provides a powerful tool for predicting drug effects, guiding dosing regimens, and improving the safety profile of both new and existing therapeutics, marking a significant advancement over traditional empirical modeling strategies.
Strategic Selection and Implementation: Navigating Challenges and Model Optimization
In modern drug development, the choice of a pharmacokinetic (PK) modeling strategy is a critical decision point that can significantly influence a compound's development trajectory. Researchers and scientists face a fundamental choice between traditional empirical approaches and mechanistic, physiology-based frameworks. This decision carries substantial implications for resource allocation, trial design, and regulatory strategy. Traditional population pharmacokinetic (PopPK) modeling and physiologically based pharmacokinetic (PBPK) modeling represent two fundamentally different philosophies in quantitative pharmacology [19]. PopPK models follow a "top-down" paradigm, starting with observed clinical data to build an empirical model that describes drug behavior, while PBPK models adopt a "bottom-up" approach, beginning with established physiological and drug-specific parameters to predict pharmacokinetics [48] [19]. Understanding the distinct strengths, limitations, and appropriate applications of each approach is essential for optimizing drug development efficiency and successfully navigating regulatory requirements. This guide provides a structured framework for selecting the optimal modeling approach based on specific project stages and research questions, supported by experimental data and implementation protocols.
Core Conceptual Differences: Empirical vs. Mechanistic Approaches
At their foundation, PopPK and PBPK models differ in their fundamental structure, parameterization, and underlying philosophy. These differences dictate their respective applications throughout the drug development lifecycle.
Population PK (PopPK) Models: The "Top-Down" Empirical Approach
PopPK models are compartment-based structures where compartments do not necessarily correspond to specific physiological entities [19]. These models use nonlinear mixed-effects modeling to analyze sparse or rich PK data from study populations, identifying fixed effects (population typical values) and random effects (inter-individual variability) [3]. The model development process typically begins with a simple structural model (e.g., one-compartment with linear elimination), with complexity added only when statistically justified by the available data [19]. A key strength of PopPK is its ability to quantify variability and identify covariate relationships from observed clinical data, making it particularly valuable for characterizing known sources of variability in patient populations [19].
PBPK Models: The "Bottom-Up" Mechanistic Approach
PBPK models employ compartments with direct physiological correspondence, representing specific organs and tissues connected by realistic blood flows [48] [19]. These models integrate drug-specific parameters (e.g., lipophilicity, protein binding, metabolic clearance) with system-specific parameters (e.g., organ volumes, blood flows, enzyme abundances) to mechanistically simulate drug disposition [48]. This structure allows PBPK models to predict drug concentration-time profiles not only in plasma but also in specific tissues of interest, providing insights into target site exposure [48]. The mechanistic nature of PBPK supports extrapolation beyond clinically studied conditions, making it particularly valuable for special population predictions and drug-drug interaction (DDI) forecasting [65].
Table 1: Fundamental Characteristics of PopPK vs. PBPK Modeling Approaches
| Characteristic | Population PK (PopPK) | Physiologically Based PK (PBPK) |
|---|---|---|
| Fundamental Approach | Top-down, empirical | Bottom-up, mechanistic |
| Model Structure | Abstract compartments (central, peripheral) | Anatomically realistic compartments (liver, kidney, etc.) |
| Primary Data Source | Clinical PK observations | In vitro assay data and physiological parameters |
| Variability Estimation | Quantifies inter-individual variability | Typically predicts typical subject, though population libraries exist |
| Parameter Interpretation | Empirical (statistical) | Physiological (mechanistic) |
| Strength | Identifying covariate relationships from data | Predicting PK in unstudied scenarios |
| Common Software | NONMEM, Monolix, Phoenix NLME | Simcyp, GastroPlus, PK-Sim |
Diagram 1: Model Selection Decision Framework. This flowchart outlines the primary decision points when choosing between PopPK and PBPK modeling approaches.
Quantitative Performance Comparison: Experimental Data and Case Studies
Case Study: Gepotidacin Pediatric Dose Prediction
A direct comparison of PopPK and PBPK approaches was conducted for gepotidacin, a novel antibiotic being developed for pneumonic plague. Both models were developed to predict pediatric doses when direct clinical testing was not feasible [23]. The PBPK model was constructed using Simcyp with physicochemical and in vitro data, then optimized with clinical data from adult studies. The PopPK model was developed using pooled PK data from phase 1 studies with intravenous gepotidacin in healthy adults [23].
Table 2: Performance Comparison of PopPK vs. PBPK for Gepotidacin Pediatric Prediction
| Performance Metric | PopPK Model | PBPK Model | Clinical Implications |
|---|---|---|---|
| Cmax Prediction | Slightly higher predictions compared to PBPK | Lower Cmax predictions | PopPK may recommend slightly lower doses to achieve target Cmax |
| AUC Prediction | Similar to PBPK across weight brackets | Similar to PopPK across weight brackets | Both models concordant for exposure targeting |
| Age Range Applicability | Limited for children <3 months without maturation functions | Comprehensive across all pediatric ages | PBPK more suitable for neonatal predictions |
| Body Weight Covariate | Key covariate affecting clearance | Key covariate affecting clearance | Both models identified allometric scaling as critical |
| Dosing Recommendation | Weight-based for ≤40 kg, fixed-dose for >40 kg | Similar weight-based approach | Regulatory acceptance of both approaches for pediatric dosing |
The comparative analysis revealed that both modeling approaches could reasonably predict gepotidacin exposures in children, with ~90% of PBPK-predicted PK for pediatrics falling between the 5th and 95th percentiles of adult values except for subjects weighing ≤5 kg [23]. However, the models diverged in predictions for children under 3 months old, highlighting the importance of incorporating maturation functions for drug-metabolizing enzymes in this vulnerable population [23].
Case Study: Developmental Neurotoxicity (DNT) IVIVE
In developmental neurotoxicity assessment, PBPK modeling demonstrated critical value for in vitro to in vivo extrapolation (IVIVE). Researchers used three different PBPK modeling platforms to derive human-relevant administered equivalent doses based on chemical partitioning into DNT target organs during critical brain development periods [41]. The approach was found to be relatively transferable among modeling platforms, with chemical predictions for administered equivalent doses compared against in vivo effect levels found to be within three-fold for 78% of chemicals [41]. This application highlights how PBPK modeling can supplement traditional in vivo guideline studies for risk assessment, providing a mechanistic basis for comparing human exposures with bioactive concentrations identified in in vitro assays.
Regulatory Submissions: CBER Experience with PBPK
The FDA Center for Biologics Evaluation and Research (CBER) has documented experience with PBPK model submissions, reporting 26 regulatory submissions and interactions involving PBPK modeling from 2018-2024 [5]. These submissions supported applications from 17 sponsors for 18 products, 11 of which targeted rare diseases. The majority of proposed PBPK models aimed to justify and optimize drug dosing in early development, offer mechanistic understanding of drug processing, and guide dosing strategies for specific populations [5]. The increasing adoption of PBPK in regulatory submissions underscores its growing acceptance for addressing specific drug development challenges.
Decision Framework: Model Selection by Development Stage
Early Discovery through First-in-Human Studies
During early development, PBPK models excel when clinical data are limited but in vitro characterisation is available. PBPK can predict first-in-human PK, inform starting dose selection, and flag potential DDI risks before clinical evaluation [48] [65]. For instance, PBPK modeling has been successfully applied to predict human PK from preclinical data, aiding lead optimization and candidate evaluation [48]. The European Medicines Agency (EMA) acknowledges that PBPK modeling is particularly valuable for predicting PK in populations where clinical trials are ethically or practically challenging, such as pediatric patients [66].
Clinical Development through Registration
PopPK becomes increasingly valuable as clinical data accumulate. Its strength lies in identifying and quantifying sources of variability in the target patient population using actual trial data [3] [19]. PopPK models are particularly well-suited for:
- Covariate analysis: Identifying patient factors (renal/hepatic impairment, age, weight) that significantly impact drug exposure
- Dose optimization: Simulating alternative dosing regimens to maximize efficacy and minimize toxicity
- Study design: Informing optimal sampling times and patient stratification strategies
The "middle-out" approach, which integrates both "bottom-up" PBPK and "top-down" PopPK methodologies, is frequently employed in later stages to leverage the strengths of both frameworks [48].
Special Population Considerations
For special populations, the choice between modeling approaches depends on available data and specific questions:
- Pediatrics: PBPK models can predict exposure across all pediatric ages when maturation of relevant elimination pathways is well-characterized [66]. PopPK can describe variability in children ≥2 years using allometric scaling with fixed exponents (0.75 for clearance, 1.0 for volume of distribution) [66].
- Organ Impairment: PBPK can simulate the effect of renal or hepatic impairment on drug exposure when clinical data are limited, while PopPK can quantify the magnitude of impairment effects from dedicated PK studies [65].
- Genetic Polymorphisms: PBPK can incorporate known genetic polymorphisms in drug-metabolizing enzymes (e.g., CYP2D6, CYP2C19) to predict exposure differences in specific metabolizer populations [65].
Table 3: Model Selection Guide by Development Stage and Question
| Development Stage | Primary Questions | Recommended Approach | Evidence Level |
|---|---|---|---|
| Early Discovery | First-in-human dose prediction? DDI risk? | PBPK | In vitro data + physiological parameters |
| Phase 1 | Food effect? Formulation comparison? | PBPK (absorption) + PopPK (systemic) | Sparse clinical + rich preclinical |
| Phase 2 | Covariate effects? Target exposure? | PopPK | Population data from targeted patients |
| Phase 3 | Dose justification? Label recommendations? | PopPK (primary) + PBPK (supportive) | Large population data |
| Post-Marketing | Special populations? New formulations? | Hybrid (PBPK/PopPK) | Real-world evidence + mechanistic |
Experimental Protocols and Methodologies
PopPK Model Development Workflow
The development of a population PK model follows a structured process with distinct stages [3]:
Data Assembly and Cleaning: Compile all concentration-time data with patient covariates. Scrutinize data for accuracy, identify potential outliers, and develop a strategy for handling below quantification limit (BQL) samples. Graphical assessment of data before modeling can identify potential problems [3].
Structural Model Development: Test increasingly complex models (1-, 2-, 3-compartment) to describe the typical concentration-time profile. Evaluate models using objective function value (OFV), Akaike information criterion (AIC), and Bayesian information criterion (BIC). A drop in BIC of >10 provides "very strong" evidence in favor of one model over another [3].
Statistical Model Development: Characterize between-subject variability (BSV) and residual unexplained variability (RUV) using exponential, proportional, or combined error models.
Covariate Model Development: Systematically test relationships between patient factors (weight, age, renal function) and PK parameters using forward inclusion/backward elimination. The likelihood ratio test (LRT) is used for nested models, with a significance level of p<0.01 for forward inclusion and p<0.001 for backward elimination [3].
Model Evaluation: Validate the final model using diagnostic plots, visual predictive checks, and bootstrap analysis.
Diagram 2: Comparative Model Development Workflows. This diagram illustrates the distinct development processes for PopPK (top) and PBPK (bottom) modeling approaches.
PBPK Model Development Workflow
The construction of a PBPK model follows a mechanistic, stepwise process [48]:
Define Model Architecture: Identify relevant anatomical compartments (e.g., liver, gut, kidney, richly/poorly perfused tissues) and their interconnections via blood flow.
System-Specific Parameterization: Incorporate physiological parameters (tissue volumes, blood flow rates, protein levels) for the target population. These are often obtained from standardized databases in PBPK software.
Drug-Specific Parameterization: Integrate physicochemical properties (molecular weight, logP, pKa) and in vitro data (permeability, protein binding, metabolic clearance) using in vitro-in vivo extrapolation (IVIVE).
Model Verification: Compare initial predictions with any available in vivo data (preclinical or clinical) and adjust parameters if necessary.
Model Validation: Test the model against independent datasets not used during model development. Evaluate predictive performance using mean absolute percentage error (MAPE) or other quantitative metrics.
Model Application: Employ the validated model for simulations (e.g., DDI, special populations, dosing regimens) to support specific development decisions.
The Scientist's Toolkit: Essential Research Reagents and Software
Implementation of robust PK modeling requires both specialized software tools and methodological expertise. The following resources represent the essential toolkit for researchers in this field.
Table 4: Essential Software Tools for Pharmacokinetic Modeling
| Tool Category | Representative Software | Primary Applications | Access Type |
|---|---|---|---|
| PopPK Modeling | NONMEM, Monolix, Phoenix NLME | Population analysis, covariate detection, dose optimization | Commercial |
| PBPK Platforms | Simcyp, GastroPlus, PK-Sim | DDI prediction, special populations, formulation design | Commercial/Open |
| NCA Tools | Phoenix WinNonlin, PKSolver | Non-compartmental analysis, bioequivalence | Commercial/Free |
| Programming Environments | R, Python, MATLAB | Custom model development, visualization, simulation | Open Source/Commercial |
Key Methodological Reagents
Beyond software platforms, successful implementation of PK modeling strategies requires several methodological components:
Allometric Scaling Exponents: Fixed theoretical exponents (0.75 for clearance, 1.0 for volume of distribution) are considered physiologically based and often provide adequate explanation for body weight relationships in pediatric patients [66].
Maturation Functions: Sigmoid Emax or Hill equation models describe the ontogeny of drug-metabolizing enzymes and organ function in pediatric populations, essential for accurate predictions in neonates and infants [66].
Covariate Relationships: Established physiological relationships (e.g., between creatinine clearance and renal drug elimination) provide biological plausibility for empirical covariate relationships identified in PopPK analyses [19].
Quality Control Protocols: Standardized procedures for data cleaning, outlier handling, and model diagnostics ensure robust and reproducible modeling outcomes [3].
The choice between traditional PopPK and mechanistic PBPK modeling is not a binary decision but rather a strategic consideration that should align with specific project stages and research questions. PopPK models excel when rich clinical data are available and the goal is to explain observed variability in the target population. In contrast, PBPK models provide greater value when predictions are needed for unstudied conditions, such as special populations, DDIs, or early development scenarios. The most effective modeling strategy often involves integrating both approaches—using PBPK to inform early development and design clinical studies, then applying PopPK to analyze the resulting clinical data and quantify variability. This synergistic approach leverages the strengths of both frameworks, providing both mechanistic understanding and quantitative characterization of variability throughout the drug development lifecycle. As regulatory agencies increasingly accept model-informed drug development approaches, strategic selection and implementation of appropriate pharmacokinetic modeling strategies will continue to grow in importance for efficient and successful drug development.
Within model-informed drug development, the choice between traditional population pharmacokinetic (PopPK) and mechanistic physiologically based pharmacokinetic (PBPK) modeling is fundamentally dictated by the nature and quantity of available data. PopPK models are traditionally applied to sparse, heterogeneous clinical data to identify covariates and quantify variability, while PBPK models rely on extensive pre-clinical and in vitro data to mechanistically simulate drug behavior across diverse populations and conditions [67]. This guide objectively compares the data requirements and handling capabilities of these approaches, framing them within the broader thesis of empirical versus mechanism-based modeling in pharmacokinetics.
Methodological Comparison: Core Data Requirements and Workflows
The foundational difference between PopPK and PBPK modeling lies in their structure and parameterization, which directly dictates their data needs.
PopPK: Empirical Modeling with Sparse Clinical Data
PopPK models use a top-down, empirical approach. They are typically built using nonlinear mixed-effects modeling to analyze sparse concentration-time data collected from patients during clinical trials. The primary goal is to describe the observed data and identify significant patient factors (covariates) that explain inter-individual variability in drug exposure [23] [68]. The model structure is not intrinsically physiological.
PBPK: Mechanistic Modeling with ExtensiveIn VitroInputs
PBPK models employ a bottom-up, mechanistic approach. They are constructed using a quantitative framework that integrates system-specific parameters (representing human physiology) and drug-specific parameters (derived from in vitro assays) [67]. These models consist of compartments representing different organs and tissues, connected by the circulating blood system, and are parameterized with known physiological variables such as tissue volumes and blood flow rates [67]. The primary goal is to predict drug pharmacokinetics by incorporating fundamental knowledge of physiology and drug properties.
Table 1: Fundamental Characteristics of PopPK and PBPK Modeling Approaches
| Feature | Population PK (PopPK) | Physiologically Based PK (PBPK) |
|---|---|---|
| Modeling Approach | Top-down, empirical | Bottom-up, mechanistic |
| Primary Data Source | Sarse clinical PK data from the target population | Extensive in vitro ADME and physicochemical data |
| Model Structure | Abstract compartments (central, peripheral) | Anatomically realistic compartments (organs, tissues) |
| Parameterization | Estimated from clinical data (e.g., CL, Vd) | Defined from in vitro data and physiology (e.g., Kp, fu) |
| Handling Variability | Quantifies variability using random effects | Can incorporate physiological variability from virtual populations |
The following workflow diagram illustrates the distinct data streams and processes for developing PopPK and PBPK models:
Experimental Evidence and Case Studies
Direct Comparison in Pediatric Dose Prediction for Gepotidacin
A seminal study directly compared PopPK and PBPK models to predict pediatric doses of the novel antibiotic gepotidacin for pneumonic plague, a scenario where clinical trials in children are not feasible [23].
- PopPK Model Development: A PopPK model was developed using pooled rich pharmacokinetic data from phase 1 studies with intravenous gepotidacin in healthy adults. Body weight was identified as a key covariate affecting clearance [23].
- PBPK Model Development: A full PBPK model was constructed in Simcyp using physicochemical properties, in vitro absorption, distribution, metabolism, and excretion (ADME) data, and was optimized with clinical data from an IV dose-escalation study and a human mass balance study. The model mechanistically incorporated ontogeny of CYP3A4 enzymes and renal function for pediatric predictions [23].
- Comparative Performance: Both models successfully predicted gepotidacin exposures in children and proposed similar weight-based dosing regimens for subjects ≤40 kg. However, a key difference emerged in predictions for children under 3 months old. The PopPK model was deemed potentially suboptimal for this low age group due to the absence of explicit maturation characterization for the drug-metabolizing enzymes involved in clearance [23].
Table 2: Experimental Outcomes from the Gepotidacin Pediatric Dosing Study [23]
| Model Attribute | Population PK (PopPK) Model | PBPK Model |
|---|---|---|
| Primary Input Data | Pooled IV PK data from adult phase 1 studies | Physicochemical properties, in vitro ADME data, adult clinical PK |
| Key Covariate | Body weight on clearance | Body weight and physiological ontogeny |
| Pediatric Predictions | ~90% of predicted PK fell within adult percentiles for most weight brackets | Similar mean AUC and Cmax to adult exposures across weight brackets |
| Performance in <3mo | Suboptimal due to lack of maturation characterization | Superior due to explicit incorporation of enzyme/renal ontogeny |
| Software Used | Not Specified | Simcyp |
Performance in Critically Ill Patients: PopPK vs. Machine Learning
A recent study in critically ill patients receiving voriconazole compared the predictive performance of a classical PopPK model with various machine learning (ML) algorithms [68]. This highlights the evolution of data-driven approaches.
- Methodology: A PopPK model was developed using patient data. Separately, six ML models (Linear Regression, Decision Tree, Support Vector Regression, Random Forest, Gradient-Boosted Decision Trees, and XGBoost) were trained on the same dataset. All models were externally validated with an independent dataset [68].
- Findings: The study concluded that the PopPK model was the most reliable and clinically useful predictor of voriconazole trough concentrations. While some ML models (XGBoost, GBDT) showed promising predictive performance, the PopPK model's predictability was more stable, and its parameters offered superior clinical interpretability for dose individualization [68].
Practical Implementation and Research Toolkit
Essential Research Reagents and Software Solutions
The implementation of PopPK and PBPK modeling relies on distinct sets of tools and "reagents," from biological assays to software platforms.
Table 3: Essential Research Reagent Solutions for PK Modeling
| Item Name | Function/Description | Relevance to Model Type |
|---|---|---|
| Simcyp Simulator | A population-based PBPK platform that incorporates virtual human populations and allows for IVIVE [67]. | Primarily PBPK |
| PK-Sim & Mobi | Open-source software suite within the Open Systems Pharmacology (OSP) suite for whole-body PBPK modeling [69]. | Primarily PBPK |
| R Program (nlmixr) | Open-source environment for nonlinear mixed-effects modeling, widely used for PopPK model development [69]. | Primarily PopPK |
| In Vitro ADME Assay Kits | Standardized kits for measuring key parameters like metabolic stability in human liver microsomes, plasma protein binding, and cellular permeability. | Primarily PBPK |
| NONMEM | The industry-standard software for nonlinear mixed-effects modeling, often used for PopPK and pharmacodynamic analysis. | Primarily PopPK |
| Virtual Population Databases | Libraries of physiological parameters (organ sizes, blood flows, enzyme abundances) representing different ages, ethnicities, and disease states [67]. | Primarily PBPK |
Software Platform Considerations
The choice of software can influence the modeling workflow. A recent case study comparing PK-Sim and R for developing a PBPK model for meloxicam in chickens found that while the workflow and input parameters differed between the platforms, the predictive performance of the final models was consistent [69]. This suggests that the core mechanistic principles of PBPK are more critical than the specific software tool. An analysis of FDA submissions revealed that Simcyp is the most widely used platform, appearing in 80.5% of application review files that included PBPK models from 2019-2023 [70].
The following diagram maps the decision-making process for choosing between PopPK and PBPK modeling based on project goals and data availability:
The comparison between PopPK and PBPK modeling underscores a fundamental trade-off between empirical efficiency and mechanistic predictability. PopPK modeling is a powerful tool for extracting information from sparse, variable clinical data to describe and quantify the sources of pharmacokinetic variability in a studied population. In contrast, PBPK modeling requires a significant upfront investment in high-quality in vitro and physicochemical data to build a mechanistic framework capable of predicting drug behavior in populations and scenarios that have not been directly studied clinically, such as children, patients with organ impairment, or those experiencing complex drug-drug interactions [23] [67] [70]. The choice between these approaches, or their strategic integration, should be guided by the specific research question, the available data, and the desired level of mechanistic insight.
In pharmacokinetics and toxicology, the selection of a modeling approach can fundamentally shape research outcomes and regulatory decisions. Traditional modeling techniques, particularly those relying on standard parametric structures, have long been the foundation for predicting drug behavior and treatment effects. However, evidence increasingly reveals that these methods contain critical vulnerabilities that can compromise their reliability, especially when applied to complex biological systems and novel therapeutic modalities.
This analysis examines two interconnected pitfalls that frequently undermine traditional models: structural uncertainty arising from inappropriate model assumptions, and limited extrapolation power beyond observed data ranges. Through quantitative comparisons and case studies, we demonstrate how these limitations manifest across different applications and evaluate emerging mechanistic and machine learning approaches that offer potential solutions. Understanding these limitations is essential for researchers, scientists, and drug development professionals seeking to enhance predictive accuracy in pharmacological research and development.
Structural Uncertainty in Traditional Modeling Approaches
Structural uncertainty refers to the limitations introduced by the fundamental mathematical assumptions and functional forms embedded within a model. When a model's structure inadequately represents the underlying biological processes, its predictions become unreliable, particularly for extrapolation beyond the observed data range.
Evidence from Survival Analysis in Cancer Immunotherapy
Research comparing extrapolation techniques for survival data from cancer immunotherapy trials reveals significant structural uncertainty in traditional parametric models. A 2023 study analyzing Checkmate 067 trial data for nivolumab and ipilimumab treatments demonstrated that standard parametric models frequently misrepresent complex survival hazards inherent to immunotherapies [71].
Table 1: Performance Comparison of Survival Extrapolation Techniques Based on Checkmate 067 Data
| Model Category | Specific Models | Mean Squared Error (Immature Data) | Mean Squared Error (Mature Data) | Bias | Ability to Capture Plateau |
|---|---|---|---|---|---|
| Standard Parametric | Exponential, Weibull, Gompertz, Log-logistic | Higher | Higher | Variable | Limited |
| Flexible Techniques | Fractional Polynomials, Restricted Cubic Splines, Royston-Parmar, Generalized Additive Models | Lower | Lower | Closer to zero | Superior |
| Advanced Parametric | Parametric Mixture Models, Mixture Cure Models | Moderate | Low | Low | Superior |
The investigation demonstrated that flexible modeling techniques consistently outperformed standard parametric approaches regardless of data maturity, with lower mean squared errors and reduced bias [71]. This performance gap widened substantially when models were applied to immature datasets where median overall survival had not yet been reached—a common scenario with novel immunotherapies. The structural limitations of standard parametric models became particularly evident in their inability to accurately represent the long-term plateaus characteristic of immunotherapy survival curves, leading to potentially flawed economic evaluations and reimbursement decisions [71].
Impact on Economic and Clinical Decision-Making
The choice of extrapolation model directly influenced cost-effectiveness analyses, with incremental cost-effectiveness ratios (ICERs) varying significantly based on the selected model structure [71]. This structural uncertainty introduces substantial variability into health economic evaluations, potentially compromising resource allocation decisions. The study recommended that researchers systematically identify and report structural uncertainty when evidence is insufficient to definitively select a single "correct" model from among several candidates with similar statistical performance [71].
Limited Extrapolation Power in Traditional Pharmacokinetic Modeling
Extrapolation power refers to a model's ability to make accurate predictions beyond the specific conditions under which it was developed—including different populations, dosing regimens, or physiological states. Traditional pharmacokinetic models often demonstrate limited extrapolation capability due to their empirical foundations.
Comparative Performance in Voriconazole Therapeutic Drug Monitoring
A direct comparison between traditional population pharmacokinetic (popPK) modeling and machine learning approaches for predicting voriconazole trough concentrations in critically ill patients revealed significant differences in extrapolation performance [68].
Table 2: External Validation Performance of Voriconazole Concentration Prediction Models
| Model Type | Specific Models | Mean Absolute Error (MAE) | Root Mean Square Error (RMSE) | Bias | Clinical Accuracy (% within target range) |
|---|---|---|---|---|---|
| Traditional PopPK | Previously published models | 2.79-4.11 mg/L | 3.72-5.33 mg/L | -2.61-0.92 mg/L | Not specified |
| Machine Learning | XGBoost, Gradient-Boosted Decision Trees | 1.53-2.21 mg/L | 2.07-2.98 mg/L | -0.28-0.31 mg/L | Higher |
| Hybrid Approach | PopPK with Bayesian forecasting | 1.98 mg/L | 2.67 mg/L | -0.14 mg/L | Highest |
When externally validated using an independent dataset, machine learning models—particularly XGBoost and gradient-boosted decision trees—demonstrated superior predictive performance compared to traditional popPK models [68]. The best-performing ML model achieved a mean absolute error (MAE) of 1.53 mg/L and root mean square error (RMSE) of 2.07 mg/L, substantially lower than the MAE range of 2.79-4.11 mg/L and RMSE range of 3.72-5.33 mg/L observed with published popPK models [68]. This performance advantage highlights the extrapolation limitations of traditional pharmacokinetic approaches in complex clinical populations where numerous covariates influence drug disposition.
Extrapolation Challenges Across Special Populations
Traditional models frequently struggle when applied to populations not represented in the original development dataset, such as pediatric patients, pregnant women, or those with organ impairment [65]. This limitation stems from their empirical nature, which captures statistical associations rather than mechanistic relationships. Consequently, predictions in these special populations may require substantial additional data collection or result in unacceptable prediction errors that compromise patient safety or treatment efficacy.
Mechanism-Based Modeling as a Solution: PBPK Approaches
Physiologically based pharmacokinetic (PBPK) modeling represents a fundamentally different approach that addresses many structural and extrapolation limitations of traditional models. By incorporating physiological and mechanistic information, PBPK models enhance predictive capability across diverse conditions and populations.
Principles and Applications of PBPK Modeling
PBPK modeling utilizes a "bottom-up" approach that integrates drug-specific properties (molecular weight, lipophilicity, protein binding) with system-specific physiological parameters (organ volumes, blood flows, enzyme abundances) [48]. This mechanistic foundation enables more reliable extrapolation to special populations, including pediatrics, geriatrics, and patients with organ impairment [65]. The approach employs differential equations to simulate drug concentration-time profiles in various tissues based on actual physiology, contrasting with the abstract compartments of traditional models [48].
PBPK modeling has gained significant traction in regulatory submissions, with the U.S. Food and Drug Administration's Center for Biologics Evaluation and Research (CBER) reporting 26 regulatory submissions and interactions involving PBPK modeling from 2018-2024 [5]. These submissions supported applications for 18 products, including gene therapies, plasma-derived products, and vaccines, with the majority aiming to optimize dosing in early development or special populations [5].
Case Study: PBPK for Pediatric Dose Selection
A compelling example of PBPK modeling addressing extrapolation challenges comes from the development of ALTUVIIIO, a recombinant Factor VIII product for hemophilia A [5]. Traditional approaches would have required extensive clinical trials in pediatric populations to establish appropriate dosing. Instead, researchers developed a minimal PBPK model incorporating FcRn recycling pathways—a key mechanism influencing the drug's half-life [5].
The model was initially developed and validated using clinical data from ELOCTATE, another Fc-containing Factor VIII product, achieving prediction errors within ±25% for key exposure parameters (Cmax and AUC) in both adults and children [5]. This validated model subsequently supported pediatric dose selection for ALTUVIIIO, demonstrating how mechanism-based approaches can extrapolate knowledge across compounds and populations while reducing the need for extensive clinical testing [5].
Diagram 1: PBPK Modeling Workflow and Applications. This mechanism-based approach integrates drug properties, system physiology, and in vitro data to support predictions across diverse clinical scenarios.
Experimental Protocols and Methodologies
Protocol: Developing a PBPK Model for Special Populations
The construction and validation of a PBPK model for special populations involves a systematic, multi-stage process [48]:
Model Structure Definition: Identify relevant anatomical compartments (e.g., liver, kidneys, gut, brain) based on the drug's disposition characteristics and target tissues. Incorporate appropriate physiological parameters for each compartment, including tissue volumes, blood flow rates, and tissue composition.
Parameter Estimation: Collect drug-specific parameters including molecular weight, lipophilicity (LogP), pKa values, permeability, and plasma protein binding. Incorporate in vitro data on metabolic clearance and transporter interactions. Estimate tissue-plasma partition coefficients using established methods.
Model Calibration: Use available in vivo pharmacokinetic data to refine model parameters. Compare simulated concentration-time profiles with observed data. Adjust sensitive parameters within physiologically plausible ranges to improve model performance.
Model Validation: Evaluate model performance using independent datasets not used during model development. Assess predictive accuracy through metrics like prediction error, root mean square error, and visual predictive checks.
Application to Special Populations: Modify system parameters to reflect population-specific physiology (e.g., organ sizes, blood flows, enzyme maturation). Simulate pharmacokinetics under various dosing regimens to support dose selection.
This protocol was successfully applied in the development of ALTUVIIIO, where a PBPK model incorporating FcRn-mediated recycling pathways supported pediatric dose selection based on maintaining target Factor VIII activity levels [5].
Protocol: Comparing Traditional versus Flexible Survival Models
Research comparing survival extrapolation approaches typically follows a structured methodology [71]:
Data Acquisition and Reconstruction: Extract individual patient data from published Kaplan-Meier curves using specialized software (e.g., GetData Graph Digitizer). Apply reconstruction algorithms (e.g., Guyot's method) to approximate time-to-event data.
Model Fitting: Fit both standard parametric models (exponential, Weibull, Gompertz, log-normal, log-logistic) and flexible models (fractional polynomials, restricted cubic splines, Royston-Parmar models, generalized additive models, mixture cure models) to the reconstructed data.
Goodness-of-Fit Assessment: Evaluate model performance using information criteria (AIC), mean squared error, and bias relative to the observed data. Conduct visual inspection of fitted versus observed survival curves.
Extrapolation Performance: Project survival beyond the observed follow-up period. Compare extrapolated results with mature data (when available) to assess long-term prediction accuracy.
Impact Analysis: Evaluate the consequences of model selection on clinical and economic outcomes, such as projected life-years gained or incremental cost-effectiveness ratios.
This methodology revealed that flexible survival models outperformed standard parametric approaches, particularly when modeling the complex hazard functions associated with cancer immunotherapies [71].
Table 3: Key Software and Computational Tools for Advanced Pharmacokinetic Modeling
| Tool Category | Specific Tools | Primary Applications | Key Features | Access Type |
|---|---|---|---|---|
| PBPK Platforms | Simcyp, GastroPlus, PK-Sim | PBPK modeling, DDI prediction, special populations | Built-in physiological libraries, IVIVE capabilities, population generators | Commercial, Open Source |
| Statistical Analysis | R, Python with scikit-learn | Survival analysis, machine learning, model validation | Extensive statistical packages, flexible modeling capabilities | Open Source |
| Machine Learning | XGBoost, Random Forest, GBM | Concentration prediction, pattern recognition | Handling of complex nonlinear relationships, robust performance | Open Source |
| Survival Analysis | R with survHE, flexsurv | Flexible survival modeling, extrapolation | Implementation of standard and flexible parametric models | Open Source |
| Data Extraction | GetData Graph Digitizer | Reconstruction of individual patient data | Digitization of published survival curves | Commercial |
Integration of Machine Learning and Artificial Intelligence
Emerging approaches combine mechanistic modeling with machine learning to address limitations of traditional techniques. Machine learning shows particular promise for enhancing parameter estimation, quantifying uncertainty, and identifying patterns in complex pharmacological data [25].
Machine Learning in PBPK Modeling
Machine learning techniques can address several key challenges in PBPK modeling [25]:
Parameter Estimation: ML algorithms can optimize parameter values by efficiently exploring high-dimensional spaces and identifying parameter combinations that best fit observed data.
Uncertainty Quantification: AI-powered approaches provide more reliable estimates of prediction uncertainty, enhancing decision-making in drug development.
Data Integration: ML facilitates incorporation of diverse data types (in vitro, preclinical, clinical) to inform model parameters and reduce uncertainty.
The integration of ML with PBPK modeling is particularly valuable for addressing the "curse of dimensionality" that arises when modeling complex biological systems with numerous parameters [25]. These hybrid approaches leverage the mechanistic understanding embedded in PBPK models while utilizing ML's pattern recognition capabilities to refine predictions and quantify uncertainty.
Diagram 2: Integration of Machine Learning with PBPK Modeling. This hybrid approach leverages both mechanistic understanding and data-driven pattern recognition to enhance predictive performance.
Traditional modeling approaches in pharmacokinetics and toxicology contain fundamental limitations that can compromise their reliability for critical research and regulatory decisions. Structural uncertainty, particularly evident in survival analysis for novel therapies, and limited extrapolation power across diverse populations represent significant vulnerabilities that researchers must acknowledge and address.
Mechanism-based approaches like PBPK modeling offer a promising alternative by incorporating physiological and biological knowledge into their structure, thereby enhancing extrapolation capability and reducing dependence on empirical assumptions. Similarly, flexible modeling techniques and machine learning methods demonstrate superior performance in capturing complex, non-linear relationships inherent in pharmacological data.
As the field continues to evolve, researchers should carefully consider these limitations when selecting modeling approaches, particularly for applications involving novel therapeutic modalities, special populations, or long-term projections. The integration of mechanistic modeling with advanced computational techniques represents a promising direction for addressing the pitfalls that have long challenged traditional modeling paradigms in drug development.
Mathematical models are indispensable in drug development for understanding the relationship between drug concentration and time. Traditional pharmacokinetic (PK) models are often built using empirical, compartment-based approaches. A classical PK model typically has a central compartment representing plasma, linked to one or two peripheral compartments via rate constants; these model parameters generally lack direct physiological meaning [67]. In contrast, mechanism-based PK models, including physiologically based pharmacokinetic (PBPK) models, are parameterized using known physiology. They consist of multiple compartments corresponding to specific organs or tissues in the body, connected by flow rates that mirror the circulating blood system [67]. This fundamental difference in structure leads to a critical trade-off: traditional models offer computational simplicity but limited physiological insight, while mechanism-based models provide biological fidelity at the cost of increased complexity. The resulting challenges—computational intensity and parameter identifiability—form the central focus of comparison in this guide for researchers and drug development professionals.
Computational Intensity: A Price for Mechanistic Detail
Direct Comparison of Resource Demands
Mechanism-based models demand significantly greater computational resources than their traditional counterparts. The table below summarizes the core differences contributing to this disparity.
Table 1: Comparative Analysis of Computational Demands
| Feature | Traditional PK Models | Mechanism-Based Models (PBPK, Systems Pharmacology) |
|---|---|---|
| Model Structure | 1-3 compartmental models [67] | Multi-compartment (10+ organs/tissues) [67] |
| Mathematical Foundation | Linear or simple nonlinear ODEs [67] | Complex systems of nonlinear ODEs and/or PDEs [72] [73] |
| Parameter Source | Data-driven curve fitting [59] | Physiology, in vitro data (IVIVE), system biology [59] [67] |
| Primary Computational Load | Parameter estimation | System simulation and numerical integration |
| Typical Execution | Standard desktop computers | Often requires high-performance computing (HPC) clusters [74] |
Case Studies in Computational Burden
The computational burden of mechanism-based models manifests across various applications. In cardiac electrophysiology, biophysically detailed models of atrial cells that simulate ionic currents and calcium cycling are computationally expensive, often requiring execution on high-performance computer clusters for whole-organ simulations [74]. The shift towards phenomenological models (e.g., the atrial Bueno-Orovio–Cherry–Fenton or Mitchel-Schaeffer models) represents an effort to balance computational cost with predictive accuracy, as their simplified formulations allow for faster computation while still capturing key emergent behaviors [74].
Similarly, in systems biology and pharmacology, numerically simulating the ordinary differential equations (ODEs) describing biological processes is time-consuming. A recent study demonstrated that using Recurrent Neural Networks (RNNs) with Long Short-Term Memory (LSTM) layers to emulate a mechanistic PK-PD model for opioid-induced respiratory depression achieved a massive acceleration in computational speed, effectively bypassing the need to solve the underlying ODEs numerically [75]. This "emulation" approach trades the native model's interpretability for efficiency, highlighting the inherent computational cost of fully mechanistic simulation.
Parameter Identifiability: Ensuring Model Reliability
Defining and Comparing Identifiability Challenges
Parameter identifiability is a fundamental property determining whether the parameters of a proposed model can be uniquely determined from the available data [76]. This challenge is profoundly different in scale and nature between traditional and mechanism-based models.
Table 2: Identifiability Challenges Across Modeling Paradigms
| Aspect | Traditional PK Models | Mechanism-Based Models |
|---|---|---|
| Nature of Problem | Often simpler, well-characterized (e.g., F/V unidentifiability in oral dosing) [77] |
Complex, arising from interconnected biological pathways and numerous parameters [76] |
| Primary Challenge | Practical identifiability (data quality/quantity) | Both structural (model form) and practical identifiability [77] |
| Common Causes | Over-parameterization relative to data [78] | High parameter correlation, insufficient system perturbation data [76] |
| Example | Cannot estimate both metabolite volume (V_m) and conversion fraction (f_m) without additional assumptions [78] |
In a quasi-steady state receptor binding approximation, individual on (K_on) and off (K_off) rates cannot be uniquely identified [77] |
Structural identifiability is a theoretical property of the model itself. A model is structurally identifiable if, ideally, two different parameter vectors lead to two different model outputs [76]. Practical identifiability, in contrast, relates to the quality and quantity of the experimental data available for model calibration [77]. A model can be structurally identifiable yet practically unidentifiable if the data is too noisy or lacks informative content.
Methodologies for Assessing and Resolving Identifiability
Robust methodologies exist to diagnose and address identifiability issues. A comparison of four key methods highlights different strategic approaches:
Table 3: Comparison of Parameter Identifiability Analysis Methods
| Method | Global or Local | Indicator Type | Key Feature |
|---|---|---|---|
| DAISY (Differential Algebra for Identifiability of SYstems) | Both | Categorical | Provides an exact, symbolic answer for global identifiability [76] |
| SMM (Sensitivity Matrix Method) | Local | Both (Categorical & Continuous) | Analyzes the sensitivity of outputs to parameter changes [76] |
| Aliasing | Local | Continuous | Characterizes parameter similarity via derivative profiles [76] |
| FIMM (Fisher Information Matrix Method) | Local | Both (Categorical & Continuous) | Can handle mixed-effects (population) models; provides clear, useful answers [76] |
A recommended workflow involves performing identifiability analysis at the start of model development to check if a proposed model is theoretically viable, and again after parameter estimation to ascertain the quality of the fit [76]. Solutions to unidentifiability include: fixing a parameter to a known value from the literature, re-parameterizing the model to reduce the number of parameters, or redesigning the experiment to collect more informative data [78] [77].
Experimental Protocols and Data
Protocol for a Benchmarking Study
To objectively compare the performance of traditional and mechanism-based models, a robust experimental protocol is essential. The following methodology, inspired by a study comparing model predictions for tumor cell growth, can be adapted for various PK/PD applications [73].
1. System and Data Collection:
- Biological System: Select a relevant in vitro or in vivo system (e.g., cell line, animal model).
- Intervention: Apply a pharmacological intervention (e.g., a drug and/or an inhibitor).
- Data Acquisition: Collect high-quality, time-resolved data on both the drug's pharmacokinetics (e.g., plasma concentrations) and its pharmacodynamic effects (e.g., a biomarker response, cell growth). Include multiple doses and sampling time points to ensure data richness [73].
2. Model Development and Calibration:
- Traditional Model: Develop a classical PK/PD model, such as an effect compartment model linked to an Emax model [77].
- Mechanism-Based Model: Develop a systems pharmacology or PBPK/PD model that incorporates known physiology and the drug's mechanism of action (e.g., receptor binding, signal transduction) [79] [67].
- Calibration: Split the collected data into training and validation sets. Calibrate both models against the same training dataset.
3. Model Performance Assessment:
- Prediction Accuracy: Use the validation data to test each model's predictive capability. Quantify accuracy using metrics like the coefficient of determination (R²) or root mean square error (RMSE) [73].
- Computational Cost: Record the time and computational resources (e.g., CPU hours, memory usage) required for model calibration and simulation.
- Identifiability Analysis: Perform an identifiability analysis (e.g., using the FIMM or profile likelihood method) on both calibrated models to assess parameter uncertainty [76] [77].
Exemplary Data from Comparative Studies
A study on predicting breast cancer cell growth in response to a glucose transport inhibitor provides quantitative data for such a comparison. The predictive accuracy was measured using R² [73]:
- Random Forest (Machine Learning): R² = 0.92
- Decision Tree (Machine Learning): R² = 0.89
- Mechanism-Based Model: R² = 0.77
- Linear Regression: R² = 0.69
This data shows that the mechanism-based model offered a predictive capability comparable to, though slightly less accurate than, advanced machine learning models, with the added benefit of biological interpretability. The computational cost for the mechanism-based model, however, would be significantly higher than for the traditional linear regression model.
Visualization of Modeling Workflows and Challenges
Model Structure and Data Flow
The following diagram illustrates the fundamental structural and data flow differences between traditional and mechanism-based modeling approaches, highlighting the sources of their respective challenges.
Diagram 1: Structural comparison of modeling workflows.
Identifiability Analysis Workflow
A systematic approach to identifiability analysis is crucial for developing credible mechanism-based models. The workflow below outlines the key steps and decision points.
Diagram 2: Identifiability analysis and model refinement workflow.
The Scientist's Toolkit: Research Reagent Solutions
The following table details key software and computational tools essential for developing and testing mechanism-based models, addressing the specific challenges discussed.
Table 4: Essential Research Tools for Mechanism-Based Modeling
| Tool Name | Type/Category | Primary Function in Research |
|---|---|---|
| Simcyp Simulator | PBPK/PD Platform | Integrates physiology, genetics, and in vitro data to simulate drug disposition and interaction in virtual populations [67]. |
| GastroPlus | PBPK/PD Platform | Models absorption, pharmacokinetics, and pharmacodynamics, leveraging IVIVE for prediction [67]. |
| PK-Sim | PBPK/PD Platform | Provides a whole-body PBPK modeling environment for research and drug development [67]. |
| R / MATLAB | Programming Environment | Flexible platforms for implementing custom models, performing parameter estimation, and conducting identifiability analyses (e.g., using packages for SMM, FIMM) [76] [73]. |
| DAISY Software | Identifiability Tool | Performs structural identifiability analysis for systems of rational ordinary differential equations [76]. |
| High-Performance Computing (HPC) Cluster | Computational Infrastructure | Essential for executing complex, multi-scale models (e.g., whole-atria simulations) within feasible timeframes [74]. |
The choice between traditional and mechanism-based modeling is not a simple binary decision but a strategic one, dictated by the research question and available resources. Traditional PK/PD models remain powerful tools for describing data, summarizing pharmacokinetic parameters, and guiding dosage adjustments in later-stage clinical development where empirical accuracy is paramount. However, mechanism-based models are unparalleled in their ability to integrate diverse data, elucidate underlying biology, and extrapolate to untested clinical scenarios—such as different disease states, drug-drug interactions, or patient populations—thereby de-risking drug development [59] [67]. The challenges of computational intensity and parameter identifiability are real but manageable. Through the adoption of robust workflows, advanced analytical methods, and powerful computational tools, researchers can leverage the full potential of mechanism-based modeling to gain deeper insights and make more reliable predictions in pharmacology and drug development.
In modern drug development, the optimization of workflow is paramount for enhancing efficiency, reducing costs, and accelerating the delivery of new therapies. Central to this optimization are specialized Contract Research Organizations (CROs) and sophisticated software tools that support model-informed drug development (MIDD). The field of pharmacokinetic (PK) modeling is characterized by a fundamental dichotomy between traditional, empirical approaches and modern, mechanism-based methodologies. Traditional compartmental PK modeling often employs a "top-down" strategy, using experimental data to characterize drug behavior without explicit physiological context [48]. In contrast, Physiologically-Based Pharmacokinetic (PBPK) modeling adopts a "bottom-up" approach, integrating drug-specific properties with species-specific physiological parameters to predict drug disposition in various tissues and organs [5] [48]. This guide provides a comprehensive comparison of these approaches, their supporting software platforms, and experimental evidence to inform researchers and drug development professionals in their strategic workflow decisions.
Comparative Analysis of Modeling Approaches
Fundamental Differences Between Traditional and Mechanism-Based PK Modeling
Table 1: Comparison of Traditional Compartmental PK and PBPK Modeling Approaches
| Feature | Traditional Compartmental PK | Mechanism-Based PBPK |
|---|---|---|
| Core Approach | Top-down, empirical [48] | Bottom-up, mechanistic [48] |
| Compartments | Abstract, not tied to physiology [48] | Anatomically realistic (liver, kidney, gut, etc.) [48] |
| Parameter Source | Fitted from in vivo data [48] | Integrated from in vitro and physiological data [5] [48] |
| Predictive Capability | Limited to studied conditions | High for untested scenarios (DDIs, special populations) [5] [48] |
| Regulatory Acceptance | Well-established for efficacy | Growing for specific applications (e.g., DDIs, pediatrics) [5] [80] |
| Typical Software | NONMEM, Phoenix WinNonlin [8] | Simcyp, GastroPlus, PK-Sim [80] [48] |
The Emerging "Middle-Out" Workflow
In practice, a pure "bottom-up" PBPK prediction may not always perfectly fit observed clinical data due to scientific knowledge gaps. Consequently, a "middle-out" approach, which integrates both "bottom-up" and "top-down" methodologies, is frequently employed in PBPK analysis [48]. This hybrid strategy uses prior knowledge to build the initial model structure and then refines it by calibrating key parameters against observed clinical data, thereby enhancing its predictive accuracy for subsequent simulations.
Experimental Data and Model Performance
Case Study: PBPK for Pediatric Dose Selection of a Novel Therapy
A compelling case study involves the application of a minimal PBPK model to support the dose selection of ALTUVIIIO, a recombinant Factor VIII therapy for hemophilia A, in pediatric patients under 12 years of age [5]. The model leveraged knowledge from a similar drug, ELOCTATE, to simulate the FcRn recycling pathway and predict PK parameters in children. The PBPK model's predictions for both adult and pediatric Cmax and AUC values demonstrated high accuracy, with prediction errors within ±25%, a commonly accepted benchmark for model validation [5].
Table 2: Performance of a PBPK Model in Predicting Adult and Pediatric PK Parameters [5]
| Population | Age (years) | Drug | Dose (IU/kg) | Cmax (ng/mL) | AUC (ng.h/mL) | ||
|---|---|---|---|---|---|---|---|
| Adult | 23-61 | ELOCTATE | 25 | 140 | 105 (-25%) | 3,009 | 2,671 (-11%) |
| Adult | 19-63 | ALTUVIIIO | 25 | 282 | 288 (+2%) | 14,950 | 13,726 (-8%) |
Performance Metrics in Pharmacometric Workflows
Evaluating the performance of PopPK and PBPK models is critical. When assessing models for clinical dose forecasting, it is essential to evaluate their forecasting accuracy—how well they predict future drug levels—rather than just their fit to historical data [10]. Key metrics include:
- Bias (Mean Percentage Error - MPE): Measures whether predictions systematically under- or overshoot observed data.
- Accuracy: A more critical metric, often defined as the percentage of future predictions within an acceptable range (e.g., within 15%) of the true value. The root-mean-squared error (RMSE) is also a common measure of accuracy [10].
Essential Software Tools and Research Reagents
The effective application of PK/PD modeling relies on a suite of specialized software tools. These platforms function as the essential "research reagents" for model-informed drug development.
Table 3: Key Software Tools for Pharmacokinetic Modeling and Simulation
| Software Tool | Developer/Access | Primary Function | Key Features |
|---|---|---|---|
| Simcyp Simulator | Certara | PBPK Modeling & Simulation | Leading platform for predicting DDIs, pediatric PK, and special populations; qualified by EMA for regulatory submissions [80] [48]. |
| Phoenix WinNonlin | Certara | PK/PD & NCA Analysis | Industry standard for non-compartmental analysis (NCA) and compartmental PK/PD modeling; used by >75 top pharma companies [80] [48]. |
| GastroPlus | Simulation Plus | PBPK & Biopharmaceutics | Specializes in modeling oral absorption and formulation performance using physiology-based biopharmaceutics modeling [48]. |
| NONMEM | ICON PLC | Population PK/PD (NLME) | Gold-standard software for nonlinear mixed-effects (NLME) modeling, widely used for PopPK analysis [8]. |
| PK-Sim | Open Systems Pharmacology | Whole-Body PBPK | Open-source platform for whole-body PBPK modeling across different species [48]. |
Detailed Experimental Protocol: Automated PopPK Model Development
Recent advances aim to automate the traditionally labor-intensive process of PopPK model development. The following protocol, adapted from a study using the pyDarvin library, outlines a standardized workflow for automated PopPK model building [8].
Automated Structure Search Workflow
Methodology Details:
- Model Search Space: A generic search space of >12,000 unique PopPK model structures for drugs with extravascular administration was defined. This space includes variations in the number of compartments, absorption models, and elimination mechanisms [8].
- Penalty Function: A two-term penalty function was developed to automate model selection:
- An Akaike Information Criterion (AIC) penalty to prevent over-parameterization.
- A novel term to penalize abnormal parameter values (e.g., high relative standard errors, implausible inter-subject variability), mimicking an expert modeler's judgment [8].
- Optimization Algorithm: The search employed Bayesian optimization with a random forest surrogate combined with an exhaustive local search to efficiently navigate the vast model space and avoid local minima [8].
Performance Outcome: This automated approach reliably identified model structures comparable to manually developed expert models while evaluating fewer than 2.6% of the models in the search space, significantly reducing development time from weeks to less than 48 hours on average [8].
The integration of advanced software tools and, where needed, the expertise of specialized CROs, is transforming the workflow in pharmacokinetics and drug development. The choice between traditional compartmental modeling and mechanism-based PBPK modeling is not merely philosophical; it has direct implications for predictive power, regulatory strategy, and resource allocation. As evidenced by the case studies and experimental data, PBPK modeling offers a powerful, mechanistic framework for predicting drug behavior in untested scenarios, such as in pediatric populations or due to drug-drug interactions. Concurrently, automation in PopPK demonstrates the potential for artificial intelligence to enhance reproducibility, reduce manual effort, and accelerate timelines. A strategic, integrated approach that leverages the strengths of each methodology—as well as the sophisticated software platforms that enable them—is key to optimizing workflow and successfully navigating the complexities of modern drug development.
The field of pharmacokinetics is undergoing a transformative shift from traditional, experience-driven modeling approaches to sophisticated, mechanism-based frameworks augmented by artificial intelligence (AI) and machine learning (ML). Traditional pharmacokinetic modeling, including population pharmacokinetic (popPK) methods, often relies on a "top-down" approach that fits models to observed data with considerable manual effort and sequential model building [48] [8]. In contrast, mechanism-based physiologically based pharmacokinetic (PBPK) modeling adopts a "bottom-up" approach, integrating drug-specific properties with physiological parameters to simulate drug behavior throughout the body [48]. The emerging paradigm leverages AI/ML to overcome limitations in both approaches, enabling more predictive, efficient, and comprehensive drug development strategies. This guide examines the performance comparison between traditional and AI-enhanced mechanism-based modeling, providing experimental data and methodologies that demonstrate how these computational aids are reshaping pharmacokinetic research.
Comparative Analysis: Traditional vs. AI-Enhanced Modeling Approaches
Table 1: Performance Comparison of Traditional, Mechanism-Based, and AI-Enhanced Modeling Approaches
| Modeling Characteristic | Traditional PopPK | Mechanism-Based PBPK | AI-Enhanced Modeling |
|---|---|---|---|
| Development Timeline | Weeks to months [8] | Months for full validation [48] | <48 hours for automated popPK [8] |
| Parameter Space Evaluation | Limited by manual search [8] | Comprehensive but parameter-heavy [25] | Evaluates >12K models efficiently [8] |
| Data Requirements | Relies on clinical PK data [48] | Integrates in vitro and physiological data [41] | Handles diverse data types including real-world evidence [25] |
| Predictive Accuracy | Good for interpolations | 78% within 3-fold of in vivo data [41] | Matches or exceeds manual model performance [8] |
| Special Population Predictions | Extrapolation limited | Virtual population simulations [5] | Enhanced covariate detection [8] |
| Regulatory Acceptance | Well-established | Growing acceptance in submissions [5] | Emerging with demonstrated validation |
Experimental Evidence: AI/ML Implementation in Pharmacokinetics
Automated Population PK Modeling
Experimental Protocol: A recent study evaluated an automated approach for popPK model development using the pyDarwin framework [8]. The methodology employed:
- Model Search Space: Defined a generic parameter space containing >12,000 unique popPK model structures for extravascular drugs
- Optimization Algorithm: Implemented Bayesian optimization with random forest surrogate combined with exhaustive local search
- Penalty Function: Developed a dual-component penalty to prevent overparameterization (Akaike criterion) and penalize biologically implausible parameters
- Validation: Tested on one synthetic and four clinical datasets including both small molecules and monoclonal antibodies
- Performance Metrics: Compared results against manually developed expert models for accuracy and development efficiency
Results: The automated approach identified model structures comparable to manually developed expert models while evaluating fewer than 2.6% of models in the search space [8]. For the synthetic ribociclib dataset, the method correctly identified the exact true data-generation model. Across all clinical datasets, the automated system achieved comparable structures to manual development with a mean development time of less than 48 hours in a 40-CPU environment, significantly reducing the typical weeks-long manual process.
PBPK Model Enhancement with Machine Learning
Experimental Protocol: Research into ML-augmented PBPK modeling has demonstrated multiple applications for enhancing mechanism-based predictions [25] [29]:
- Parameter Estimation: ML algorithms estimate critical PBPK parameters where experimental data is limited
- Uncertainty Quantification: Gaussian process regression and Bayesian methods quantify parameter uncertainty
- Feature Selection: Recursive feature elimination identifies most influential parameters
- Model Reduction: AI techniques guide simplification of complex PBPK models while maintaining predictive capability
- Validation: Cross-validation against clinical data and comparison with traditional PBPK predictions
Results: Studies demonstrate that ML-enhanced PBPK modeling can address key limitations in traditional mechanism-based approaches, particularly in handling large parameter spaces and quantifying uncertainty [25] [29]. For developmental neurotoxicity assessment, PBPK models achieved administered equivalent dose predictions within three-fold of in vivo effect levels for 78% of chemicals [41]. ML integration has shown particular promise in optimizing parameter estimation for complex biological processes, such as FcRn-mediated recycling of therapeutic antibodies, where traditional parameterization approaches face challenges due to limited measurable data [25] [29].
Visualization of AI-Enhanced Pharmacokinetic Workflows
Traditional vs. Automated PopPK Development
ML-Augmented PBPK Modeling Framework
The Scientist's Toolkit: Essential Research Reagents and Solutions
Table 2: Key Research Reagent Solutions for AI-Enhanced Pharmacokinetic Modeling
| Tool/Category | Specific Examples | Function in Research | Application Context |
|---|---|---|---|
| PBPK Software Platforms | GastroPlus, Simcyp, PK-Sim | Mechanistic PK simulation integrating physiological parameters | Prediction of human PK from preclinical data, DDI assessment [48] |
| Population PK Software | NONMEM, Monolix Suite | NLME modeling for population analysis | Covariate effect identification, dose optimization [48] [8] |
| ML Optimization Frameworks | pyDarwin, Bayesian optimization libraries | Automated model structure identification | Efficient search of popPK parameter space [8] |
| Data Preprocessing Tools | SMOTE, IQR outlier detection | Handling imbalanced datasets and noise | Improved model training on real-world clinical data [81] |
| Feature Selection Algorithms | Recursive Feature Elimination (RFE), Median Absolute Deviation (MAD) | Identification of critical model parameters | Dimensionality reduction for enhanced interpretability [81] |
| Validation Metrics Suite | AIC, relative standard error, shrinkage calculation | Model qualification and biological plausibility | Preventing overparameterization in automated workflows [8] |
The comparative analysis demonstrates that AI and machine learning are emerging as indispensable aids that enhance both traditional and mechanism-based pharmacokinetic modeling approaches. Rather than replacing established methods, AI/ML integration addresses specific limitations: automating labor-intensive popPK development, enhancing parameter estimation for PBPK models, and enabling more comprehensive exploration of complex parameter spaces. The experimental evidence confirms that these automated approaches can match or exceed manually developed models while significantly reducing development timelines from weeks to days [8]. As the field progresses, the synergy between mechanistic understanding and AI-driven optimization promises to accelerate drug development, improve predictive accuracy across diverse populations, and ultimately enhance the efficiency of delivering new therapies to patients. The emerging aids of machine learning and artificial intelligence are thus transforming pharmacokinetics from an artisanal modeling endeavor to a systematically optimized scientific discipline.
Evidence and Outlook: Validating Performance and Comparing Impact on Drug Development
In the field of pharmacokinetics (PK) and pharmacodynamics (PD), two distinct modeling paradigms have emerged: traditional empirical models and mechanism-based models. Traditional PK/PD modeling often employs a "top-down" approach, seeking parsimonious models that describe observed data with strong statistical reliability, where parameters relate to underlying processes such as the production or clearance of endogenous substances [82]. These models have formed the backbone of pharmacometric analysis for decades, providing valuable insights into drug behavior in various populations.
In contrast, mechanism-based PK/PD modeling represents a shift toward more biologically driven "bottom-up" approaches. These models contain specific expressions to characterize processes on the causal path between drug administration and effect, incorporating greater physiological and biological detail [4]. Mechanism-based models have much-improved properties for extrapolation and prediction, making them particularly valuable for rational drug discovery and development. The fundamental distinction between these paradigms necessitates different approaches to model validation, as the criteria for "success" differ based on the model's intended purpose and underlying structure.
Traditional PK/PD Model Validation
Core Validation Techniques
Traditional pharmacokinetic model validation employs a robust set of techniques to ensure model reliability and predictive performance. For population PK models, the validation process focuses on ensuring the model adequately describes the observed data and reliably predicts drug exposure in the target patient population [83].
Key validation methods include:
- Goodness-of-Fit Plots: Visual assessment of how well model predictions match observed data, including observations versus population predictions, observations versus individual predictions, and conditional weighted residuals versus time or predictions [3].
- Bootstrap Analysis: A resampling technique that evaluates model stability by estimating parameter confidence intervals and assessing potential bias in parameter estimates [83].
- Visual Predictive Check (VPC): A graphical method comparing simulated data from the final model with the original observed data to evaluate how well the model captures the central trend and variability in the data [84].
- Normalized Prediction Distribution Errors (NPDE): A quantitative method for evaluating model performance by analyzing the distribution of prediction errors [83].
Model Selection Criteria
Model selection in traditional approaches relies heavily on statistical criteria that balance model fit with complexity:
- Objective Function Value (OFV): The minimum OFV determined via parameter estimation is fundamental for comparing and ranking models [3].
- Akaike Information Criterion (AIC): Compensates for improvements of fit due to increased model complexity using the formula: AIC = OBJ + 2 × np, where np is the total number of parameters [3].
- Bayesian Information Criterion (BIC): Penalizes the OFV for model complexity more than AIC, calculated as: BIC = OBJ + np × ln(N), where N is the number of data observations [3].
- Likelihood Ratio Test (LRT): Used to compare nested models (where one model is a subset of another) and assigns a probability to the hypothesis that they provide the same description of the data [3].
Statistical comparisons using these criteria must be interpreted with caution. As Kass and Raftery categorized, differences in BIC between models of >10 provide "very strong" evidence in favor of the model with the lower BIC; 6–10 indicates "strong" evidence; 2–6 represents "positive" evidence; and 0–2 suggests "weak" evidence [3].
Mechanism-Based PK/PD Model Validation
Advanced Validation Frameworks
Mechanism-based models, including Physiologically Based Pharmacokinetic (PBPK) models, require more sophisticated validation approaches that assess both statistical performance and biological plausibility. The U.S. Food and Drug Administration has developed a risk-based credibility assessment framework for PBPK models that establishes standards for model evaluation [5].
Critical validation components for mechanism-based models include:
- Verification of Physiological Parameters: Confirming that system-specific parameters (e.g., organ volumes, blood flows, enzyme abundances) accurately represent human physiology [5].
- Drug-Specific Parameter Validation: Ensuring drug-specific parameters (e.g., physicochemical properties, metabolic rates, binding affinities) are accurately determined from in vitro and preclinical studies [85].
- Predictive Performance Assessment: Evaluating how well the model predicts clinical outcomes across different scenarios, including various dosing regimens, patient populations, and drug-drug interactions [2].
Quantitative Assessment Methods
For PBPK models, successful validation is demonstrated when predicted pharmacokinetic parameters fall within acceptable ranges of observed clinical data. A common benchmark is prediction error within ±25% for key exposure metrics such as maximum concentration (Cmax) and area under the curve (AUC) [5]. For example, in the development of ALTUVIIIO, a recombinant FVIII analogue fusion protein, the PBPK model predicted Cmax and AUC values in both adults and children with errors within ±25%, confirming the model's ability to describe the FcRn mediated recycling pathway accurately [5].
The validation of complex mechanism-based models often involves "learn and confirm" cycles, where models are iteratively refined as new data become available. This approach is particularly valuable for biological products such as therapeutic proteins, gene therapies, and cell therapies, where complex mechanisms of action and disposition pathways require sophisticated modeling approaches [5].
Comparative Analysis of Validation Approaches
Side-by-Side Comparison of Validation Techniques
Table 1: Comparison of Validation Methods for Traditional vs. Mechanism-Based PK/PD Models
| Validation Aspect | Traditional PK/PD Models | Mechanism-Based PBPK Models |
|---|---|---|
| Primary Objective | Describe observed data with statistical reliability [82] | Incorporate physiological and biological mechanisms for improved extrapolation [4] |
| Model Selection Criteria | AIC, BIC, Likelihood Ratio Test [3] | Physiological plausibility, predictive performance in untested scenarios [5] |
| Key Diagnostic Tools | Goodness-of-fit plots, bootstrap, VPC [83] | Verification of physiological parameters, drug-specific parameter validation [5] |
| Performance Benchmarks | Statistical significance (p < 0.05), reduction in OFV > 3.84 [3] | Prediction error within ±25% for exposure metrics (AUC, Cmax) [5] |
| Handling of Variability | Statistical distributions for between-subject variability [3] | Incorporation of physiological variability (organ size, blood flow, enzyme levels) [85] |
| Regulatory Acceptance | Well-established in population PK analyses [83] | Emerging framework with risk-based credibility assessment [5] |
Experimental Protocols for Model Validation
Protocol 1: Traditional Model Validation Using Bootstrap and Visual Predictive Check
Bootstrap Analysis:
- Generate 1000 bootstrap samples by resampling from the original dataset with replacement
- Estimate parameters for each bootstrap sample using the same estimation method as the final model
- Calculate median and 95% confidence intervals for all parameters
- Compare original parameter estimates with bootstrap results to assess bias [83]
Visual Predictive Check:
- Simulate 1000 replicates of the original dataset using the final model parameters
- Calculate the 5th, 50th, and 95th percentiles of the simulated data at each time point
- Plot the observed data percentiles over the simulated percentiles
- Evaluate whether the observed data falls within the 95% confidence interval of the simulated data [84]
Protocol 2: PBPK Model Validation for Drug-Drug Interactions
Model Verification:
- Collect system-specific parameters (organ volumes, blood flows) from physiological literature
- Determine drug-specific parameters (log P, pKa, blood-to-plasma ratio) from in vitro assays
- Obtain metabolic parameters (Km, Vmax) from human liver microsome or hepatocyte studies [85]
Predictive Performance Assessment:
- Simulate clinical DDI study with perpetrator drug (inhibitor/inducer) and victim drug
- Compare predicted vs. observed AUC and Cmax ratios using the formula: Prediction Error = (Predicted - Observed)/Observed × 100%
- Apply acceptance criteria of ±25% for AUC and Cmax predictions [2]
- For CYP polymorphism effects, validate against clinical data from different genotypic populations [85]
Research Reagent Solutions for Model Validation
Table 2: Essential Research Reagents and Software Tools for PK/PD Model Validation
| Tool Category | Specific Examples | Function in Validation |
|---|---|---|
| Software Platforms | NONMEM, Monolix, Phoenix NLME [3] | Parameter estimation using nonlinear mixed-effects modeling for traditional PK/PD |
| PBPK Modeling Software | GastroPlus, Simcyp, PK-Sim [85] | Mechanism-based model development and simulation of complex physiological processes |
| Clinical DDI Simulators | Itraconazole, fluconazole, rifampin [2] | Perpetrator drugs for validating PBPK models in drug-drug interaction scenarios |
| Genotyped Populations | CYP2C9 *2, *3 variant alleles [85] | Validation of models incorporating pharmacogenetic polymorphisms |
| Biomarker Assays | Type 0-6 biomarkers per mechanism-based classification [4] | Quantification of processes on causal path between drug administration and effect |
| Precision Dosing Tools | MwPharm++, InsightRX, PrecisePK [84] | Clinical implementation and validation of models in patient care settings |
Visualization of Validation Workflows
Traditional PK/PD Model Validation Workflow
Mechanism-Based PBPK Model Validation Workflow
The validation of pharmacokinetic models requires paradigm-specific approaches that align with the model's purpose and structure. Traditional PK/PD models rely heavily on statistical criteria such as AIC, BIC, and likelihood ratio tests, with diagnostic tools including goodness-of-fit plots, bootstrap analysis, and visual predictive checks. In contrast, mechanism-based PBPK models emphasize physiological plausibility and predictive performance, with quantitative benchmarks such as prediction errors within ±25% for key exposure parameters.
As the field moves toward more complex, mechanism-based models, validation frameworks continue to evolve. The FDA's risk-based credibility assessment for PBPK models represents an important step in standardizing the evaluation of these sophisticated tools. Regardless of the modeling paradigm, successful validation requires rigorous, multifaceted approaches that ensure models are fit for their intended purpose, whether for basic research, drug development, or clinical decision support.
The selection of a pharmacokinetic (PK) modeling approach is a critical decision in drug development, influencing everything from dose selection to clinical trial design. The core of this decision often rests on a model's predictive accuracy—its ability to forecast drug concentrations and effects in patients not included in the original model-building dataset. For researchers, scientists, and drug development professionals, understanding the relative performance of different modeling methodologies is essential for deploying the right tool for the right question. This guide provides an objective, data-driven comparison of the predictive performance of traditional pharmacoeconomic models, population pharmacokinetic (PopPK) models, physiologically-based pharmacokinetic (PBPK) models, and emerging machine learning (ML) approaches. Framed within a broader thesis on mechanism-based versus traditional modeling, the analysis synthesizes recent evidence to guide model selection in research and development.
Methodology of Model Performance Evaluation
To ensure a fair and clinically relevant comparison of predictive accuracy, studies must employ rigorous and standardized evaluation methods. The following protocols represent the current best practices for assessing model performance.
External Validation and Forecasting Analysis
The most stringent test of a model's utility is external validation, where a model developed on one dataset is used to predict outcomes in a completely independent dataset from a different patient cohort. This process tests the model's generalizability beyond its original development context [68]. A key distinction in evaluation is between a model's goodness-of-fit (how well it describes the data used to build it) and its forecasting accuracy (how well it predicts future, unseen observations).
In practice, forecasting accuracy is evaluated using an iterative approach that mimics real-world clinical use. As implemented in model-informed precision dosing (MIPD), this involves:
- Performing a Bayesian fit of the model using one or more initial therapeutic drug monitoring (TDM) samples.
- Using the updated individual model parameters to forecast the next TDM measurement.
- Comparing the forecasted concentration to the actual measured value.
- Repeating this process iteratively, adding each new data point to the fitting process before making the next forecast [10].
This "fit-for-purpose" analysis is considered the gold standard for evaluating models intended for MIPD, as it most closely mirrors clinical application [10].
Key Quantitative Metrics for Predictive Performance
The agreement between model predictions and observed data is quantified using specific statistical metrics, each measuring a different aspect of performance:
- Bias: The average tendency of the model to over- or under-predict observed values. It is commonly measured by the Mean Prediction Error (MPE) or Mean Percentage Error. A value of zero indicates no bias; positive values indicate systematic over-prediction, and negative values indicate under-prediction [10].
- Accuracy: The overall magnitude of the difference between predictions and observations, combining both bias and random error. A common metric is the Root Mean Squared Error (RMSE). Lower RMSE values indicate higher accuracy. Some analyses also report the percentage of predictions that fall within a pre-defined acceptable range (e.g., within 15% of the observed value) [10].
- Precision: Often used interchangeably with accuracy in the PK literature, it typically refers to the random scatter of the prediction errors. The Mean Absolute Prediction Error (MAPE) is frequently used [86] [10].
These metrics should be interpreted together, as a model can have low bias but poor accuracy if its predictions are widely scattered, or high accuracy but significant bias if all predictions are consistently off by a fixed amount.
Quantitative Performance Comparison Across Modeling Paradigms
Direct comparisons from recent literature reveal significant differences in how various modeling approaches perform in predicting clinical outcomes.
Traditional vs. Mechanism-Based Pharmacoeconomic Models
A 2025 comparative analysis of sunitinib therapy in gastrointestinal stromal tumors (GIST) pitted traditional pharmacoeconomic models against a more mechanistic pharmacometric model framework. The results demonstrate that model structure significantly influences cost-utility outcomes.
Table 1: Predictive Performance of Sunitinib Therapy Models [36]
| Model Type | Incremental Cost per QALY (Euros) | Deviation from Pharmacometric Model | Key Performance Findings |
|---|---|---|---|
| Pharmacometric Framework | 142,756 | Reference (0%) | Most accurately captured real-world toxicity trends and drug exposure changes. |
| Traditional - Discrete Markov | Not Specified | -21.2% | Excessive forecasting of patients with subtherapeutic drug concentrations. |
| Traditional - Continuous Markov | Not Specified | -15.1% | Excessive forecasting of patients with subtherapeutic drug concentrations. |
| Traditional - TTE Weibull | Not Specified | +7.2% | Excessive forecasting of patients with subtherapeutic drug concentrations. |
| Traditional - TTE Exponential | Not Specified | +39.6% | Excessive forecasting of patients with subtherapeutic drug concentrations. |
The pharmacometric framework was superior in capturing dynamic toxicity patterns, such as the increase in hand-foot syndrome incidence until cycle 4 followed by a decrease—a pattern the traditional models failed to reproduce, instead predicting a stable incidence over all cycles [36].
Performance of Competing PopPK Models
The predictive accuracy of different PopPK models for the same drug can vary substantially, as shown by a study comparing eight published meropenem models in critically ill patients.
Table 2: Performance of PopPK Models for Meropenem in Critically Ill Patients [86]
| Model | Absolute Bias (Mean % Difference) | Absolute Precision (95% Limits of Agreement) | Clinical Impact: Dose Change Required |
|---|---|---|---|
| Muro et al. | +19.9% (+7.3% to +32.7%) | -178.9% to +175.0% | Not Specified |
| Crandon et al. | -1.9% (-16.2% to +12.3%) | Not Specified | Not Specified |
| Doh et al. (with edema) | -10.3% (-23.7% to +3.1%) | Not Specified | Not Specified |
| Leroy et al. | -108.5% (-119.9% to -97.3%) | -249.1% to +31.9% | Not Specified |
| All Models Combined | Range: -108.5% to +19.9% | Range: -249.1% to +175.0% | 44% to 64% of concentrations |
The study concluded that while the overall accuracy supported the use of these models in dosing software, the significant variability in performance and the high rate of required dose adjustments (44-64%) highlight the importance of model selection for precise individualized dosing [86].
PopPK vs. Machine Learning for Voriconazole Dosing
A direct face-off between classical PopPK and modern ML approaches was conducted for predicting voriconazole trough concentrations in critically ill patients. The study developed six ML models and compared them to a published PopPK model via external validation.
Table 3: PopPK vs. Machine Learning for Voriconazole Prediction [68]
| Model Type | Specific Model | Bias (MPE) | Accuracy (RMSE) | Best For |
|---|---|---|---|---|
| PopPK | Li et al. | -0.79 mg/L | 3.86 mg/L | Applications requiring mechanistic interpretation and understanding of covariate effects. |
| Machine Learning | XGBoost | -0.01 mg/L | 3.12 mg/L | Scenarios prioritizing highest predictive accuracy for steady-state concentrations. |
| Machine Learning | Gradient-Boosted Decision Trees | +0.27 mg/L | 3.17 mg/L | Scenarios prioritizing highest predictive accuracy. |
| Machine Learning | Random Forest | -0.18 mg/L | 3.31 mg/L | Scenarios prioritizing highest predictive accuracy. |
The study found that the top three ML models (XGBoost, GBDT, Random Forest) significantly outperformed the traditional PopPK model in predictive performance. However, the PopPK model offered a crucial advantage: mechanistic interpretability. It identified albumin levels and concomitant medication use as significant covariates, providing biological insights that black-box ML models cannot [68].
Visualizing Model Comparison Workflows
The following diagrams illustrate the logical workflows for conducting a model comparison study and for distinguishing between model fitting and forecasting analyses.
Model Comparison and Validation Workflow
Model Comparison Workflow. The process for objectively comparing the predictive accuracy of different pharmacokinetic models, from objective definition to final recommendation.
Model Fitting vs. Forecasting Analysis
Fitting vs. Forecasting. The critical distinction between evaluating a model's fit to historical data and its accuracy in predicting future, unseen data points.
The Scientist's Toolkit: Essential Research Reagents and Solutions
The following table details key resources and methodologies employed in the comparative studies cited in this guide.
Table 4: Essential Research Reagents and Solutions for Model Comparison
| Tool / Solution | Function in Comparative Analysis | Example from Literature |
|---|---|---|
| Dosing Software (e.g., ID-ODS) | Encodes published PopPK models to simulate concentration-time profiles and predict drug exposure for individual patients based on their demographics. | Used to compare 8 meropenem PopPK models by predicting free concentrations [86]. |
| External Validation Dataset | An independent cohort of patients not used for model development; provides the "gold standard" for testing a model's generalizability and real-world predictive power. | A set of 282 voriconazole samples from 177 patients used to evaluate PopPK and ML models [68]. |
| Machine Learning Algorithms (e.g., XGBoost) | Provides an alternative, non-mechanistic approach to predicting drug concentrations by identifying complex patterns in patient data without pre-specified model structures. | XGBoost and GBDT algorithms outperformed a traditional PopPK model for predicting voriconazole trough levels [68]. |
| Pharmacometric Model Framework | A mechanism-based modeling approach that integrates physiological, pharmacological, and disease progression processes to simulate clinical outcomes. | Used as the reference "truth" in the sunitinib cost-utility analysis, outperforming traditional models [36]. |
| Bayesian Forecasting Software | Software platforms that use Bayesian statistics to combine population model priors with individual TDM data to refine parameter estimates and forecast future concentrations. | Core to model-informed precision dosing (MIPD); enables the evaluation of forecasting accuracy as done by InsightRX Nova [10]. |
The evidence from recent comparative analyses leads to several key conclusions for drug development professionals:
- Model Structure is Critical: The choice between traditional (e.g., Markov) and mechanism-based (e.g., pharmacometric, PBPK) models significantly impacts predictive outcomes. Mechanistic models more accurately capture real-world, dynamic trends in toxicity and exposure [36].
- Forecasting Performance is the True Test: For models used in MIPD, predictive performance must be evaluated using forecasting analysis on external datasets, not just goodness-of-fit to the development data. This is the only way to gauge real-world clinical utility [68] [10].
- The Interpretability-Accuracy Trade-Off: A hybrid approach may be optimal. While ML models can offer superior predictive accuracy for specific tasks like concentration prediction, traditional PopPK models provide irreplaceable mechanistic insight into covariate relationships, which is vital for understanding disease and drug behavior [68].
- No One-Size-Fits-All Solution: Model selection must be "fit-for-purpose." PopPK models remain a robust and interpretable choice for many applications, but professionals should consider the emerging potential of ML for pure prediction tasks and the superior biological plausibility of pharmacometric models for long-term and real-world extrapolations [36] [10].
The ongoing integration of methodologies, such as embedding ML components within PBPK frameworks to address parameter uncertainty, represents the next frontier in enhancing predictive accuracy across drug development [25].
In the evolving landscape of oncology drug development and health technology assessment, cost-utility analyses (CUAs) have become indispensable tools for informing reimbursement decisions and resource allocation. These analyses traditionally rely on mathematical models—such as Markov models and time-to-event (TTE) simulations—to predict long-term clinical outcomes and economic impact from limited trial data. However, a paradigm shift is emerging with the introduction of pharmacometric-based pharmacoeconomic models that incorporate more biologically plausible connections between drug exposure, toxicity, and clinical outcomes.
This article provides a head-to-head comparison of these contrasting methodologies using sunitinib as a case study. Sunitinib, a tyrosine kinase inhibitor (TKI) approved for the treatment of gastrointestinal stromal tumors (GIST) and metastatic renal cell carcinoma (mRCC), serves as an ideal candidate for such a comparison due to its narrow therapeutic window, significant pharmacokinetic variability, and substantial economic impact on healthcare systems.
Methodological Frameworks: Traditional vs. Pharmacometric Modeling
Traditional Pharmacoeconomic Models
Traditional pharmacoeconomic modeling approaches for sunitinib have primarily relied on aggregate clinical trial data to project long-term outcomes. The most common structures include:
- Time-to-Event (TTE) Models: These typically use survival distributions (exponential or Weibull) to model time to progression and overall survival, often without direct linkage to drug exposure [87] [88].
- Markov Models: These discrete or continuous state-transition models simulate patient movement between health states (e.g., progression-free, progressed disease, death) based on transition probabilities derived from trial data [88].
- Adverse Event Modeling: Toxicity data (e.g., neutropenia, thrombocytopenia, hypertension, fatigue, hand-foot syndrome) are typically incorporated via logistic regression models that lack temporal dynamics [87].
These traditional frameworks operate largely as "black boxes" regarding the underlying pharmacological mechanisms, focusing instead on statistical correlations between inputs and outcomes.
Pharmacometric-Based Pharmacoeconomic Models
The pharmacometric approach represents a fundamental shift toward mechanism-based modeling that explicitly characterizes the relationship between drug exposure and response. Key components include:
- Pharmacokinetic (PK) Models: These quantify the time course of drug concentrations in the body, incorporating factors like absorption, distribution, metabolism, and excretion [88] [89].
- Pharmacodynamic (PD) Models: These establish quantitative relationships between drug concentrations and their effects (both efficacy and toxicity) [88].
- Integrated PK/PD Framework: This interconnected system models how dose adjustments impact drug concentrations, which in turn influence both therapeutic effects and adverse events [88].
This framework enables continuous simulation of drug exposure, tumor response, and toxicity development over time, allowing for more biologically plausible predictions of real-world outcomes.
Table 1: Core Characteristics of Modeling Approaches
| Characteristic | Traditional Pharmacoeconomic Models | Pharmacometric-Based Models |
|---|---|---|
| Structural Basis | Statistical relationships from aggregate data | Biological mechanisms and pharmacological principles |
| Dose-Response Relationship | Implicit or absent | Explicitly modeled via PK/PD relationships |
| Toxicity Prediction | Stable incidence over treatment cycles [87] | Dynamic change over time (e.g., HFS incidence peaks at cycle 4 then decreases) [87] |
| Handling of Interindividual Variability | Limited incorporation | Integral component via population modeling |
| Therapeutic Drug Monitoring Simulation | Excessive prediction of subtherapeutic concentrations (98.7% by cycle 16) [87] | More realistic prediction of subtherapeutic concentrations (34.1% by cycle 16) [87] |
Head-to-Head Comparative Analysis
Comparative Study Design and Workflow
A recent groundbreaking study directly compared these modeling frameworks using sunitinib in GIST as the test case [87] [88]. The investigation followed a rigorous comparative workflow:
- Dataset Generation: A virtual patient population (N=1000) with metastatic/unresectable GIST was generated using distributions of patient demographics and baseline tumor characteristics from actual clinical trials [88].
- Intervention Simulation: Two study arms were simulated—continuous sunitinib (37.5 mg daily) versus no treatment—over 104 weeks.
- Model Implementation: The pharmacometric framework (representing the "truth") was used to simulate clinical outcomes, including tumor progression, death, and adverse events [88].
- Traditional Model Calibration: Four existing traditional models (TTE exponential, TTE Weibull, discrete Markov, continuous Markov) were re-estimated using the survival data generated by the pharmacometric framework [87].
- Outcome Comparison: All frameworks were used to simulate clinical outcomes and sunitinib treatment costs, including a therapeutic drug monitoring scenario.
The following diagram illustrates the comparative workflow of this analysis:
Quantitative Outcomes and Cost-Utility Predictions
The comparative analysis revealed substantial differences in cost-utility predictions between modeling approaches:
- The pharmacometric model framework predicted that sunitinib treatment costs an additional €142,756 per quality-adjusted life year (QALY) compared with no treatment [87].
- Traditional models showed significant deviations from this baseline: -21.2% (discrete Markov), -15.1% (continuous Markov), +7.2% (TTE Weibull), and +39.6% (TTE exponential) [87].
- The pharmacometric framework captured dynamic changes in toxicity over treatment cycles, such as increased hand-foot syndrome incidence until cycle 4 with a decrease thereafter—a pattern not observed in traditional frameworks, which showed stable HFS incidence over all treatment cycles [87].
- Traditional frameworks excessively forecasted the percentage of patients encountering subtherapeutic concentrations of sunitinib over time (pharmacoeconomic: 24.6% at cycle 2 to 98.7% at cycle 16, versus pharmacometric: 13.7% at cycle 2 to 34.1% at cycle 16) [87].
Table 2: Key Outcome Comparisons Between Modeling Approaches
| Outcome Measure | Pharmacometric Framework | Traditional Frameworks | Clinical Significance |
|---|---|---|---|
| ICER (vs. no treatment) | €142,756 per QALY | Deviations from -21.2% to +39.6% [87] | Reimbursement decisions highly dependent on model selection |
| Toxicity Pattern Accuracy | Dynamic changes aligned with clinical observations (e.g., HFS incidence peaks at cycle 4) [87] | Stable incidence over all treatment cycles [87] | Impacts quality of life adjustments in QALY calculations |
| Subtherapeutic Concentration Prediction | 13.7% (cycle 2) to 34.1% (cycle 16) [87] | 24.6% (cycle 2) to 98.7% (cycle 16) [87] | Affects projected treatment efficacy and duration |
| Therapeutic Drug Monitoring Impact | More realistic simulation of exposure optimization | Overestimation of subtherapeutic concentrations [87] | Influences cost projections for TDM implementation |
Experimental Protocols and Methodologies
Pharmacometric Framework Specification
The pharmacometric-based pharmacoeconomic model framework consisted of multiple interconnected components:
- Adverse Event Models: These included time-course models for hypertension, neutropenia, hand-foot syndrome, fatigue, and thrombocytopenia, developed using nonlinear mixed-effects modeling [88].
- Biomarker Model: A model describing soluble Vascular Endothelial Growth Factor Receptor-3 (sVEGFR-3) concentration as a surrogate for target engagement [88].
- Tumor Growth Model: A system describing tumor size dynamics in response to treatment [88].
- Overall Survival Model: A time-to-event Weibull model linked to tumor size dynamics and other prognostic factors [88].
This integrated framework allowed for continuous simulation of the entire treatment pathway, from drug administration to clinical outcomes, with explicit representation of pharmacological mechanisms.
Dosing Protocol and Therapeutic Drug Monitoring
Both modeling approaches incorporated dose adjustments reflecting real-world clinical practice:
- Dose Reduction Protocol: In cases of unacceptable adverse events, doses could be reduced from 37.5 mg to 25 mg or 12.5 mg daily, based on available tablet sizes [88].
- Toxicity Monitoring: Fatigue and hand-foot syndrome were monitored daily, while neutrophil count was monitored weekly in simulations [88].
- Therapeutic Drug Monitoring: Target exposure ranges were implemented (trough concentrations: 50-100 ng/mL; AUC: 1200-2150 ng/mL·h) with corresponding dose adjustments [89].
Real-World Validation Studies
Complementing the simulation study, real-world investigations have examined sunitinib dosing in clinical practice:
- A retrospective analysis of mRCC patients treated with sunitinib found that 53.8% required empirical dose modifications based on clinical signs [89].
- Model-based therapeutic drug monitoring would have suggested decreasing sunitinib dosing in 61-84% of patients (depending on the target exposure metric), compared to 46.2% with clinical decisions alone [89].
- Early treatment-related toxicities could have been partly avoided using prospective PK/PD modeling with adaptive dosing, as 41% of patients required empirical dose reduction due to early-onset severe toxicities, while model-based recommendations would have immediately proposed dose reduction in more than 80% of these patients [89].
Sunitinib's Clinical and Economic Context
Therapeutic Landscape
Sunitinib's clinical and economic profile must be understood within its therapeutic context:
- In GIST, sunitinib is used after imatinib failure, demonstrating significant improvement in median time to tumor progression (27.3 weeks vs. 6.4 weeks with placebo) [90].
- In mRCC, sunitinib has been a first-line standard, though recent years have seen the introduction of multiple immunotherapy combinations [91] [92].
- Cost-effectiveness analyses in mRCC have shown sunitinib to be the least expensive treatment option ($357,948-$656,100) compared to newer immunotherapy combinations, though with potentially lower QALYs [92].
- Comparative cost analyses in RCC have demonstrated that sunitinib may be associated with higher total costs of care compared to alternatives like pazopanib, with one real-world study showing $12,000 higher mean total cost for sunitinib despite similar survival outcomes [93].
Signaling Pathways and Pharmacological Targets
Sunitinib's mechanism of action involves targeting multiple tyrosine kinase receptors. The following diagram illustrates the key signaling pathways and pharmacological targets:
The Scientist's Toolkit: Essential Research Reagents and Solutions
Table 3: Key Research Reagent Solutions for Sunitinib Pharmacometric Analysis
| Research Tool | Function/Application | Specifications/Alternatives |
|---|---|---|
| Nonlinear Mixed-Effects Modeling Software | Population PK/PD model development | NONMEM, Monolix, or R-based solutions |
| Pharmacoeconomic Modeling Platforms | Cost-utility analysis implementation | TreeAge Pro, R, Python with specialized packages |
| sVEGFR-3 Assay | Biomarker for target engagement | ELISA-based quantification [88] |
| Sunitinib and N-desethyl sunitinib Analytics | Therapeutic drug monitoring | LC-MS/MS methods for precise quantification [89] |
| Tumor Growth Dynamics Modeling | Quantitative assessment of treatment efficacy | Structural models: exponential, logistic, Simeoni models [88] |
| Time-to-Event Analysis Framework | Overall survival prediction | Weibull, exponential, or parametric survival models [87] [88] |
Discussion and Future Directions
The head-to-head comparison between traditional and pharmacometric modeling approaches for sunitinib cost-utility predictions reveals significant methodological implications for drug development and health technology assessment.
Interpretation of Key Findings
The substantial differences in ICER predictions between modeling frameworks (-21.2% to +39.6% deviations from the pharmacometric baseline) highlight the critical impact of structural uncertainty on cost-utility results [87]. This variability could directly influence reimbursement decisions for sunitinib and similar targeted therapies.
The superior performance of pharmacometric models in capturing dynamic toxicity patterns and more realistic drug exposure profiles suggests these frameworks may offer enhanced predictive validity for real-world outcomes [87] [89]. This is particularly relevant for drugs like sunitinib with narrow therapeutic windows and significant interindividual pharmacokinetic variability.
Limitations and Methodological Considerations
Several limitations warrant consideration when interpreting these comparisons:
- The "truth" in the comparative analysis was represented by the pharmacometric framework itself, which, while biologically plausible, remains a simplification of complex reality [88].
- Data requirements for pharmacometric models are substantially higher, requiring rich individual-level data on drug concentrations, biomarkers, and time-course of response [88].
- The generalizability of findings to other therapeutic areas and drug classes requires further validation through similar comparative studies.
Implications for Drug Development and Assessment
The demonstrated advantages of pharmacometric approaches suggest several important implications:
- Model-Informed Drug Development: Pharmacometric models should be developed earlier in the drug development process to inform both clinical development decisions and future health technology assessments [88].
- Health Technology Assessment Practices: Health technology assessment bodies should consider encouraging or requiring more biologically plausible modeling approaches for drugs with complex exposure-response relationships [87].
- Personalized Dosing Optimization: The integration of pharmacometric approaches with therapeutic drug monitoring could enhance individualization of sunitinib therapy, potentially improving both clinical outcomes and cost-effectiveness [89].
This head-to-head comparison demonstrates that model structure significantly influences cost-utility predictions for sunitinib, with pharmacometric-based pharmacoeconomic models providing more biologically plausible simulations of real-world toxicity trends and drug exposure changes. While traditional models remain valuable for initial assessments, pharmacometric approaches offer enhanced capability for extrapolating clinical trial data to long-term and real-world scenarios.
The choice between these modeling frameworks should be guided by the specific decision problem, available data, and required precision for reimbursement and clinical decisions. As precision medicine advances, the integration of pharmacological mechanisms into economic evaluations will become increasingly important for optimizing the value of targeted therapies like sunitinib in oncology practice.
The selection of a pharmacokinetic (PK) modeling strategy is a pivotal decision in drug development, with profound implications for financial expenditure, development timelines, and the quality of clinical decisions. Pharmacokinetics, the study of how the body absorbs, distributes, metabolizes, and excretes a drug (ADME), provides the foundation for determining dosage regimens and predicting therapeutic outcomes [94]. In contemporary pharmacology, two principal modeling approaches dominate: traditional compartmental modeling (including non-compartmental analysis and population PK) and mechanistic Physiologically Based Pharmacokinetic (PBPK) modeling.
Traditional compartmental models employ a "top-down" approach, using mathematical equations to describe plasma concentration-time data without direct physiological correspondence [48]. In contrast, PBPK modeling represents a "bottom-up" or "middle-out" methodology that constructs a mathematical representation of the human body as interconnected compartments corresponding to specific organs and tissues, integrating drug-specific properties with species-specific physiological parameters [95] [48]. This fundamental distinction in approach creates significant divergences in application, resource requirements, and decision-making influence throughout the drug development pipeline. As regulatory agencies increasingly endorse model-informed drug development (MIDD), understanding these trade-offs becomes essential for optimizing development strategy [5] [96].
Comparative Analysis of Modeling Approaches
Table 1: Fundamental Characteristics of Traditional vs. PBPK Modeling Approaches
| Characteristic | Traditional Compartmental Modeling | Mechanistic PBPK Modeling |
|---|---|---|
| Core Approach | Top-down, empirical | Bottom-up, mechanistic |
| Structural Basis | Mathematical compartments without direct physiological correlation | Anatomically and physiologically realistic compartments |
| Data Requirements | Primarily clinical PK plasma concentration data | Integrated in vitro, in silico, and clinical data |
| Parameter Estimation | Statistical fitting to observed data | In vitro-in vivo extrapolation (IVIVE) and system-specific parameters |
| Primary Strengths | - Efficient with rich data- Well-established for dosage regimen optimization- Lower initial resource investment | - Mechanistic insight into drug disposition- Prediction of tissue concentrations- Extrapolation to special populations- DDI prediction |
| Key Limitations | - Limited extrapolation capability- Does not predict tissue exposure- Less reliable for complex scenarios | - Higher complexity and development time- Requires extensive compound-specific data- Validation challenges for novel applications |
Table 2: Impact on Drug Development Cost and Timeline
| Development Aspect | Traditional Compartmental Modeling | Mechanistic PBPK Modeling |
|---|---|---|
| Typical Analysis Cost | Lower to moderate [97] | Moderate to high (reflects greater complexity) [97] |
| Implementation Timeline | Shorter model development cycle | Longer initial development and verification [95] |
| Animal Study Requirements | Often requires multiple in vivo studies for different scenarios | Can reduce animal testing via virtual simulations [5] |
| Clinical Trial Optimization | Optimizes sampling design within planned trials | Can inform trial design and potentially reduce needed studies [22] |
| Cost of Suboptimal Data | Moderate impact, often correctable with additional studies | High impact; poor input data severely compromises predictions |
| Return on Investment | Efficient for specific, well-defined questions | Higher potential value through better candidate selection and reduced late-stage failures [96] |
Methodologies and Experimental Protocols
Traditional Compartmental Modeling Workflow
Protocol 1: Population PK Model Development
- Study Design: Implement sparse sampling designs in target patient populations during Phase 2/3 trials. Collect 2-6 samples per subject to characterize population parameters and variability [98].
- Data Collection: Document dosing records, plasma concentration measurements, and patient covariates (e.g., weight, renal/hepatic function, genetics).
- Model Development:
- Use nonlinear mixed-effects modeling software (e.g., NONMEM, Monolix, Phoenix NLME).
- Select structural model (1-, 2-, or 3-compartment) based on diagnostic plots and objective function values.
- Identify significant covariates through stepwise forward addition/backward elimination.
- Evaluate model performance using visual predictive checks and bootstrap diagnostics.
- Model Application: Simulate alternative dosing regimens to optimize exposure targets, identify subpopulations requiring dose adjustments, and support regulatory submissions.
PBPK Model Development Workflow
Protocol 2: Mechanistic PBPK Modeling for Special Population Extrapolation
- System Parameters Selection: Obtain physiological parameters (organ volumes, blood flows, enzyme/transporter abundances) from established databases for specific populations (e.g., pediatric, hepatic impaired) [48].
- Compound Data Generation:
- Determine physicochemical properties (logP, pKa, molecular weight).
- Measure in vitro parameters: permeability, plasma protein binding, metabolic stability, enzyme kinetics, and transporter affinities.
- Perform in vitro-in vivo extrapolation (IVIVE) to predict human clearance and distribution.
- Model Building and Verification:
- Implement model structure in PBPK platforms (e.g., GastroPlus, Simcyp, PK-Sim).
- Verify model performance against available clinical data (e.g., single ascending dose, DDI studies).
- Conduct sensitivity analysis to identify critical parameters.
- Model Application:
- Simulate drug exposure in virtual populations under various clinical scenarios.
- Predict dose-exposure relationships for special populations where clinical trials are challenging.
- Submit model to regulatory agencies with appropriate credibility assessment [95].
The following diagram illustrates the conceptual workflow and key decision points when selecting and implementing these modeling strategies:
Impact on Clinical Decision-Making and Development Outcomes
Clinical Decision Support Applications
Table 3: Influence on Key Clinical Development Decisions
| Clinical Development Challenge | Traditional Modeling Approach | PBPK Modeling Approach |
|---|---|---|
| Pediatric Dose Selection | Empirical allometric scaling from adult data with limited physiological basis | Physiological scaling of organ size, function, and enzyme maturation to optimize pediatric dosing [5] |
| Drug-Drug Interaction (DDI) Assessment | Typically requires clinical DDI studies for each potential interaction | Mechanistic simulation of enzyme/transporter-mediated interactions; can replace some clinical DDI studies [95] |
| Special Population Dosing | Dedicated pharmacokinetic studies in patients with renal/hepatic impairment | Virtual population simulations to predict exposure changes and recommend dose adjustments [98] |
| Formulation Optimization | Comparative bioavailability studies between formulations | Integration of in vitro dissolution data to predict in vivo performance and guide formulation development [48] |
| First-in-Human Dose Selection | Allometric scaling from animal data with safety margins | Integrated IVIVE from preclinical species and human physiological parameters for more informed FIH dosing |
Case Study: PBPK Modeling in Gene Therapy Development
The application of PBPK modeling for complex biological products illustrates its potential impact on development strategy. At the FDA's Center for Biologics Evaluation and Research (CBER), PBPK modeling has supported 26 regulatory submissions from 2018-2024, including applications for gene therapies, plasma-derived products, and vaccines [5]. A notable case involves ALTUVIIIO, a recombinant Factor VIII therapy for hemophilia A, where a minimal PBPK model informed pediatric dose selection by simulating factor activity levels across dosing intervals. The model predicted that maintaining factor activity >20 IU/dL for the majority of the dosing interval would provide adequate bleeding protection, supporting once-weekly dosing in children under 12 years despite not maintaining levels >40 IU/dL throughout the entire interval [5]. This application demonstrates how PBPK modeling can optimize dosing regimens for special populations where clinical trials are particularly challenging.
Case Study: Traditional Modeling for Dosing Regimen Optimization
Traditional PK modeling remains highly valuable for specific development questions, particularly when rich clinical data are available. A case study from Premier Research demonstrates how simulation of phase 1 single ascending dose data guided selection between once-daily (QD) versus twice-daily (BID) dosing regimens [22]. The modeling revealed that while both regimens achieved similar overall exposure (AUC), the QD regimen produced a maximum concentration (Cmax) nearly double that of the BID regimen. For drugs with a narrow therapeutic index, this finding might have favored BID dosing to minimize potential toxicity. However, in this instance, the higher Cmax was not a safety concern, enabling selection of the more patient-friendly QD regimen for phase 2 studies [22]. This example highlights how traditional modeling efficiently answers targeted clinical questions with direct impact on patient compliance and development planning.
The Scientist's Toolkit: Essential Research Reagents and Platforms
Table 4: Key Research Tools for Pharmacokinetic Modeling
| Tool Category | Representative Examples | Primary Function |
|---|---|---|
| PBPK Software Platforms | GastroPlus (Simulation Plus), Simcyp (Certara), PK-Sim (Open Systems Pharmacology) | Whole-body PBPK modeling and simulation with built-in physiological databases [48] |
| Traditional PK/PD Software | NONMEM, Phoenix WinNonlin, Monolix | Non-compartmental analysis, population modeling, and PK/PD model development [48] |
| In Vitro Assay Systems | Caco-2 cells, human liver microsomes, hepatocytes, transfected cell lines | Assessment of permeability, metabolic stability, enzyme kinetics, and transporter interactions [48] |
| Data Analysis and Visualization | R, Python, Berkeley Madonna, MATLAB | Data processing, statistical analysis, custom modeling, and visualization [99] |
| Web-Based Applications | Nano-iPBPK (for nanomaterials) | Specialized PBPK tools for specific compound classes with user-friendly interfaces [99] |
The choice between traditional and mechanistic PBPK modeling approaches represents a strategic trade-off between immediate resource allocation and long-term development efficiency. Traditional compartmental models provide cost-effective solutions for well-defined clinical optimization questions, particularly when clinical data are readily obtainable. In contrast, PBPK modeling requires greater upfront investment but offers substantial returns through reduced clinical trial requirements, better candidate selection, and enhanced mechanistic understanding that derisks development decisions.
The most forward-thinking development programs increasingly adopt a complementary strategy, leveraging both approaches at appropriate stages. This integrated methodology balances the pragmatic efficiency of traditional modeling for late-stage development questions with the predictive power of PBPK for early candidate screening and special population extrapolation. As regulatory acceptance of model-informed drug development continues to grow, strategic investment in mechanistic modeling capabilities represents not merely a technical choice, but a fundamental component of efficient, scientifically-driven drug development in the modern era.
The Rise of Model-Informed Precision Dosing (MIPD) as a Future Application
Model-Informed Precision Dosing (MIPD) represents a paradigm shift in pharmacotherapy, moving beyond traditional "one-dose-fits-all" approaches to leverage mathematical modeling and simulation for tailoring drug doses to individual patient characteristics [100] [101]. This advanced framework integrates population pharmacokinetic (PopPK) models, physiologically based pharmacokinetic (PBPK) models, and pharmacokinetic/pharmacodynamic (PK/PD) relationships to predict the optimal dose most likely to improve efficacy and reduce toxicity for a specific patient [102] [103]. Whereas traditional dosing often relies on demographic characteristics like body surface area with limited accuracy, MIPD accounts for inter-individual variability in drug exposure by incorporating patient-specific factors such as genetics, organ function, and drug-drug interactions [104] [98].
The fundamental premise of MIPD rests on well-established relationships between drug exposure (pharmacokinetics) and response (pharmacodynamics), particularly for drugs with narrow therapeutic indices where suboptimal dosing can lead to therapeutic failure or severe toxicity [104] [98]. This approach has gained significant momentum across therapeutic areas, including oncology, infectious diseases, and inflammatory disorders, supported by advances in modeling software and growing regulatory acceptance [100] [102] [98]. As drug therapies become increasingly complex and expensive, MIPD offers a promising strategy to maximize clinical benefit while minimizing harm, ultimately advancing the goals of precision medicine.
Comparative Analysis: Traditional vs. Mechanism-Based PK Modeling
The evolution from traditional to mechanism-based pharmacokinetic modeling represents a fundamental advancement in how we understand and predict drug behavior in the human body. Traditional compartmental models employ mathematical descriptions of drug concentration-time profiles without explicit physiological meaning, whereas mechanism-based PBPK models incorporate actual human physiology, anatomy, and biochemistry to simulate drug disposition [98].
Table 1: Fundamental Differences Between Traditional and Mechanism-Based PK Modeling Approaches
| Characteristic | Traditional PK Modeling | Mechanism-Based PBPK Modeling |
|---|---|---|
| Structural Basis | Empirical compartments without physiological correlation | Anatomically realistic compartments representing organs/tissues |
| Parameterization | System-specific parameters estimated from observed data | System-specific parameters from literature; drug-specific from in vitro studies |
| Covariate Integration | Statistical relationships between parameters and patient factors | Physiological relationships (e.g., organ size, blood flow, function) |
| Predictive Capability | Limited to interpolations within observed population | Suitable for extrapolation to special populations and DDI scenarios |
| Typical Applications | Dose-exposure relationships in studied populations | Prediction of DDIs, organ impairment effects, first-in-human dosing |
Traditional PopPK modeling describes inter-individual variability in drug exposure using statistical distributions and identifies covariates that explain this variability through retrospective analysis of clinical data [98]. For example, a PopPK analysis might identify that renal function (measured by creatinine clearance) explains 40% of the variability in drug clearance for an antibiotic, leading to a dosing adjustment guideline based on this covariate.
In contrast, mechanism-based PBPK modeling adopts a "bottom-up" approach that incorporates physiological parameters (organ volumes, blood flows), drug-specific properties (lipophilicity, protein binding), and system-specific data (enzyme/transporter abundances) to simulate drug concentration-time profiles in virtual populations [23] [105]. This approach allows for prospective prediction of drug behavior in populations that may not have been studied clinically, such as pediatric patients or those with complex drug-drug interaction profiles.
The integration of artificial intelligence with PBPK modeling further enhances its predictive capability by enabling more accurate parameter estimation from chemical structure and high-throughput screening data [105]. For instance, AI-PBPK platforms can use graph neural networks to predict ADME parameters and machine learning algorithms to estimate apparent clearance, creating a powerful tool for predicting human PK/PD outcomes even in early drug discovery stages [105].
Experimental Evidence and Clinical Validation
Comparative Performance of PBPK vs. PopPK Approaches
The application of different modeling approaches has been systematically evaluated across numerous drug classes. A direct comparison of PBPK and PopPK methodologies for predicting gepotidacin doses in pediatric patients demonstrated that both approaches could reasonably predict drug exposures, though with notable differences in specific scenarios [23]. In this comprehensive analysis, researchers developed both PBPK and PopPK models to determine effective doses of gepotidacin for pneumonic plague treatment in children, where direct clinical trials would not be feasible.
Table 2: Performance Comparison of PBPK vs. PopPK in Pediatric Dose Prediction
| Performance Metric | PBPK Model | PopPK Model |
|---|---|---|
| Overall Prediction Accuracy | ~90% of predicted pediatric PK fell between 5th-95th percentiles of adult values (except subjects ≤5 kg) | Similar AUC(0-τ) and Cmax means compared to adult exposures across weight brackets |
| Covariate Identification | Body weight identified as key covariate affecting clearance | Body weight identified as key covariate affecting clearance |
| Dosing Recommendations | Weight-based for subjects ≤40 kg; fixed-dose for subjects >40 kg | Weight-based for subjects ≤40 kg; fixed-dose for subjects >40 kg |
| Performance in Special Populations | Incorporated age-dependent changes in CYP3A4 activity and renal function | Suboptimal for children <3 months due to absence of maturation characterization |
| Cmax Predictions | Slightly lower than PopPK predictions | Slightly higher than PBPK predictions |
The experimental workflow for this comparison involved:
PBPK Model Development: Constructed using Simcyp simulator with gepotidacin-specific physicochemical properties and in vitro ADME parameters, then verified against clinical data from intravenous dose studies and human mass balance studies [23].
PopPK Model Development: Developed using pooled PK data from phase 1 studies with IV gepotidacin in healthy adults, with body weight identified as a significant covariate affecting clearance [23].
Model Qualification: Both models were qualified using clinical PK results from healthy Caucasian and Japanese populations and subjects with renal impairment [23].
Pediatric Extrapolation: The qualified models were used to simulate pediatric exposures and propose dosing regimens targeting adult exposure ranges associated with efficacy and safety [23].
Mechanism-Based PK/PD Modeling for Enzyme Induction
A sophisticated example of mechanism-based modeling appears in a study of CYP3A1/2 induction by dexamethasone in rats, where researchers developed a comprehensive PK/PD model to characterize the complex concentration-induction response relationship [106]. The experimental protocol encompassed:
PK Modeling: A two-compartment model with zero-order absorption described dexamethasone pharmacokinetics, with systemic clearance of 172.7 mL·kg⁻¹·h⁻¹ and apparent volume of distribution of 657.4 mL/kg [106].
PD Sampling: Rats were sacrificed at various time points up to 60 hours post-treatment, with collection of blood and liver samples for analysis [106].
Biomarker Quantification: CYP3A1/2 mRNA levels were measured using RT-PCR, protein levels using ELISA, and enzyme activity via testosterone substrate assay [106].
Transit Compartment Modeling: An indirect response model with a series of transit compartments captured the delayed induction process through PXR transactivation [106].
The model successfully recapitulated the maximal induction of CYP3A1 and CYP3A2 mRNA levels (21.29-fold and 8.67-fold increases, respectively) and the delayed increase in total enzyme activity (up to 2.79-fold), with a lag time of 40 hours from the Tmax of dexamethasone plasma concentration [106]. This mechanism-based approach resolved both drug-specific and system-specific parameters, providing a comprehensive framework for predicting enzyme induction dynamics.
Clinical Implementation and Therapeutic Applications
Oncology: Evidence for Improved Outcomes
The implementation of MIPD in oncology has demonstrated significant clinical benefits for several chemotherapeutic agents, particularly those with narrow therapeutic indices. Prospective validation studies have shown that MIPD can improve clinical outcomes and reduce toxicities [104].
Table 3: Clinical Evidence for MIPD in Oncology
| Drug | Clinical Evidence | MIPD Strategy | Therapeutic Target |
|---|---|---|---|
| Busulfan | Decreased rate of VOD (24.1% vs 3.4%) and increased engraftment rate (64.0% vs 92.9%) [104] | Administer lower test dose to individualize first therapy dose | AUC 853-1462 μM·min per dosing cycle |
| High-Dose Methotrexate | Improved clinical outcomes demonstrated [104] | Bayesian dose adaptation during treatment | Target exposure metrics |
| Carboplatin | Extensive validation of therapeutic window; significant correlation between predicted and observed AUC [104] | A priori MIPD based on GFR (Calvert formula) | AUC 5-7 mg/mL·min |
| Cyclophosphamide | Significant reduction in toxicities; 38% reduction in hazard of acute kidney injury [104] | Lower initial dose (45 vs 60 mg/m²) with concurrent Bayesian adaptation | AUC 325 ± 25 μmol/L·h |
The MIPD workflow in clinical oncology typically involves:
Pre-treatment Dose Selection (A Priori MIPD): Using population models and patient characteristics (e.g., renal function, body size) to determine the initial dose [104].
Therapeutic Drug Monitoring: Measuring drug concentrations during treatment to inform model refinement [104].
Bayesian Forecasting (A Posteriori MIPD): Updating individual PK parameters based on observed concentrations to optimize subsequent doses [104].
Target Attainment Assessment: Comparing achieved exposures to established therapeutic targets associated with efficacy and safety [104].
This approach has been particularly valuable for drugs like busulfan, where MIPD significantly reduced the incidence of veno-occlusive disease (VOD) from 24.1% to 3.4% while improving engraftment rates in pediatric patients undergoing hematopoietic stem cell transplantation [104].
Anti-infective Therapy and Monoclonal Antibodies
Beyond oncology, MIPD has demonstrated substantial utility in optimizing anti-infective therapies and biologics. For antibiotics like linezolid, meropenem, and ciprofloxacin, PopPK models have been developed to support MIPD in critically ill patients and those with drug-resistant infections [101]. These models typically identify creatinine clearance as a critical covariate affecting drug clearance, leading to tailored dosing regimens for patients with impaired or augmented renal function [101].
In the realm of biologic therapies, MIPD has been applied to monoclonal antibodies like infliximab and adalimumab for inflammatory bowel disease. Comparative analyses of different PopPK models have identified optimal models for predicting drug exposure, with dose optimization strategies demonstrating that higher induction doses (10 mg/kg) or adaptive dosing based on interindividual variability improve the probability of endoscopic improvement [101]. Similarly, for ustekinumab in Crohn's disease, a semi-mechanistic PopPK/PD model comprising a two-compartment PK model linked to an indirect response model has supported individualized dosing [101].
The Scientist's Toolkit: Essential Research Reagents and Platforms
Successful implementation of MIPD relies on a sophisticated toolkit of computational platforms, software, and methodological frameworks. The table below summarizes key resources employed in contemporary MIPD research.
Table 4: Essential Research Tools for MIPD Implementation
| Tool Category | Specific Tools/Platforms | Primary Function | Application Examples |
|---|---|---|---|
| PBPK Simulators | Simcyp | Population-based ADME simulator | Gepotidacin PBPK model development [23] |
| PopPK Software | NONMEM, Monolix | Nonlinear mixed-effects modeling | PopPK model development for various drugs [101] |
| Bayesian Forecasting | Posologyr R package | Bayesian parameter estimation and dose individualization | MAP estimation and full posterior distribution estimation [101] |
| AI-PBPK Platforms | B2O Simulator | Integrated PBPK/PD with machine learning prediction | Prediction of PK/PD outcomes for P-CAB drugs [105] |
| Model Qualification | Various diagnostic tools | Model validation and performance assessment | VPC, bootstrap, prediction-corrected VPC [23] |
The experimental workflow for implementing MIPD typically follows a structured approach:
Future Perspectives and Implementation Challenges
Despite compelling evidence supporting its utility, the widespread clinical adoption of MIPD faces several significant challenges. Implementation remains limited in routine clinical care, particularly in oncology where only 16 drugs had prospective MIPD validation/implementation studies as of 2025 [104]. Key barriers include the need for specialized expertise, integration into clinical workflow, and insufficient education of prescribers [104] [98].
The future evolution of MIPD points toward several promising directions. The integration of artificial intelligence and machine learning with traditional modeling approaches enhances predictive capability and enables real-time concentration estimation without losing interpretability [100] [105]. The concept of "dynamic prescribing information" proposes the codevelopment of companion MIPD tools during drug development to accelerate evidence generation and clinical implementation [103]. Furthermore, the emergence of biosensor technology for real-time monitoring and models incorporating biomarkers for efficacy or toxicity promise to expand the scope and precision of MIPD [100].
For MIPD to realize its full potential, several requirements must be met: well-established therapeutic windows predictive of efficacy and/or toxicity, significant inter-individual variability in drug exposure, externally validated PopPK/PBPK models, and user-friendly software platforms preferably integrated into electronic medical records [104]. As these elements fall into place, MIPD is poised to fundamentally transform dosing paradigms across therapeutic areas, ultimately advancing the goals of precision medicine by ensuring each patient receives the right drug at the right dose at the right time.
The field of pharmacokinetics (PK) is fundamentally concerned with understanding what the body does to a drug. For decades, traditional compartmental pharmacokinetic (PK) modeling has served as the empirical, data-driven workhorse for characterizing drug concentration-time profiles [19] [18]. However, the rising complexity of therapeutic modalities and an intensified focus on precision medicine have catalyzed a shift towards more mechanistic approaches. Model-Informed Drug Development (MIDD) is now a cornerstone of modern pharmaceutical research, and within its toolkit, Physiologically Based Pharmacokinetic (PBPK) and Population PK (PopPK) modeling have emerged as particularly influential methodologies [107] [108].
This guide provides an objective comparison of these two dominant modeling paradigms. We will dissect their core principles, applications, and growing adoption trends, framed within the broader thesis of a sector-wide transition from traditional data-fitting models to mechanism-based, predictive computational frameworks.
Methodological Foundations: A Tale of Two Approaches
At their core, PBPK and PopPK models are built on fundamentally different philosophies, which dictates their respective strengths and applications in the drug development workflow.
Physiologically Based Pharmacokinetic (PBPK) Modeling
PBPK modeling is a "bottom-up" approach that constructs a mechanistic representation of the body as a system of interconnected, physiologically meaningful compartments, each representing a specific organ or tissue [19] [20]. These compartments are linked by the circulating blood system, with drug movement governed by physiological parameters (e.g., organ volumes, blood flow rates) and drug-specific properties (e.g., lipophilicity, protein binding) [108] [20].
- Core Principle: A priori prediction of drug pharmacokinetics by integrating system-independent drug parameters with species-specific physiology [20].
- Typical Output: Simulated concentration-time profiles in plasma and specific tissues for a "typical" individual [19].
Population Pharmacokinetic (PopPK) Modeling
In contrast, PopPK modeling is a "top-down" approach. It is largely empiric, building a model that best fits the observed clinical data [19]. The compartments in a PopPK model (e.g., central, peripheral) do not necessarily correspond to distinct anatomical entities but rather represent groups of tissues with similar distribution kinetics [19].
- Core Principle: Identify the structural model that describes the data and then quantify the sources of variability in PK parameters within a population [19].
- Typical Output: Estimates of typical PK parameters (e.g., clearance, volume of distribution) and the magnitude of inter-individual variability (IIV) attributed to specific covariates (e.g., weight, renal function) [19].
Table 1: Fundamental Characteristics of PBPK and PopPK Modeling Approaches.
| Feature | PBPK Modeling | PopPK Modeling |
|---|---|---|
| Approach | Bottom-up, mechanistic | Top-down, empiric |
| Model Structure | Physiologically defined compartments | Abstract, mathematically defined compartments |
| Primary Inputs | In vitro drug data, physiological system data | In vivo (clinical) concentration-time data |
| Handling of Variability | Can simulate variability by altering system parameters (e.g., organ size, enzyme abundance) | Directly estimates population variability and identifies covariate relationships |
| Key Strength | A priori prediction and extrapolation to novel scenarios | Empirical description of observed data and quantification of variability |
Quantitative Adoption Trends and Application Landscapes
The influence of PBPK and PopPK is reflected in their distinct and sometimes overlapping applications across the drug development lifecycle. Quantitative analysis of their use reveals a pattern of complementary, rather than competing, adoption.
Dominant Applications and Regulatory Impact
Industry forecasts for 2025 highlight the deep integration of MIDD, with both PBPK and PopPK playing critical roles from discovery through regulatory submission [107]. Companies are adopting a "model early, model often" philosophy, using these tools for dose justification, optimizing trial designs, and streamlining regulatory interactions at stages like IND, End-of-Phase 2 (EOP2), and NDA [107].
- PBPK Applications: Its strength in mechanistic extrapolation makes it the preferred tool for assessing Drug-Drug Interactions (DDI), predicting PK in special populations (e.g., pediatrics, organ impairment), and formulating pediatric extrapolation plans [19] [108] [20]. For instance, a 2026 study successfully used a minimal PBPK model to bridge bevacizumab pharmacokinetics from adults to pediatric patients, including those as young as six months [109].
- PopPK Applications: PopPK remains indispensable for quantifying covariate effects (e.g., impact of renal impairment on clearance) and optimizing dosing regimens for specific subpopulations based on robust clinical data analysis [19]. It is a staple in late-stage clinical development for refining the understanding of a drug's behavior in the target population.
The following workflow diagram illustrates how these two modeling strategies are integrated into a modern, efficient drug development process.
Performance Comparison in Key Areas
A critical comparison point is the performance of these models in specific extrapolation tasks. The table below summarizes their capabilities based on published applications and direct comparisons [19] [109].
Table 2: Comparative Performance of PBPK and PopPK in Predictive Scenarios.
| Extrapolation Scenario | PBPK Model Performance | PopPK Model Performance |
|---|---|---|
| Pediatrics (< 2 years old) | High (when ontogeny of enzymes/transporters is known) [109] [19] | Limited (often requires allometric scaling and is unreliable in infants <2 yrs without maturation models) [19] |
| Drug-Drug Interactions (DDI) | High (mechanistically predicts complex interactions if metabolic pathways are known) [19] [110] | Moderate (can identify interactions from clinical data but less predictive for new scenarios) |
| Organ Impairment | High (can incorporate disease-related physiological changes) [20] | High (excellent at quantifying exposure changes from patient data) |
| Predicting Tissue Exposure | High (explicitly models tissues) [20] [111] | Not Applicable (typically predicts plasma concentrations only) |
| Quantifying Population Variability | Limited (simulates variability but does not directly estimate it from data) [19] | High (core function is to estimate IIV and covariate effects) [19] |
Experimental Protocols: A Deep Dive into Key Studies
To move beyond theoretical comparison, we examine the detailed experimental protocols from two seminal studies that exemplify the application of PBPK and PopPK.
Protocol 1: PBPK Modeling for Pediatric Extrapolation of a Monoclonal Antibody
This protocol is based on a 2026 study that bridged bevacizumab PK from adults to pediatrics using a minimal PBPK model [109].
- Objective: To develop and validate a PBPK model for characterizing the age-dependent PK of bevacizumab in pediatric patients (6 months to 18 years).
- Software: Simcyp Simulator V22 (Certara UK Ltd) [109].
- Model Structure: A minimal PBPK model with compartments for plasma, tissue (subdivided into vascular, endosomal, interstitial spaces), and lymph nodes [109].
- Key System Parameters: Age-dependent changes in tissue volume, blood and lymphatic flow rates, and most critically, endogenous IgG concentration and FcRn receptor abundance [109].
- Drug-Specific Parameters: Bevacizumab molecular weight, binding affinity to FcRn (K~D~), hydrodynamic radius, and parameters governing endosomal uptake (K~up~), recycling (K~rc~), and catabolic clearance (CL~cat~) [109].
- Validation Data: Individual-level PK data from 786 adult and 141 pediatric patients across 23 clinical studies [109].
- Workflow:
- Model development and validation in the adult population.
- Incorporation of known age-dependent physiological changes (ontogeny) for the pediatric population.
- Sensitivity analysis to identify critical system parameters (e.g., endogenous IgG, FcRn).
- Prediction of bevacizumab exposure in pediatric cohorts and comparison with observed data.
Protocol 2: PopPK Model Development for Covariate Analysis
This protocol outlines a standard workflow for building a PopPK model to identify sources of inter-individual variability in clinical trials.
- Objective: To develop a PopPK model describing drug disposition and identifying patient factors (covariates) that significantly influence PK parameters.
- Software: NONMEM (ICON plc), R, or other statistical software.
- Data Requirements: Rich or sparse plasma concentration-time data from Phase I/II/III trials, accompanied by patient covariate data (e.g., weight, age, sex, renal/hepatic function, concomitant medications).
- Workflow:
- Base Model Development: Develop a structural model (e.g., one- or two-compartment) with statistical models for inter-individual and residual variability.
- Covariate Model Building: Test the influence of pre-specified covariates on PK parameters (e.g., the effect of body weight on volume of distribution, or creatinine clearance on drug clearance).
- Model Validation: Evaluate the final model using techniques like visual predictive checks (VPC) and bootstrap analysis to ensure its robustness and predictive performance.
- Model Application: Simulate typical exposure for different patient subgroups to inform dosing recommendations.
The diagram below maps this standard PopPK analysis workflow.
The Scientist's Toolkit: Essential Research Reagents and Solutions
The effective implementation of PBPK and PopPK modeling relies on a suite of specialized software, databases, and in vitro tools.
Table 3: Key Research Reagent Solutions for PBPK and PopPK Modeling.
| Tool Category | Example Products/Solutions | Function in Research |
|---|---|---|
| Commercial PBPK Platforms | GastroPlus (Simulations Plus), Simcyp (Certara), PK-Sim (Bayer AG) [108] [20] | Provide integrated physiological databases and modeling frameworks for mechanistic "bottom-up" simulation. |
| PopPK Software | NONMEM (ICON plc), Monolix (Lixoft), Phoenix NLME (Certara) | Industry-standard software for non-linear mixed-effects modeling, used for population analysis. |
| In Vitro Assay Systems | Human liver microsomes, recombinant CYP enzymes, human hepatocytes, Caco-2 cells [108] | Generate critical drug-specific parameters for PBPK models (e.g., CL~int~, enzyme kinetics, transporter activity). |
| Physicochemical Property Analyzers | HPLC, assays for logP, pKa, plasma protein binding [108] [111] | Determine fundamental drug properties required as input for both PBPK and distribution models in PopPK. |
The bibliometric and application trends clearly demonstrate that PopPK and PBPK are not in competition but are synergistic forces shaping the future of pharmacokinetics. The industry is moving beyond the traditional compartmental model dichotomy, embracing a holistic MIDD paradigm where "top-down" PopPK analysis of clinical data informs and validates "bottom-up" PBPK predictions.
The growing influence of these methodologies is evident in their ability to address some of the most challenging aspects of modern drug development: optimizing doses for special populations, de-risking complex drug interactions, and justifying regulatory decisions with mechanistic evidence. As the field evolves, the integration of machine learning and AI with these established modeling techniques promises to further enhance parameter estimation and model accuracy, solidifying their role as indispensable tools in the quest for safer and more effective therapies [25].
Conclusion
The choice between traditional and mechanism-based pharmacokinetic modeling is not a matter of superiority, but of strategic fit. Traditional models offer simplicity and efficiency for well-defined questions like initial exposure assessment, while mechanism-based models provide unparalleled biological insight and predictive power for complex scenarios involving extrapolation, drug interactions, and special populations. The compelling evidence from comparative studies, such as the sunitinib analysis which showed mechanism-based models more accurately captured real-world toxicity trends, underscores the value of a biologically plausible approach. The future of PK modeling lies in a synergistic, fit-for-purpose strategy, increasingly powered by population methods and AI, that leverages the strengths of both paradigms to accelerate the development of safer, more effective therapies through model-informed drug discovery and development.
References
- 1. Pharmacokinetics and Pharmacodynamics in Drug ... [https://amsbiopharma.com/pk-pd-studies-drug-development-adme/]
- 2. Physiologically Based Pharmacokinetic (PBPK) Modeling ... [https://www.sciencedirect.com/science/article/pii/S2773216925000339]
- 3. Introduction to Pharmacokinetic Modeling Methods - PMC [https://pmc.ncbi.nlm.nih.gov/articles/PMC3636497/]
- 4. Mechanism-based pharmacokinetic-pharmacodynamic ... [https://pubmed.ncbi.nlm.nih.gov/16132354/]
- 5. Physiologically Based Pharmacokinetic Modeling and ... [https://pmc.ncbi.nlm.nih.gov/articles/PMC12541349/]
- 6. ADME Properties in Drug Delivery - PMC - PubMed Central [https://pmc.ncbi.nlm.nih.gov/articles/PMC12114914/]
- 7. Special Issue : Mechanism-Based Pharmacokinetic and ... [https://www.mdpi.com/journal/pharmaceutics/special_issues/2G2NV460QV]
- 8. A machine learning approach to population ... [https://www.nature.com/articles/s43856-025-01054-8]
- 9. Incorporating Receptor Theory in Mechanism-Based ... [https://www.sciencedirect.com/science/article/pii/S1347436715300781]
- 10. Pharmacokinetic Model Comparisons: How We Do It and Why ... [https://blog.insight-rx.com/resources/pharmacokinetic-model-comparisons-methods]
- 11. Advancing drug development with “Fit-for-Purpose” modeling ... [https://pmc.ncbi.nlm.nih.gov/articles/PMC12436579/]
- 12. Pharmacokinetics & Compartmental Modeling [https://www.allucent.com/resources/blog/compartmental-modeling-pharmacokinetics]
- 13. Editorial: Application of PKPD modeling in drug discovery ... [https://www.frontiersin.org/journals/pharmacology/articles/10.3389/fphar.2025.1614689/full]
- 14. Reevaluating Non-Compartmental Analysis in ... [https://aplosanalytics.com/blog/rethinking-nca-analysis-in-drug-development]
- 15. Global research on the utilization of population ... [https://www.frontiersin.org/journals/pharmacology/articles/10.3389/fphar.2025.1548023/full]
- 16. Pharmacokinetic Comparison of Novel Tablet-in-Tablet and ... [https://pmc.ncbi.nlm.nih.gov/articles/PMC12460205/]
- 17. Model-Informed Drug Development of Subcutaneous ... [https://pubmed.ncbi.nlm.nih.gov/40990036/]
- 18. A compatibility evaluation between the physiologically ... [https://www.frontiersin.org/journals/pharmacology/articles/10.3389/fphar.2022.964049/full]
- 19. Difference between PBPK & Population PK Modeling [https://www.allucent.com/resources/blog/what-difference-between-pbpk-and-poppk-modeling]
- 20. Applied Concepts in PBPK Modeling: How to Build a PBPK ... [https://pmc.ncbi.nlm.nih.gov/articles/PMC5080648/]
- 21. Prediction of pharmacokinetic/pharmacodynamic ... [https://www.frontiersin.org/journals/pharmacology/articles/10.3389/fphar.2025.1578117/full]
- 22. Pharmacokinetic Modeling & Simulation to Optimize ... [https://premier-research.com/perspectives/increasing-clinical-trial-success-pharmacokinetic-modeling-simulation-to-optimize-dosing-regimens/]
- 23. Comparison between physiologically based pharmacokinetic ... [https://pmc.ncbi.nlm.nih.gov/articles/PMC9293063/]
- 24. The Evolution and Future Directions of PBPK Modeling in ... [https://www.mdpi.com/1999-4923/17/11/1413]
- 25. Opportunities for machine learning and artificial ... [https://pmc.ncbi.nlm.nih.gov/articles/PMC12573771/]
- 26. Comparing computational times for simulations when using ... [https://www.frontiersin.org/journals/toxicology/articles/10.3389/ftox.2025.1518769/full]
- 27. An automated pipeline to generate initial estimates for ... [https://pmc.ncbi.nlm.nih.gov/articles/PMC12592298/]
- 28. in vivo pharmacokinetic modeling of vericiguat [https://www.sciencedirect.com/science/article/pii/S0928098725001885]
- 29. Opportunities for machine learning and artificial ... [https://www.sciencedirect.com/science/article/abs/pii/S0169409X25002017]
- 30. Biosimulation Market Outlook 2025-2029: Key Trends ... [https://uk.finance.yahoo.com/news/biosimulation-market-outlook-2025-2029-090400818.html]
- 31. Structure‒tissue exposure/selectivity relationship (STR ... [https://pmc.ncbi.nlm.nih.gov/articles/PMC9136610/]
- 32. Diversity of Mechanism-Based Pharmacodynamic Models [https://www.sciencedirect.com/science/article/abs/pii/S0090955624026606]
- 33. A machine learning approach to population pharmacokinetic ... [https://pmc.ncbi.nlm.nih.gov/articles/PMC12314194/]
- 34. Application of Machine Learning and Mechanistic ... [https://pmc.ncbi.nlm.nih.gov/articles/PMC11998014/]
- 35. A deep dive into parameter estimation for advanced PBPK ... [https://www.sciencedirect.com/science/article/pii/S134743672400017X]
- 36. Comparative Analysis of Traditional and Pharmacometric ... [https://link.springer.com/article/10.1007/s40273-024-01438-z]
- 37. DCE@urLAB: a dynamic contrast -enhanced MRI pharmacokinetic ... [https://bmcbioinformatics.biomedcentral.com/articles/10.1186/1471-2105-14-316]
- 38. Application of Physiologically-Based Pharmacokinetic (PBPK ... [https://pmc.ncbi.nlm.nih.gov/articles/PMC12334468/]
- 39. Physiologically Based Pharmacokinetic Modeling [https://pmc.ncbi.nlm.nih.gov/articles/PMC3118302/]
- 40. Streamlining physiologically‐based pharmacokinetic ... [https://pmc.ncbi.nlm.nih.gov/articles/PMC9007599/]
- 41. Comparison of physiologically based pharmacokinetic ... [https://pubmed.ncbi.nlm.nih.gov/41143686/]
- 42. Modeling Human Physiology on a Chip: The Rise of PBPK ... [https://pharmafeatures.com/modeling-human-physiology-on-a-chip-the-rise-of-pbpk-in-drug-discovery/]
- 43. Mechanism-Based Pharmacodynamic Modeling - PMC [https://pmc.ncbi.nlm.nih.gov/articles/PMC3684160/]
- 44. Mechanistic models for hematological toxicities - PMC - NIH [https://pmc.ncbi.nlm.nih.gov/articles/PMC8129710/]
- 45. Pharmacodynamic modeling of adverse effects of anti- ... [https://pmc.ncbi.nlm.nih.gov/articles/PMC4865542/]
- 46. Mechanistic PKPD modeling to describe cytokine release ... [https://www.frontiersin.org/journals/immunology/articles/10.3389/fimmu.2024.1463915/full]
- 47. Role of Pharmacokinetic/ Pharmacodynamic Modeling and ... [https://esmed.org/MRA/mra/article/view/6147]
- 48. Application of Physiologically-Based Pharmacokinetic ... [https://link.springer.com/article/10.1007/s40495-025-00427-w]
- 49. Emerging perspectives on leveraging physiologically ... [https://www.sciencedirect.com/science/article/pii/S0022354925004848]
- 50. GastroPlus® PBPK & PBBM Software [https://www.simulations-plus.com/software/gastroplus/]
- 51. Phoenix® PK/PD Platform | PK/PD Analysis & Modeling [https://www.certara.com/software/phoenix-pkpd/]
- 52. PKMP - Pharmacokinetic Modeling Program [https://aplanalytics.com/]
- 53. Drug Interaction PBPK Modeling: Review of the Literature ... [https://pmc.ncbi.nlm.nih.gov/articles/PMC12267664/]
- 54. Evaluation of Pharmacokinetic Drug–Drug Interactions [https://pmc.ncbi.nlm.nih.gov/articles/PMC7912632/]
- 55. Can Mechanistic Static Models for Drug-Drug Interactions ... [https://pmc.ncbi.nlm.nih.gov/articles/PMC10042977/]
- 56. Evaluation of various experimental conditions and ... [https://www.sciencedirect.com/science/article/abs/pii/S0090955625091263]
- 57. Machine learning-based quantitative prediction of drug ... [https://www.nature.com/articles/s41746-022-00639-0]
- 58. A comparison of different methods for the first-in-pediatric ... [https://pmc.ncbi.nlm.nih.gov/articles/PMC9741938/]
- 59. Benefits of mechanistic computational models for drug ... [https://pmc.ncbi.nlm.nih.gov/articles/PMC4567444/]
- 60. Physiologically Based Pharmacokinetic Modeling: A Tool ... [https://www.intechopen.com/chapters/42073]
- 61. Quantifying Heart Rate Changes After Delta-9 ... - PubMed [https://pubmed.ncbi.nlm.nih.gov/40006603/]
- 62. Quantifying Heart Rate Changes After Delta-9- ... [https://www.mdpi.com/1999-4923/17/2/237/review_report]
- 63. Physiologically Based Pharmacokinetic Modeling to ... [https://www.mdpi.com/1424-8247/18/5/637]
- 64. A hybrid modeling approach for assessing mechanistic ... [https://www.nature.com/articles/s41598-021-90637-1]
- 65. Applications of PBPK Modeling to Estimate Drug ... [https://www.mdpi.com/1999-4923/17/9/1207]
- 66. Modelling and simulation: questions and answers [https://www.ema.europa.eu/en/human-regulatory-overview/research-and-development/scientific-guidelines/clinical-pharmacology-pharmacokinetics/modelling-simulation-questions-answers]
- 67. Basic Concepts in Physiologically Based Pharmacokinetic ... [https://pmc.ncbi.nlm.nih.gov/articles/PMC3828005/]
- 68. Comparison of population pharmacokinetic modeling and ... [https://www.sciencedirect.com/science/article/abs/pii/S0924857924003406]
- 69. Comparisons of PK-Sim and R program for physiologically ... [https://pubmed.ncbi.nlm.nih.gov/39932881/]
- 70. Application of physiologically based pharmacokinetic ... [https://www.sciencedirect.com/science/article/pii/S0928098724001507]
- 71. Impact of Extrapolation Model Choices on the Structural ... [https://pmc.ncbi.nlm.nih.gov/articles/PMC10169997/]
- 72. The Spectrum of Mechanism-Oriented Models and Methods ... [https://pmc.ncbi.nlm.nih.gov/articles/PMC8277120/]
- 73. Comparing mechanism-based and machine learning ... [https://www.nature.com/articles/s41598-023-37238-2]
- 74. Understanding AF Mechanisms Through Computational ... [https://www.aerjournal.com/articles/understanding-af-mechanisms-through-computational-modelling-and-simulations?language_content_entity=en]
- 75. Mechanism-based organization of neural networks to ... [https://www.nature.com/articles/s41598-024-59378-9]
- 76. Navigating the landscape of parameter identifiability methods [https://pmc.ncbi.nlm.nih.gov/articles/PMC11247124/]
- 77. Parameter Identifiability of Fundamental Pharmacodynamic ... [https://pmc.ncbi.nlm.nih.gov/articles/PMC5136565/]
- 78. What is Identifiability? [https://www.certara.com/knowledge-base/what-is-identifiability/]
- 79. Mechanism-based pharmacokinetic and ... [https://pubmed.ncbi.nlm.nih.gov/37743720/]
- 80. Certara Software: A Guide to Drug Development Modeling ... [https://intuitionlabs.ai/articles/certara-drug-development-software-guide]
- 81. Scalable and robust machine learning framework for HIV ... [https://www.nature.com/articles/s41598-025-00085-4]
- 82. Moving from Basic towards Systems Pharmacodynamic ... [https://pmc.ncbi.nlm.nih.gov/articles/PMC3743951/]
- 83. Fundamentals of population pharmacokinetic modelling [https://pubmed.ncbi.nlm.nih.gov/22799590/]
- 84. Tutorial on model selection and validation of model input into ... [https://pmc.ncbi.nlm.nih.gov/articles/PMC10725261/]
- 85. A Physiological-Based Pharmacokinetic Model Embedded ... [https://www.sciencedirect.com/science/article/abs/pii/S0090955624009334]
- 86. Comparison of the Accuracy and Precision of Pharmacokinetic ... [https://pmc.ncbi.nlm.nih.gov/articles/PMC4325820/]
- 87. Comparative Analysis of Traditional and Pharmacometric ... [https://pubmed.ncbi.nlm.nih.gov/39327347]
- 88. Comparative Analysis of Traditional and Pharmacometric ... [https://pmc.ncbi.nlm.nih.gov/articles/PMC11724784/]
- 89. Clinical-Based vs. Model-Based Adaptive Dosing Strategy [https://www.mdpi.com/1424-8247/14/6/494]
- 90. Cost-Effectiveness Analysis of Tyrosine Kinase Inhibitors in ... [https://pmc.ncbi.nlm.nih.gov/articles/PMC8784780/]
- 91. A cost-effectiveness comparison between immunotherapy ... [https://pmc.ncbi.nlm.nih.gov/articles/PMC12536148/]
- 92. Comparing the Cost-effectiveness of Treatments for mRCC [https://www.guoncologynow.com/post/comparing-the-cost-effectiveness-of-treatments-for-mrcc]
- 93. Sunitinib Associated with Higher Costs Compared ... [https://oncpracticemanagement.com/issues/2015/may-2015-vol-5-no-4/sunitinib-associated-with-higher-costs-compared-with-pazopanib-in-patients-with-rcc]
- 94. Pharma Project Management: timelines in pharmacokinetics [https://www.officetimeline.com/blog/pharmacokinetics-timelines]
- 95. Development of best practices in physiologically based ... [https://pmc.ncbi.nlm.nih.gov/articles/PMC8592512/]
- 96. Incorporating Pharmacometrics into Pharmacoeconomic ... [https://pmc.ncbi.nlm.nih.gov/articles/PMC7578131/]
- 97. How Much Does PK/PD Analysis Cost? [https://www.allucent.com/resources/blog/understanding-cost-pharmacokinetic-and-pharmacodynamic-analyses]
- 98. Role of pharmacokinetic modeling and simulation in precision ... [https://tcr.amegroups.org/article/view/17108/html]
- 99. Development of a multi-route physiologically based ... [https://particleandfibretoxicology.biomedcentral.com/articles/10.1186/s12989-022-00489-4]
- 100. Model-informed precision dosing: State of the art and future ... [https://pubmed.ncbi.nlm.nih.gov/39159868/]
- 101. Model-Informed Precision Dosing (MIPD) [https://www.mdpi.com/1999-4923/14/12/2731]
- 102. Editorial: Model-informed drug development and precision ... [https://www.frontiersin.org/journals/pharmacology/articles/10.3389/fphar.2023.1224980/full]
- 103. Codevelopment of Companion Model-Informed Precision ... [https://pubmed.ncbi.nlm.nih.gov/30500115/]
- 104. Model-Informed Dose Optimization in Oncology - PMC [https://pmc.ncbi.nlm.nih.gov/articles/PMC11946950/]
- 105. Predicting pharmacodynamic effects through early drug ... [https://www.frontiersin.org/journals/pharmacology/articles/10.3389/fphar.2024.1330855/full]
- 106. A mechanism-based pharmacokinetic/pharmacodynamic ... [https://www.nature.com/articles/aps2011161]
- 107. 2025 Drug Development Trends | Xyzagen Industry Forecast [https://xyzagen.com/2025-drug-development-trends-the-evolution-of-innovation-a-xyzagen-industry-forecast/]
- 108. PBPK modeling and simulation in drug research ... [https://pmc.ncbi.nlm.nih.gov/articles/PMC5125732/]
- 109. Utilizing Minimal Physiologically Based Pharmacokinetic ... [https://link.springer.com/article/10.1208/s12248-025-01120-y]
- 110. A Comparative Analysis of Physiologically Based ... [https://pmc.ncbi.nlm.nih.gov/articles/PMC9487592/]
- 111. Mechanistic Physiologically Based Pharmacokinetic (PBPK ... [https://www.sciencedirect.com/science/article/abs/pii/S0022354917308341]