X-ray Crystallography Decoded: A Modern Guide to Solving Receptor Structures for Drug Discovery
This comprehensive guide explores the critical role of X-ray crystallography in determining high-resolution structures of biological receptors, a cornerstone of rational drug design.
X-ray Crystallography Decoded: A Modern Guide to Solving Receptor Structures for Drug Discovery
Abstract
This comprehensive guide explores the critical role of X-ray crystallography in determining high-resolution structures of biological receptors, a cornerstone of rational drug design. Tailored for researchers, scientists, and drug development professionals, the article details the foundational principles, current methodological workflows, and best practices for sample preparation, data collection, and structure solution. It addresses common challenges and troubleshooting strategies, compares X-ray crystallography with emerging techniques like cryo-EM, and provides insights into validating and interpreting structural models. The content synthesizes the latest advancements to empower professionals in leveraging atomic-level receptor insights for accelerating biomedical innovation.
The Crystalline Foundation: Core Principles of X-ray Crystallography for Receptor Biology
Application Notes: The Impact of High-Resolution Structures
Enabling Rational Drug Design
Atomic-resolution structures (typically < 2.0 Å) of pharmacological targets, such as G protein-coupled receptors (GPCRs) and ion channels, provide a precise molecular blueprint. This allows for the structure-based design of novel compounds with optimized affinity, selectivity, and reduced off-target effects. Recent breakthroughs have elucidated disease-relevant mutant receptor conformations, directly informing therapies for cancers and genetic disorders.
Mechanistic Insights into Allostery and Signaling
High-resolution structures capture subtle conformational changes induced by ligand binding, revealing allosteric sites and signaling mechanisms. Cryo-electron microscopy (cryo-EM) and micro-electron diffraction (MicroED) now complement X-ray crystallography, enabling the study of larger, more complex receptor assemblies in different functional states.
Experimental Protocols
Protocol: High-Throughput Crystallization of a Stabilized GPCR Construct
Objective: To obtain diffraction-quality crystals of a stabilized β2-adrenergic receptor (β2AR) fusion protein for ligand-bound structure determination.
Materials:
- Purified β2AR-T4L fusion protein (in n-Dodecyl-β-D-Maltoside (DDM)/Cholesteryl Hemisuccinate (CHS))
- Precipitant solutions (e.g., PEG 3350, PEG 4000, MMT buffer)
- Ligand of interest (e.g., Alprenolol, 10 mM in DMSO)
- Crystallization plates (96-well sitting-drop plates)
- Liquid handling robot
- High-sensitivity X-ray diffraction source (Synchrotron)
Procedure:
- Ligand Complexation: Incubate purified β2AR-T4L (10 mg/mL) with a 5-fold molar excess of ligand for 1 hour on ice.
- Crystallization Setup: Using a liquid handling robot, mix 200 nL of protein-ligand complex with 200 nL of precipitant solution in the sitting-drop well. Seal the plate.
- Incubation: Incubate plates at 20°C in a vibration-free environment. Monitor daily for crystal growth (typically appears in 3-7 days).
- Harvesting & Cryo-protection: Flash-cool crystals in liquid nitrogen using a cryo-protectant solution (e.g., precipitant solution supplemented with 25% glycerol).
Protocol: Data Collection and Structure Refinement for a Kinase-Inhibitor Complex
Objective: To solve the atomic structure of a tyrosine kinase bound to an inhibitor at 1.8 Å resolution.
Procedure:
- Diffraction Data Collection: At a synchrotron beamline, collect a 360° dataset from a single crystal at 100 K. Use an X-ray wavelength of 0.978 Å and a detector distance optimized for 1.8 Å resolution.
- Data Processing:
- Index and integrate diffraction images using XDS or DIALS.
- Scale and merge data using AIMLESS. Aim for completeness >95% and Rmerge <10%.
- Molecular Replacement & Refinement:
- Use a homologous kinase structure (PDB ID: 3PP0) as a search model in Phaser.
- Perform iterative cycles of model building in Coot and refinement in Phenix.refine, incorporating the inhibitor and water molecules.
- Validate the final model using MolProbity.
Table 1: Impact of Resolution on Key Refinement Metrics for Representative Receptor Structures
| PDB ID | Receptor (Ligand) | Method | Resolution (Å) | Rwork/Rfree | Clashscore | Ramachandran Favored (%) |
|---|---|---|---|---|---|---|
| 7WBT | β1AR (Bisoprolol) | X-ray | 1.80 | 0.210/0.240 | 2.1 | 98.5 |
| 8F7T | SMO (Antagonist) | Cryo-EM | 2.20 | 0.229/0.254 | 4.7 | 97.8 |
| 8IL8 | EGFR (Osimertinib) | X-ray | 1.65 | 0.189/0.218 | 1.5 | 99.1 |
| 6UEN | TRPV1 (Capsaicin) | Cryo-EM | 2.80 | 0.276/0.295 | 8.9 | 95.2 |
Table 2: Key Research Reagent Solutions
| Item | Function in Receptor Crystallography |
|---|---|
| Monoolein (lipidic cubic phase) | A lipid matrix for crystallizing membrane proteins in a more native bilayer-like environment. |
| T4 Lysozyme (T4L) fusion tag | A soluble protein inserted into an intracellular loop to enhance crystal contacts for GPCRs. |
| Fab Fragments / Nanobodies | Used to bind and stabilize specific conformations of receptors, facilitating crystallization. |
| HEK293S GnTI- cells | Mammalian expression system producing proteins with homogeneous, simple glycosylation. |
| Fluorinated Detergents (e.g., F-35) | Enhance protein stability and can improve diffraction quality by reducing background scattering. |
| Jellybody (secretory pathway) tag | A small protein tag that enhances the secretion and yield of membrane proteins in insect cells. |
Visualizations
Diagram 1: Drug Design from Atomic Structures
Diagram 2: GPCR Signaling and Allosteric Modulation
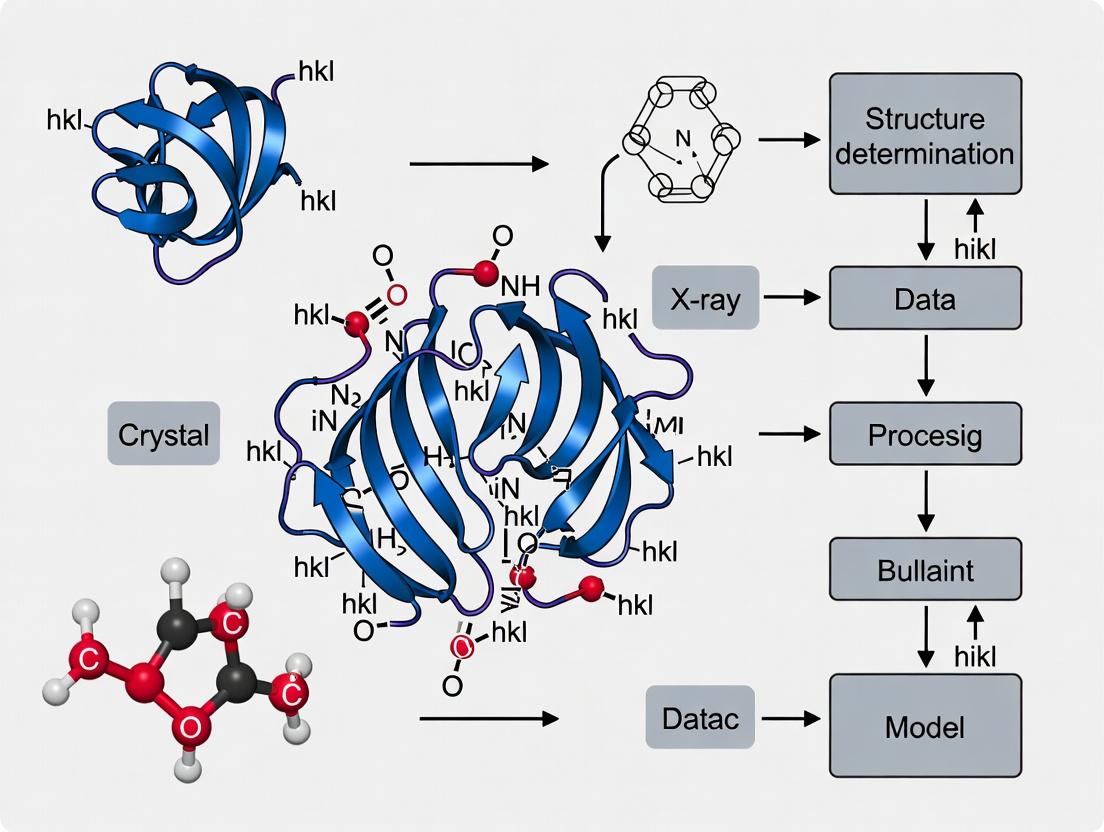
Within structural biology research, particularly for drug discovery targeting G-protein-coupled receptors (GPCRs) and other membrane proteins, X-ray crystallography remains a cornerstone for determining high-resolution three-dimensional structures. This process hinges on two fundamental physical principles: the generation of a diffraction pattern from a crystalline sample and the subsequent solution of the crystallographic phase problem to reconstruct an electron density map. These application notes detail the essential protocols and current methodologies to navigate from purified protein to a refined atomic model.
Key Quantitative Parameters in Macromolecular Crystallography
The following tables summarize critical quantitative relationships and benchmarks.
Table 1: Key Relationships in X-ray Diffraction
| Parameter | Symbol/Equation | Typical Range/Value | Physical Significance |
|---|---|---|---|
| Bragg's Law | nλ = 2d sinθ | λ ~ 0.5 - 2.0 Å (synchrotron: ~1 Å) | Condition for constructive interference; links diffraction angle (θ) to lattice spacing (d). |
| Resolution Limit | d_min | 1.5 - 3.5 Å (for drug discovery) | Finest detail discernible in the electron density map. Critical for modeling side chains and ligands. |
| Wilson B-factor | B = 8π²⟨u²⟩ | 20 - 60 Ų for well-diffracting crystals | Models overall disorder (atomic displacement) in the crystal. |
Table 2: Phasing Methods Comparison (2024 Benchmark Data)
| Method | Typical Resolution Required | Success Rate* (GPCRs) | Key Advantage | Primary Limitation |
|---|---|---|---|---|
| Molecular Replacement (MR) | < 3.0 Å | ~70% | Fast, uses known homologous structure. | Requires a sufficiently similar model (>30% identity). |
| Single-Wavelength Anomalous Dispersion (SAD) | < 3.2 Å | ~85% (for SeMet) | Single crystal needed. Can be automated. | Requires incorporation of anomalous scatterers (e.g., Se, Br, I). |
| Multi-Wavelength Anomalous Dispersion (MAD) | < 3.5 Å | >90% (for lanthanides) | Robust, minimizes systematic errors. | Requires tunable X-ray source (synchrotron) and multiple datasets. |
| Microcrystal Electron Diffraction (MicroED) | < 2.0 Å | Emerging | Works with nano/microcrystals. | Specialized equipment, radiation damage management. |
*Success rate defined as obtaining an interpretable electron density map from a diffracting crystal.
Core Experimental Protocols
Protocol 2.1: High-Throughput Crystallization Screening for Membrane Proteins
Objective: Identify initial crystallization conditions for a purified, detergent-solubilized receptor (e.g., GPCR). Materials: See "Scientist's Toolkit" below. Procedure:
- Protein Preparation: Concentrate purified receptor to 5-50 mg/mL in a buffer containing a stabilizing detergent (e.g., LMNG/CHS).
- Ligand Complexation: Incubate protein with a 2-5 molar excess of target ligand (e.g., drug candidate) for 1-2 hours on ice.
- Crystallization Setup: Use an automated liquid handler to set up 200 nL sitting drops in 96-well plates.
- Mix 100 nL protein-ligand complex with 100 nL reservoir solution.
- Use commercial sparse-matrix screens (e.g., MemGold, MemMeso) and LCP screens (for cubic phase crystallization).
- Incubation & Monitoring: Seal plates and incubate at 20°C or 4°C. Image drops automatically daily for 2 weeks, then weekly for up to 8 weeks.
- Hit Identification: Visually identify crystals or birefringent spherulites. Optimize hits using grid screens around initial condition.
Protocol 2.2: Data Collection Strategy for SAD Phasing
Objective: Collect a single, high-quality dataset sufficient for experimental phasing using selenium SAD. Materials: SeMet-labeled protein crystal, cryo-protectant solution, synchrotron beamline. Procedure:
- Cryo-Cooling: Harvest a single SeMet crystal (50-200 μm). Soak for 5-10 seconds in reservoir solution supplemented with 20-25% cryo-protectant (e.g., glycerol, ethylene glycol). Flash-cool in liquid nitrogen.
- Beamline Alignment: Mount loop on goniometer under a 100K nitrogen stream. Use beamline software to center crystal.
- Optimize Oscillation & Exposure: Collect a 5° test wedge. Analyze spots for resolution limit and diffraction quality.
- SAD Data Collection:
- Tune X-ray wavelength to the selenium K-edge peak (~0.9795 Å).
- Collect 360° of data with an oscillation angle of 0.5-1.0° per image.
- Aim for high multiplicity (high completeness, >99.5%) and an overall signal (I/σ(I)) > 2.0 at the desired resolution limit.
- Data Processing: Process images with XDS or DIALS. Scale and merge with AIMLESS. Analyze statistics (CC1/2, Rmerge).
Protocol 2.3: Molecular Replacement and Phase Improvement
Objective: Solve the phase problem using a known homologous structure and build an initial model. *Materials: Processed diffraction data (scaled .mtz file), homologous model (PDB ID), software (Phaser, Phenix, Coot). Procedure:
- Model Preparation: Remove ligands and solvent from the homologous PDB file. Prune non-conserved side chains to alanine. Generate ensemble if multiple templates exist.
- Run Phaser MR: Input search model and processed data. Define composition (protein sequence). Run rotation and translation function searches.
- Phase Calculation & Initial Building: Use Phaser MR solution to generate initial phases. Run Phenix.autobuild for automated model building into the electron density map.
- Iterative Refinement & Ligand Fitting: In Coot, manually correct the model, guided by 2mFo-DFc and mFo-DFc maps. Add ligand from the provided dictionary. Perform cycles of refinement in Phenix.refine with geometry restraints.
Visual Workflows & Pathways
Title: The Central Dogma of Protein Crystallography
Title: Crystallographic Phasing Decision Pathway
The Scientist's Toolkit: Key Research Reagent Solutions
| Reagent/Material | Supplier Examples | Primary Function in Protocol |
|---|---|---|
| n-Dodecyl-β-D-Maltoside (DDM) | Anatrace, Sigma-Aldrich | Mild detergent for initial solubilization of membrane proteins. |
| Lauryl Maltose Neopentyl Glycol (LMNG) | Anatrace | Bolaamphiphile detergent for enhanced stability of GPCRs during purification and crystallization. |
| Cholesteryl Hemisuccinate (CHS) | Sigma-Aldrich, Anatrace | Cholesterol analog added to detergents to stabilize membrane proteins. |
| Monoolein (for LCP) | Nu-Chek Prep | Lipid for forming the cubic phase in lipidic cubic phase (LCP) crystallization. |
| MemGold & MemMeso Screens | Molecular Dimensions | Commercial sparse-matrix screens empirically formulated for membrane proteins. |
| CryoProtectant Solutions (e.g., Paratone-N) | Hampton Research | Mixtures to prevent ice formation during cryo-cooling of crystals. |
| SeMet Medium (for labeling) | Molecular Dimensions, Medicago | Defined bacterial growth medium for selenomethionine incorporation. |
| HEPES & MES Buffers | Thermo Fisher, Sigma-Aldrich | Biological buffers for maintaining pH during protein handling and crystallization. |
| PEGs (Polyethylene Glycols) | Hampton Research, Qiagen | Primary precipitating agents in crystallization screens. |
| Ligand/Drug Candidate Stocks | In-house synthesis | High-concentration, high-purity stocks for forming specific receptor complexes. |
This application note, framed within a broader thesis on X-ray crystallography's pivotal role in structural biology, details key methodological breakthroughs and the protocols that enabled the determination of landmark receptor structures, driving modern drug discovery.
Milestone Receptor Structures & Impact
| Receptor (Year Solved) | PDB ID | Resolution (Å) | Key Insight for Drug Development | Experimental Breakthrough |
|---|---|---|---|---|
| Bacteriorhodopsin (1997) | 1AT9 | 2.5 | First view of a 7-transmembrane (7TM) fold; blueprint for GPCRs. | Use of lipidic cubic phase (LCP) for membrane protein crystallization. |
| β2-Adrenergic Receptor (2007) | 2RH1 | 3.4 | First human GPCR structure; revealed ligand-binding pocket. | Receptor-T4 lysozyme fusion protein to enhance crystal contacts. |
| A2A Adenosine Receptor (2008) | 3EML | 2.6 | High-resolution GPCR structure; enabled structure-based design of antagonists. | Fusion with apocytochrome b562RIL (BRIL) and high-affinity ligand. |
| TRPV1 Ion Channel (2013) | 3J5P | 3.4 | First high-res structure of a TRP channel; mechanism of capsaicin sensing. | Single-particle cryo-EM and crystallography hybrid approach. |
| μ-Opioid Receptor (2012) | 4DKL | 2.8 | Target of morphine/fentanyl; revealed opioid binding site for safer analgesic design. | Antibody fragment (nanobody) stabilization for crystallization. |
Detailed Experimental Protocol: GPCR-T4 Lysozyme Fusion Crystallography
This protocol was foundational for the β2-adrenergic receptor (β2AR) structure.
1. Construct Engineering & Expression
- Cloning: Engineer a fusion gene inserting T4 lysozyme (T4L) into the intracellular loop 3 (ICL3) of the human β2AR gene to rigidify the receptor.
- Expression System: Use baculovirus-mediated expression in Spodoptera frugiperda (Sf9) insect cells.
- Purification: Solubilize membranes in n-dodecyl-β-D-maltopyranoside (DDM)/cholesteryl hemisuccinate (CHS). Purify via immobilized metal affinity chromatography (IMAC) using a C-terminal His-tag, followed by ligand-affinity chromatography.
2. Crystallization via Lipid Cubic Phase (LCP)
- Reconstitution: Mix purified β2AR-T4L fusion protein (~40 mg/mL) with molten monoolein (lipid) at a 60:40 (w/w) protein:lipid ratio using a mechanical syringe mixer.
- Crystallization Setup: Dispense 50 nL LCP boluses onto glass sandwich plates using an LCP robot. Overlay each bolus with 800 nL of precipitant solution containing:
- 100 mM HEPES pH 7.5
- 1.0-1.2 M Ammonium sulfate
- 2-5% (v/v) PEG 400
- 5-10 mM ligand (e.g., timolol)
- Incubation: Incubate plates at 20°C. Microcrystals appear in 3-7 days.
3. Data Collection & Processing
- Harvesting: Harvest microcrystals directly from the LCP using 50-100 μm MiTeGen micromesh loops.
- Cryo-cooling: Flash-cool in liquid nitrogen without additional cryoprotectant.
- X-ray Source: Use a micro-focus beamline at a synchrotron (e.g., APS, SSRL).
- Data Collection: Collect ~1800 diffraction images with 0.2-0.5° oscillation. Due to small crystal size, merge data from multiple crystals.
- Processing: Index, integrate, and scale data with HKL-3000 or XDS. Use molecular replacement with bacteriorhodopsin and T4L as search models in Phaser.
Visualization of Key Concepts
Title: GPCR Crystallography Workflow
Title: Simplified GPCR Signaling Pathway
The Scientist's Toolkit: Essential Research Reagents
| Reagent / Material | Function in Receptor Crystallography |
|---|---|
| Monoolein (9.9 MAG) | Lipid forming the lipidic cubic phase (LCP) matrix, mimicking the native membrane environment for crystal growth. |
| n-Dodecyl-β-D-Maltopyranoside (DDM) | Mild, non-ionic detergent used to solubilize membrane proteins from lipid bilayers while maintaining stability. |
| Cholesteryl Hemisuccinate (CHS) | Cholesterol analog added to detergents to enhance stability and functionality of many receptors during purification. |
| T4 Lysozyme (T4L) | Soluble protein domain fused into receptor loops to provide rigid, hydrophilic surfaces for crystal lattice contacts. |
| Nanobodies (e.g., Nb80) | Recombinant single-domain antibodies that bind and stabilize specific active or inactive receptor conformations. |
| High-Affinity Antagonist/Agonist | Small molecule ligand used to lock the receptor in a uniform conformation throughout purification and crystallization. |
| HEPES Buffer (pH 7.5) | Standard physiological pH buffer used in purification and crystallization screens to maintain protein integrity. |
| Ammonium Sulfate | Common precipitating salt used in crystallization screens to induce protein supersaturation and crystal nucleation. |
Within the broader thesis on X-ray crystallography for receptor structure determination, this application note details the biophysical and biochemical prerequisites that make a receptor sample amenable to high-resolution crystallization. Success in crystallography is not merely a function of crystallization screens; it is fundamentally predicated on the inherent properties of the purified receptor.
Quantitative Properties of Crystallization-Ready Receptors
The following table summarizes key quantitative metrics correlated with successful crystallization.
Table 1: Ideal Biophysical and Biochemical Parameters for Receptors
| Parameter | Ideal Range / Target | Measurement Technique | Rationale |
|---|---|---|---|
| Purity | >95% (single band on SDS-PAGE) | SDS-PAGE, SEC-MALS, Mass Spectrometry | Homogeneity is critical for uniform lattice packing. |
| Monodispersity | Polydispersity Index (PDI) <20% | Dynamic Light Scattering (DLS) | Indicates a uniform population of particles in solution. |
| Stability | Melting Temperature (Tm) >45°C; low aggregation over 24-48h at 4-20°C | Differential Scanning Fluorimetry (DSF), SEC, DLS | Stable protein resists denaturation during crystallization trials. |
| Concentration | 5 - 20 mg/mL (depending on size) | UV absorbance, Bradford assay | High concentration needed for nucleation, but must be below aggregation threshold. |
| Sample Buffer | Low salt (<500 mM NaCl), minimal additives, non-ionic detergent if membrane protein | Conductivity, analytical SEC | Simplifies crystallization condition screening; reduces confounding factors. |
| Post-Translational Modifications | Homogeneous (e.g., uniform glycosylation) | LC-MS, Glycan analysis | Heterogeneity inhibits ordered crystal packing. |
Core Experimental Protocols
Protocol 1: Assessing Monodispersity via Dynamic Light Scattering (DLS)
Objective: To determine the hydrodynamic radius (Rh) and size distribution of the purified receptor sample.
- Sample Preparation: Centrifuge the receptor sample (≥ 0.5 mg/mL) at 15,000 x g for 10 minutes at 4°C to remove any large aggregates or dust.
- Instrument Setup: Load the supernatant into a low-volume quartz cuvette. Equilibrate the DLS instrument to the sample temperature (typically 4°C or 20°C).
- Data Acquisition: Perform a minimum of 10-12 measurements, each lasting 10 seconds. Repeat for at least three different sample positions (if using a manual instrument).
- Data Analysis: Use the instrument software to calculate the intensity-based size distribution. The primary peak should account for >85% of the intensity. Calculate the Polydispersity Index (PDI) or % polydispersity. A single, sharp peak with PDI <0.2 (or %Pd <20%) is indicative of a monodisperse sample suitable for crystallization.
Protocol 2: Thermostability Assessment via Differential Scanning Fluorimetry (DSF)
Objective: To determine the melting temperature (Tm) and identify ligands or buffer conditions that stabilize the receptor.
- Dye and Sample Preparation: Prepare a 100X stock of a fluorescent dye (e.g., SYPRO Orange) in DMSO. Dilute the receptor to 1-5 µM in the crystallization buffer (final volume 20 µL per well).
- Plate Setup: In a 96-well PCR plate, mix 18 µL of protein sample with 2 µL of 10X dye stock (final 1X dye). For ligand screening, pre-mix protein with a 5-10 fold molar excess of ligand. Include a buffer-only control.
- Run: Seal the plate and centrifuge briefly. Load into a real-time PCR instrument. Ramp temperature from 20°C to 95°C at a rate of 1°C per minute, with fluorescence measurement (ROX or FAM channel) at each interval.
- Analysis: Plot fluorescence vs. temperature. The Tm is the inflection point of the resulting sigmoidal curve, calculated by taking the first derivative (dF/dT) and identifying the peak. An increase in Tm of >2°C upon ligand binding is a positive indicator of stabilization.
Protocol 3: High-Throughput Crystallization Screening (Sitting Drop Vapor Diffusion)
Objective: To empirically identify initial crystallization conditions for a receptor meeting the prerequisites in Table 1.
- Plate Preparation: Use a 96-well sitting drop crystallization tray. Fill the reservoir wells with 50-80 µL of screening solution from commercial sparse matrix screens (e.g., JCSG+, MemGold, PEG/Ion).
- Drop Setup: Using an automated liquid handler or manual pipette, dispense 100-400 nL of receptor sample and an equal volume of reservoir solution onto the crystallization plate's sub-well slide or bridge. Mix by pipetting gently.
- Sealing and Incubation: Seal the plate with a clear transparent tape. Incubate at a constant temperature (e.g., 4°C, 20°C) in a vibration-free environment.
- Imaging and Scoring: Image drops at regular intervals (days 1, 3, 7, 14, 30) using an automated plate imager. Score hits based on morphology: single, well-faceted crystals >50 µm are optimal; microcrystals, spherulites, or phase separation require optimization.
Visualizations
Diagram 1: Receptor Crystallization Workflow
Diagram 2: Ligand Stabilization & Crystallization Pathway
The Scientist's Toolkit: Key Research Reagent Solutions
Table 2: Essential Reagents for Receptor Crystallography
| Reagent / Material | Function & Rationale |
|---|---|
| Detergents (DDM, LMNG, OG) | Essential for solubilizing and stabilizing membrane proteins without denaturation. Critical for maintaining native conformation. |
| Stabilizing Ligands (small molecules, peptides) | Binds the receptor's active site, reducing conformational flexibility and increasing thermal stability (higher Tm). |
| Affinity Tags (His-tag, GST, MBP) | Enables rapid, high-yield purification. Often cleaved off post-purification to improve crystallization chances. |
| Protease Inhibitor Cocktails | Prevents proteolytic degradation during purification, ensuring a homogeneous, full-length sample. |
| Phospholipids / Cholesterol | Added to purification buffers for membrane proteins to mimic the native lipid environment and enhance stability. |
| Reducing Agents (TCEP, DTT) | Maintains cysteine residues in reduced state, preventing disulfide-mediated aggregation. |
| Sparse Matrix Screening Kits (JCSG+, PEGs, MembFac) | Pre-formulated suites of chemical conditions to empirically probe a vast crystallization space with minimal sample. |
| Crystallization Plates (Sitting Drop, LCP) | Specialized plates enabling nanoliter-scale vapor diffusion or lipidic cubic phase experiments. |
| SYPRO Orange Dye | Environment-sensitive fluorescent dye used in DSF to monitor protein unfolding as a function of temperature. |
| Cryoprotectants (Glycerol, Ethylene Glycol) | Added to crystal harvest solution to displace water and prevent ice formation during flash-cooling in liquid nitrogen. |
Within the context of X-ray crystallography for receptor structure determination, the advent of modern X-ray sources and detectors has revolutionized structural biology. Third- and fourth-generation light sources, coupled with high-speed data collection systems, enable the determination of macromolecular structures at unprecedented resolution and temporal scales. This is critical for drug development, allowing for the visualization of receptor-ligand interactions and conformational dynamics.
Synchrotrons (Third-Generation)
Synchrotron facilities generate intense, tunable X-rays via the acceleration of electrons in storage rings. Beamlines are specialized for macromolecular crystallography (MX), offering micro-focus capabilities for small crystals.
Table 1: Key Parameters of Modern Synchrotron Beamlines (Representative Examples)
| Parameter | ESRF (ID30B) | APS (GM/CA 23-ID-D) | SPring-8 (BL41XU) |
|---|---|---|---|
| Beam Size (µm) | 10 x 10 (min) | 5 x 7 (min) | 10 x 10 (min) |
| Photon Flux (ph/s) | ~5 x 10¹² | ~1 x 10¹³ | ~1 x 10¹³ |
| Energy Range (keV) | 6 - 20 | 6.5 - 19 | 6.5 - 18 |
| Detector Type | DECTRIS EIGER2 X 16M | DECTRIS EIGER2 X 9M | DECTRIS PILATUS3 6M |
| Key Application | High-throughput, room-temperature | Micro-crystallography, serial crystallography | High-resolution, time-resolved studies |
Protocol 1.1: Standard Data Collection at a Synchrotron MX Beamline
- Sample Mounting: Flash-cool the crystal in a cryo-loop (100K N₂ stream) or mount in a room-temperature capillary/holder for serial experiments.
- Beam Alignment: Use on-axis viewing to center the crystal in the X-ray beam. For micro-beams, employ raster scanning to find the best-diffracting region.
- Data Collection Strategy: Use software (e.g., E DNA, BEST) to determine optimal oscillation range, exposure time, and total rotation. Typical values: 0.1° oscillation, 0.01-0.1s exposure per image, 180° total rotation.
- Data Processing: Auto-process stream with XDS, Dials, or autoPROC. Merge and scale datasets with Aimless (CCP4) or XSCALE.
X-ray Free-Electron Lasers (XFELs) (Fourth-Generation)
XFELs produce ultra-bright, femtosecond X-ray pulses via self-amplified spontaneous emission (SASE). This enables "diffraction-before-destruction," allowing data collection from nanocrystals and at physiological temperatures.
Table 2: Key Parameters of Major XFEL Facilities
| Parameter | LCLS (MFX) | SACLA (BL3) | European XFEL (SPB/SFX) |
|---|---|---|---|
| Pulse Duration | 10 - 50 fs | 10 fs | 10 - 100 fs |
| Peak Brightness (ph/s/mm²/mrad²/0.1%BW) | ~1 x 10³³ | ~1 x 10³³ | ~5 x 10³³ |
| Repetition Rate | 120 Hz | 60 Hz | Up to 4.5 MHz (burst mode) |
| Typical Detector | CSPAD 2.3M | MPCCD Octal | AGIPD 1M |
| Key Application | Time-resolved SFX, enzyme dynamics | Nano-crystallography, single-particle imaging | High-throughput SFX, molecular movies |
Protocol 1.2: Serial Femtosecond Crystallography (SFX) at an XFEL
- Sample Delivery:
- Liquid Jet: Prepare a suspension of micro/nanocrystals (≥10⁶ crystals/µL) in mother liquor or lipidic cubic phase (LCP). Inject via a gas dynamic virtual nozzle (GDVN) or LCP injector at ~10 µL/min.
- Fixed Target: Deposit crystals on a silicon chip or polymer mesh (e.g., SPINE standard). Scan the chip through the pulsed beam.
- Beam Setup: Monitor pulse energy and focus. Typical beam size: 1-10 µm.
- Data Collection: Trigger the detector (e.g., AGIPD) to record diffraction patterns from single pulses hitting individual crystals. Collect 10⁴ - 10⁶ "hits."
- Data Processing ("Hit Finding" & Indexing):
- Use Cheetah for real-time hit finding and filtering.
- Index and integrate hits using CrystFEL suite (e.g., indexamajig with DirAx, MOSFLM, or XDS).
- Merge partial patterns from multiple crystals into a complete dataset using partialator.
High-Speed X-ray Detectors
Modern detectors are hybrid pixel array detectors (HPADs) offering noise-free, high-frame-rate readout.
Table 3: Comparison of Key HPADs for MX/SFX
| Detector Model | Key Technology | Pixel Size (µm) | Max Frame Rate (Hz) | Key Feature |
|---|---|---|---|---|
| DECTRIS EIGER2 | Si sensor, CMOS | 75 x 75 | 3,000 (4M) | Zero-noise, high duty cycle |
| DECTRIS PILATUS3 | Si sensor, CMOS | 172 x 172 | 250 (6M) | Single-photon counting |
| AGIPD (European XFEL) | Si sensor, CMOS ASIC | 200 x 200 | 6,500 (1M) | Adaptive gain, high dynamic range |
| Jungfrau (SwissFEL) | Si sensor, CMOS | 75 x 75 | 2,000 (4M) | Charge-integrating, automatic gain switching |
Protocol 2.1: Detector Calibration and Optimization for Time-Resolved Studies
- Flat-Field Correction: Collect flat images (no beam) and uniform illumination images to correct for pixel-to-pixel sensitivity variations.
- Geometry Calibration: Use a known calibration standard (e.g., CeO₂ powder) to refine the detector distance, beam center, and tilts.
- Trigger Synchronization (for pump-probe): Precisely synchronize detector readout with optical laser pump pulse. Jitter must be < pulse duration. Use delay generators to scan time delays from ps to ms.
- Frame Rate Optimization: Adjust frame rate to match source (e.g., 4.5 MHz burst mode at European XFEL requires special burst sequencing). For synchrotrons, match readout to shutterless continuous rotation.
High-Speed Data Collection and Management
Protocol 3.1: Workflow for High-Throughput, High-Speed Crystallography
- Automated Sample Handling: Use sample changers (e.g., CATS, SampleRail) or fixed-target scanners for rapid crystal screening.
- On-the-Fly Data Processing: Implement real-time processing pipelines (e.g., Fast DP, autoPROC, XDSAPP) to assess data quality (resolution, completeness, mosaicity) immediately after collection.
- Remote Access & Data Transfer: Use high-speed networks (e.g., ESRF Data Portal, Globus) to transfer terabytes of raw data to home institutions. Implement cloud or HPC resources for downstream processing.
- Metadata Management: Adopt standardized data formats (e.g., imgCIF/NeXus) to ensure all experimental parameters (beam, detector, sample) are preserved.
Modern X-ray Crystallography Workflow
The Scientist's Toolkit: Research Reagent Solutions
Table 4: Essential Materials for Modern X-ray Crystallography Experiments
| Item | Function & Application |
|---|---|
| Lipidic Cubic Phase (LCP) Matrix (e.g., Monoolein) | A membrane-mimetic matrix for growing and delivering crystals of membrane proteins (GPCRs, ion channels) for both synchrotron and SFX studies. |
| High-Viscosity Injectors (e.g., Gas Dynamic Virtual Nozzle - GDVN, LCP Injector) | Delivers a continuous, fine stream of crystal suspension to an XFEL beam for SFX, minimizing sample consumption. |
| Micro-Mesh Sample Grids (e.g., MiTeGen MicroMeshes) | Silicon-based or polymer fixed targets for high-throughput room-temperature data collection and SFX. Allows pre-screening. |
| High-Performance Cryoprotectants (e.g., Paratone-N, LV CryoOil) | Prevents ice formation during flash-cooling at synchrotrons, preserving crystal order and diffraction quality. |
| Photocaged Compounds (e.g., NPE-caged ATP, DMNPE-caged glutamate) | Biologically inert precursors that release active ligands upon UV illumination, enabling time-resolved pump-probe studies of receptor dynamics. |
| Ultra-Low Background Sample Loops/Mounts (e.g., Kapton, Litholoops) | Minimizes background scattering, critical for micro-crystallography and data quality from small crystals. |
Time-Resolved Pump-Probe Experiment Flow
From Gene to 3D Map: A Step-by-Step Workflow for Receptor Structure Determination
Within the broader thesis on X-ray crystallography for receptor structure determination, obtaining high-quality, homogeneous, and stable protein samples is the critical first step. The inherent instability of membrane receptors and the complex folding of many soluble receptors present significant bottlenecks. This document outlines contemporary strategies and detailed protocols to overcome these challenges, enabling the transition from gene to diffraction-quality crystals.
Selection of an appropriate expression system is dictated by the receptor's complexity, required post-translational modifications, and yield needs.
Table 1: Quantitative Comparison of Expression Systems for Challenging Receptors
| Expression System | Typical Yield (mg/L) | Cost (Relative) | Timeline (Days) | Key Advantages | Key Limitations | Best Suited For |
|---|---|---|---|---|---|---|
| E. coli (BL21) | 5-50 (soluble), 1-20 (inclusion bodies) | Low | 4-7 | Rapid, high yield, easy scale-up | Lack of eukaryotic PTMs, often misfolded membrane proteins | Soluble domains, prokaryotic receptors, proteins for refolding |
| Baculovirus/Insect (Sf9) | 1-10 | Medium | 21-28 | Proper folding, essential PTMs (glycosylation), handles complexity | Lower yield, longer timeline, more complex | Full-length GPCRs, ion channels, large soluble complexes |
| Mammalian (HEK293, Expi293F) | 0.5-5 | High | 21-30 | Native-like folding and PTMs, correct membrane insertion | Highest cost, lower yield, technical complexity | Human receptors requiring native lipid environment and PTMs |
| Cell-Free (Wheat Germ, E. coli) | 0.1-1 (soluble) | Very High | 1-2 | Rapid, incorporates non-natural amino acids, toxic proteins possible | Very low yield, extremely high cost per mg | High-throughput screening, toxic proteins, isotopic labeling |
Detailed Protocols
Protocol 3.1: High-Yield Expression of a Soluble Receptor Extracellular Domain inE. coli
Objective: Produce the ligand-binding domain (e.g., TNF receptor family) for crystallization screening.
Materials (Research Reagent Solutions):
- pET-28a(+) Vector: Provides T7 promoter for strong, inducible expression and an N-terminal His-tag.
- BL21(DE3) Rosetta2 E. coli strain: Supplies rare tRNAs for eukaryotic codons and T7 RNA polymerase.
- 2xYT Autoinduction Media: Allows culture growth to high density before protein production auto-initiates.
- Lysis Buffer: 50 mM Tris pH 8.0, 500 mM NaCl, 20 mM Imidazole, 1 mM PMSF, 1 mg/mL Lysozyme.
- Ni-NTA Agarose Resin: Immobilized metal affinity chromatography (IMAC) resin for His-tag purification.
- Size Exclusion Chromatography (SEC) Buffer: 20 mM HEPES pH 7.5, 150 mM NaCl, 1 mM TCEP (for stability).
Method:
- Cloning: Clone the gene of interest into the pET-28a(+) vector, encoding an N-terminal 6xHis tag and TEV protease site.
- Transformation: Transform chemically competent BL21(DE3) Rosetta2 cells. Select on kanamycin (50 µg/mL) and chloramphenicol (34 µg/mL) plates.
- Expression: Inoculate a 50 mL starter culture in 2xYT with antibiotics. Grow overnight at 37°C, 220 rpm. Dilute 1:100 into 1 L of autoinduction media with antibiotics. Incubate at 37°C until OD600 ~0.6, then reduce temperature to 18°C and incubate for 18-24 hours.
- Harvest: Pellet cells at 5,000 x g for 20 min at 4°C. Cell pellets can be stored at -80°C.
- Lysis: Thaw pellet on ice. Resuspend in 40 mL Lysis Buffer per liter of culture. Incubate on ice for 30 min. Sonicate on ice (5 cycles of 1 min on, 1 min off). Clarify lysate by centrifugation at 40,000 x g for 45 min at 4°C.
- IMAC Purification: Filter supernatant (0.45 µm) and load onto a 5 mL Ni-NTA column pre-equilibrated with Lysis Buffer (without lysozyme/PMSF). Wash with 10 column volumes (CV) of Wash Buffer (50 mM Tris pH 8.0, 500 mM NaCl, 40 mM Imidazole). Elute with 5 CV of Elution Buffer (50 mM Tris pH 8.0, 500 mM NaCl, 300 mM Imidazole).
- Tag Cleavage & Dialysis: Add TEV protease (1:50 mass ratio) to the eluate and dialyze overnight at 4°C into SEC Buffer.
- Final Purification: Pass dialyzed sample over fresh Ni-NTA to capture cleaved tag and protease. Collect flow-through. Concentrate to <5 mL using a 10 kDa MWCO centrifugal concentrator. Inject onto a HiLoad 16/600 Superdex 75 pg column pre-equilibrated with SEC Buffer. Pool monodisperse peak fractions, assess purity by SDS-PAGE, concentrate to 10 mg/mL, aliquot, and flash-freeze.
Protocol 3.2: Expression and Purification of a GPCR using Baculovirus/Insect Cell System
Objective: Produce a functional, full-length human GPCR for structural studies.
Materials (Research Reagent Solutions):
- pFastBac1 Vector: Baculovirus transfer vector for gene integration into bacmid.
- DH10Bac E. coli Competent Cells: Contain the bacmid and helper plasmid for transposition.
- Sf9 Insect Cells: Grow in suspension in serum-free media (e.g., SF-900 II).
- Cellfectin II Reagent: Lipid-based transfection reagent for insect cells.
- Lysis/Dounce Buffer: 20 mM HEPES pH 7.5, 500 mM NaCl, 10% Glycerol, 1x Protease Inhibitor Cocktail, 1 µg/mL Leupeptin.
- n-Dodecyl-β-D-Maltopyranoside (DDM): Mild, non-ionic detergent for membrane protein extraction.
- Cholesteryl Hemisuccinate (CHS): Cholesterol analog that stabilizes many GPCRs.
- Ligand Affinity Resin: For stabilization and purification (e.g., alprenolol-sepharose for β-adrenergic receptors).
Method:
- Bacmid Generation: Clone GPCR gene, often with a C-terminal 8xHis tag and a stabilizing fusion protein (e.g., T4 Lysozyme in intracellular loop 3), into pFastBac1. Transform into DH10Bac cells. Select white colonies on triple antibiotic/IPTG/X-gal plates. Isolate bacmid DNA.
- P1 Virus Generation: Seed Sf9 cells (0.5 x 10^6 cells/mL) in a 6-well plate. Transfect with 1 µg bacmid DNA using Cellfectin II. Incubate at 27°C for 72-96 hours. Harvest supernatant (P1 stock).
- P2 Virus Amplification: Infect 50 mL of Sf9 cells (2 x 10^6 cells/mL) with 0.5-1 mL P1 stock. Incubate 48-72 hours. Harvest supernatant (P2 stock). Titer via plaque assay or flow cytometry.
- Large-Scale Expression: Infect 1 L of Sf9 cells (2 x 10^6 cells/mL) with P2 virus at an MOI of 1-5. Incubate for 48 hours at 27°C. Harvest cells by centrifugation (1,000 x g, 20 min).
- Membrane Preparation: Resuspend cell pellet in ice-cold Dounce Buffer. Dounce homogenize. Centrifuge at 1,000 x g to remove debris. Ultracentrifuge supernatant at 150,000 x g for 45 min. Resuspend membrane pellet in Buffer + 1 mM ligand (if available). Flash-freeze in aliquots.
- Solubilization: Thaw membranes. Add DDM/CHS mixture to final concentrations of 1% DDM and 0.1% CHS. Stir gently at 4°C for 2 hours. Ultracentrifuge at 150,000 x g for 45 min to remove insoluble material.
- Affinity Purification: Pass supernatant over 2 mL ligand-affinity or Talon (Co2+ for His-tag) resin. Wash with 10 CV of Wash Buffer (20 mM HEPES pH 7.5, 500 mM NaCl, 0.05% DDM, 0.01% CHS, 10 mM Imidazole if using His-tag). Elute with Wash Buffer containing 200 mM Imidazole or 1 mM competing ligand.
- SEC and Stabilization: Inject purified receptor onto a Superose 6 Increase 3.2/300 column in SEC Buffer (20 mM HEPES pH 7.5, 150 mM NaCl, 0.025% DDM, 0.005% CHS, 1 µM stabilizing ligand). Pool monodisperse fractions, concentrate to 30-50 mg/mL, and proceed to crystallization trials.
Critical Visualization
Title: Receptor Purification Strategy Selection Workflow
Title: Multi-Factor GPCR Stabilization for Crystallography
Within the broader thesis on X-ray crystallography for receptor structure determination, the crystallization step represents the most critical and often limiting bottleneck. The transition from a purified, homogeneous protein sample to a well-ordered three-dimensional crystal suitable for diffraction is non-trivial. This application note details systematic methodologies for initial screening, iterative optimization, and the implementation of robotic automation to enhance the reproducibility, speed, and success rate of crystallization trials for challenging membrane and soluble receptors.
Crystallization Screening: The First Pass
The goal of initial screening is to empirically sample a broad landscape of chemical conditions to identify "hits"—conditions that yield microcrystals, phase separation, or promising precipitates.
Protocol: High-Throughput Sparse-Matrix Screening with Sitting Drop Vapor Diffusion
Objective: To identify initial crystallization conditions for a purified receptor (>95% purity, >5 mg/mL concentration).
Materials:
- Purified receptor sample in appropriate buffer.
- Commercial sparse-matrix screening kits (e.g., JCSG+, MemGold, MemMeso, PEG/Ion).
- 96-well sitting drop crystallization plates (2- or 3-reservoir).
- Sealing film or tape.
- Liquid handling robot (optional but recommended) or manual pipettes.
- Incubator or temperature-controlled environment (4°C, 20°C).
Procedure:
- Plate Preparation: Dispense 50-100 µL of each screening solution from the kit into the reservoir wells of the crystallization plate.
- Drop Setup: For each condition, mix the protein solution and reservoir solution in a defined ratio. A common ratio is 1:1 (e.g., 100 nL protein + 100 nL reservoir solution). For membrane proteins, a 2:1 ratio (protein:reservoir) is often used to maintain a higher lipid/protein ratio in the drop.
- Sealing: Carefully seal the plate with transparent, non-permeable sealing film.
- Incubation: Place the sealed plate in a vibration-free incubator at the target temperature (commonly 20°C and 4°C are run in parallel).
- Imaging: Use an automated imaging system to photograph drops at regular intervals (day 1, 3, 7, 14, 30). Manual inspection with a microscope is possible but less efficient.
Data Presentation: Typical Hit Rates from Sparse-Matrix Screens
Table 1: Representative Hit Rates for Different Receptor Classes
| Receptor Class | Typical Purity (%) | Concentration Range (mg/mL) | Avg. Hit Rate (%) (Crystal/Precipitate) | Primary Screen Examples |
|---|---|---|---|---|
| Soluble GPCRs (stabilized) | >98 | 20-50 | 5-15% | JCSG+, PEG/Ion, Morpheus |
| Membrane Proteins (Detergent-solubilized) | >95 | 5-20 | 1-5% | MemGold, MemMeso, MemStart+MemSys |
| Kinase Domains | >95 | 10-30 | 10-20% | PEG/Ion, JC SG+, Hampton Index |
| Nuclear Receptors (with ligand) | >98 | 15-40 | 10-25% | Wizard Classic, PEGRx |
From Hits to Diffraction-Quality Crystals: Optimization Strategies
Once a hit is identified, systematic optimization is performed to improve crystal size, morphology, and order.
Protocol: Grid Screen Optimization
Objective: To refine the chemical conditions around an initial hit.
Materials:
- Hit condition components (precipitant, salt, buffer, additive).
- Stock solutions for fine-gradient preparation.
- 24-well VDX plates (for hanging drop) or finer grid 96-well plates.
Procedure:
- Parameter Selection: Identify 2-3 key variables from the hit condition (e.g., precipitant concentration, pH, salt concentration).
- Grid Design: Create a 2D matrix varying the two most important parameters. For example, vary PEG 3350 concentration from 18% to 24% (x-axis) and pH from 6.0 to 7.0 (y-axis). A third variable (e.g., additive concentration) can be added as a third dimension.
- Plate Setup: Use a robotic liquid handler to prepare reservoir solutions with these fine gradients (e.g., 50 µL increments).
- Drop Setup: Set up hanging or sitting drops with a fixed protein:reservoir ratio (typically 1:1 or 2:1, total volume 0.5-2 µL).
- Monitoring: Image drops daily. Assess crystal growth, size, and shape.
Advanced Optimization Techniques
- Additive Screening: Incorporate a secondary additive screen (Hampton Additive Screen) into promising conditions from the grid screen. Additives can modify crystal packing.
- Microseeding: Prepare a seed stock from crushed microcrystals. Perform serial dilution. Introduce seeds into new drops of slightly less optimal (undernucleated) conditions to promote growth of fewer, larger crystals.
- Lipidic Cubic Phase (LCP) for Membrane Proteins: For intractable membrane proteins, in meso crystallization in LCP can be explored using specialized robots (e.g., NT8 LCP).
Harnessing Robotics for Reproducibility and Scale
Automation is indispensable for modern crystallography pipelines.
Robotic Workflow Components
- Liquid Handling: Precise, nanoliter-scale dispensing (e.g., Mosquito, Dragonfly, Formulatrix NTS).
- Automated Imaging: Scheduled, high-resolution drop imaging (e.g., RockImager, Formulatrix RI).
- Image Analysis: Machine-learning-based scoring of crystallization outcomes (e.g., CrystalX, UVP).
Table 2: Key Research Reagent Solutions & Robotic Tools
| Item Name | Category | Function/Benefit |
|---|---|---|
| MemGold & MemMeso Suites | Screening Kit | Pre-formulated sparse-matrix screens optimized for membrane proteins. |
| Morpheus HT-96 | Screening Kit | Screen based on mixing common precipitating agents & additives; high hit rate for soluble proteins. |
| Hampton Additive Screen | Optimization Kit | 96 unique additives to fine-tune molecular interactions and improve crystal quality. |
| Seed Bead Kit | Optimization Tool | Stainless steel beads for homogenizing microcrystals to create seed stock. |
| Mosquito Crystal | Robotics | SPT Labtech's nanoliter liquid handler for setting up 1000+ conditions/day. |
| RockImager 1000 | Imaging | Formulatrix's automated incubator/imager for time-lapse microscopy of crystallization plates. |
| LCP Injection Kit | Specialized Tool | For setting up in meso trials with viscous lipidic cubic phase material. |
Visualization of Workflows
Title: Crystallization Trial Workflow with Robotics
Title: Optimization Strategy Decision Tree
In X-ray crystallography for receptor structure determination, data collection is the critical bridge between crystal growth and structure solution. The quality of the collected diffraction data directly dictates the accuracy and interpretability of the final atomic model. This application note details modern strategies for optimizing three interdependent parameters: Resolution, Completeness, and Redundancy (Multiplicity), within the context of synchrotron-based macromolecular crystallography (MX).
Key Metrics and Their Interrelationship
Quantitative Targets for High-Quality Data
The following table summarizes benchmark values for key data collection metrics in receptor crystallography.
Table 1: Target Metrics for Receptor Structure Determination Data Sets
| Metric | Routine Structure | High-Resolution/Refinement | Molecular Replacement | Experimental Phasing (SAD/MAD) |
|---|---|---|---|---|
| Resolution Limit (Å) | ≤ 2.5 | ≤ 1.8 | ≤ 3.0 (Better if possible) | As high as possible (≤ 2.5) |
| Overall Completeness (%) | > 95% | > 99% | > 99% | > 99% (especially in outer shell) |
| Multiplicity (Redundancy) | > 4 | > 4 | > 6 | > 50 (per wavelength, for SAD) |
| ⟨I/σ(I)⟩ in Outer Shell | > 2.0 | > 1.5 | > 1.2 | > 1.2 (for anomalous signal) |
| Rmerge/Rmeas (%) | < 10% | < 6% | < 15% | < 10% (anomalous) |
| CC1/2 in Outer Shell | > 0.5 | > 0.3 | > 0.3 | > 0.3 (CCano > 0.3) |
The Resolution-Completeness-Redundancy Triangle
These three factors exist in a trade-off relationship, often constrained by experimental time and crystal lifetime.
Diagram Title: Trade-offs in Data Collection Metrics
Detailed Experimental Protocols
Protocol: Multi-Wedge, Inverse-Beam Data Collection for Anomalous Phasing
Objective: Maximize anomalous completeness and redundancy for SAD/MAD phasing from native sulfur or incorporated selenomethionine.
Materials: Cryo-cooled crystal, synchrotron beamline tuned to appropriate wavelength(s).
Workflow:
- Crystal Characterization: Perform a 10° test wedge. Analyze diffraction to determine resolution limit, spot shape, and anisotropy.
- Strategy Calculation: Use beamline software (e.g., EDNA, DOZOR) to predict completeness/redundancy. For anomalous signal:
- Set anomalous=True in strategy calculation.
- Target an overall anomalous redundancy > 50.
- Prioritize high completeness in low-resolution shells (< 5Å).
- Data Collection Execution:
- Collect a 360° dataset divided into 2-4 wedges.
- Between wedges, rotate the crystal by 180° around the spindle axis (inverse-beam geometry). This symmetrically samples Friedel mates, improving anomalous multiplicity.
- Adjust exposure time per image to achieve ⟨I/σ(I)⟩ > 1.2 in the outer shell.
- On-the-Fly Processing: Use fast pipelines (XDS, DIALS, autoPROC) to monitor key statistics (CC1/2, Rmerge, anomalous correlation) after each wedge. Decide whether to continue based on quality.
Diagram Title: Inverse-Beam Anomalous Data Collection Workflow
Protocol: High-Resolution, Hierarchical Data Collection
Objective: Push to the diffraction limit while managing radiation decay.
Workflow:
- Low-Dose, Wide Pass: Collect an initial 180° of data with attenuated beam (10-20% flux) and wide rotation (0.5-1.0°)/image. This yields a complete, moderate-resolution data set for molecular replacement.
- Assess Damage: Compare first and last 90° of the low-dose set via Rmerge to estimate decay.
- High-Resolution Wedge: Without moving the crystal, collect a narrow, high-dose wedge (e.g., 30-50° total) at the end of the crystal's life, using fine slicing (0.1-0.2°)/image, to capture the highest resolution data.
- Merge Datasets: Scale and merge the low-dose and high-dose passes together.
The Scientist's Toolkit: Research Reagent Solutions
Table 2: Essential Materials for Optimized X-ray Data Collection
| Item | Function & Rationale |
|---|---|
| Cryoprotectant Solutions (e.g., Paratone-N, LV CryoOil, glycerol mixtures) | Prevents ice formation during cryo-cooling, which destroys crystal order and increases background scattering. |
| High-Precision Sample Pins & Bases (e.g., SPINE standard, MiTeGen loops) | Ensures precise, repeatable crystal centering and minimizes mechanical shock during handling and goniometer movements. |
| Helium Cryo-Stream (700 Series) | Maintains crystal at stable ~100 K temperature throughout data collection, drastically reducing radiation damage. |
| Beamline Attenuators (e.g., foil sets, gas-filled) | Allows reduction of incident beam intensity to enable low-dose strategy and manage dose for sensitive crystals. |
| Fast Hybrid Pixel Detectors (e.g., DECTRIS EIGER, JUNGFRAU) | Enables shutterless, fine-sliced data collection with high dynamic range and negligible readout noise, maximizing speed and data quality. |
| Automated Sample Changers (e.g., CATS, SAM) | Increases throughput and allows unattended, multi-crystal screening to identify the best diffracting specimen. |
| Anomalous Scatterers (Selenomethionine, Halide Soaks, Lanthanides) | Provides phasing power via anomalous dispersion for solving the phase problem. |
| Data Processing Suites (XDS, DIALS, autoPROC, HKL-3000) | Integrated software for real-time strategy assessment, data integration, scaling, and merging. |
Within the trajectory of a thesis on X-ray crystallography for receptor-ligand complex determination, this section addresses the central computational and experimental challenge: determining phase angles from measured diffraction amplitudes. This phase problem is the gatekeeper to obtaining an interpretable electron density map. The choice of strategy is dictated by the availability of a homologous structure or the presence of anomalous scatterers in the crystal.
Molecular Replacement (MR)
MR is the method of choice when a structurally similar model (>25-30% sequence identity) is available. It involves orienting and positioning this known model within the unit cell of the target crystal.
Protocol: Standard MR Workflow Using PHASER
Materials & Software:
- Target structure factor amplitudes (
.mtzfile). - Search model (
.pdbfile), often trimmed of flexible loops and side chains. - MR software (e.g., PHASER, MOLREP).
- High-performance computing cluster.
Procedure:
- Search Model Preparation: Use CHAINSAW or similar to prune the homologous model to match the target sequence. Alternatively, generate an ensemble of models.
- Data Preparation: Ensure the target
.mtzfile contains intensities or amplitudes (FP,SIGFP). - Rotation Function: Execute a cross-rotation search to determine the correct orientation of the search model in the target cell. In PHASER, this is the
ROTATIONstep. - Translation Function: For each top rotation solution, perform a translation search to locate the model's position. In PHASER, the
TRANSLATIONstep. - Packing Analysis: Check for steric clashes between symmetry-related molecules. Solutions with poor packing are discarded.
- Rigid-Body Refinement: Refine the positioned model as a rigid body to optimize fit to the data. The best solution is judged by log-likelihood gain (LLG), translation function Z-score (TFZ), and R-factors.
Research Reagent Solutions (Molecular Replacement)
| Reagent/Solution | Function in MR Context |
|---|---|
| Homologous Structure (PDB ID: XXXX) | Serves as the initial phasing model; accuracy dictates MR success. |
| Sequence Alignment Software (Clustal Omega, MUSCLE) | Ensures accurate mapping between search model and target sequences. |
| Model Pruning Scripts (CHAINSAW, Sculptor) | Removes non-conserved regions to reduce model bias and noise. |
| MR Pipeline (PHASER-MR, BALBES) | Automated, integrated software for performing MR searches. |
Experimental Phasing: SAD/MAD
Single- or Multi-wavelength Anomalous Dispersion (SAD/MAD) is used when no prior model exists. It exploits anomalous scattering from incorporated heavy atoms (e.g., Se, Hg) or intrinsic sulfur atoms.
Protocol: SAD Phasing with Selenomethionine (SeMet) Protein
Materials & Software:
- Crystal of SeMet-substituted protein.
- Tunable synchrotron beamline.
- Data processing suite (XDS, autoPROC, HKL-3000).
- Phasing software (SHELXC/D/E, autosol in PHENIX).
Procedure:
- Data Collection: Collect a highly redundant single-wavelength dataset at the peak of the selenium absorption edge (~0.979 Å). Aim for high multiplicity and completeness.
- Data Processing & Scaling: Process images with an anomalous-aware pipeline. Output should contain merged
Fand anomalous differencesΔF(orF+andF-). - Anomalous Signal Analysis: Use SHELXC to assess the strength of the anomalous signal via
<d"/σ>and CCano statistics. - Substructure Determination: Locate Se atom positions using Patterson or direct methods (SHELXD, HySS).
- Phase Calculation & Density Modification: Calculate initial phases with SHELXE or similar. Apply density modification (solvent flattening, histogram matching) to improve phases. A figure of merit (FOM) >0.3 is promising.
- Model Building: Feed the improved electron density map into automated model building programs (Buccaneer, ARP/wARP).
Table 1: Quantitative Metrics for Successful SAD Phasing
| Metric | Target Value | Interpretation |
|---|---|---|
| Anomalous Correlation (CCano) | >30% (outer shell) | Strong anomalous signal present. |
| >1.0 | Significant anomalous scattering relative to error. | |
| Resolution Cutoff for Phasing | 2.5 - 3.0 Å (often) | Balance between completeness and signal strength. |
| Figure of Merit (FOM) after DM | >0.5 | High-quality, interpretable phases produced. |
| Number of Sites Found | Matches expected # of SeMet sites | Correct substructure solution. |
Model Building and Iterative Refinement
Initial phases yield an electron density map (ρ(x,y,z)) into which an atomic model is built, followed by cycles of refinement against the structure factors.
Protocol: Iterative Model Building and Refinement in COOT and PHENIX
Materials & Software:
- Initial electron density map (
.mtzor.mapfile). - Model building software (COOT).
- Refinement software (PHENIX.refine, REFMAC5).
Procedure:
- Automated Model Building: Run Buccaneer or ARP/wARP to build an initial backbone trace.
- Manual Building in COOT:
- Load the map and partial model.
- Use
Real Space Refine ZoneandRegularize Zoneto correct backbone and side chain geometry. - Place missing residues using
Find Fragmentsor manual building tools. - Fit ligands (e.g., drug candidates) into difference density (Fo-Fc and 2Fo-Fc maps).
- Refinement in PHENIX:
- Refine atomic coordinates, B-factors (ADP), and occupancies.
- Include TLS refinement for grouped atomic displacement.
- Validate geometry using MolProbity.
- Iteration: Repeat steps 2 and 3 until Rwork/Rfree converge and model geometry is optimized.
Table 2: Key Refinement and Validation Statistics
| Statistic | Ideal Target | Purpose & Significance |
|---|---|---|
| Rwork / Rfree | Gap < 5%; Absolute values depend on resolution. | Measures model fit to data; Rfree monitors overfitting. |
| RMSD Bonds (Å) | < 0.020 | Validates stereochemical quality of the model. |
| RMSD Angles (°) | < 2.0 | Validates geometric quality. |
| Ramachandran Favored (%) | > 97% | Assesses backbone torsion angle plausibility. |
| Clashscore | < 5 | Measures severe atomic overlaps. |
Visualizations
Title: Molecular Replacement Computational Workflow
Title: SAD Experimental Phasing Pipeline
Title: Iterative Model Building and Refinement Cycle
Within the context of X-ray crystallography for receptor structure determination, Step 5 represents the critical phase where an initial structural model is transformed into a chemically accurate and reliable representation. This stage is paramount for research in structural biology and structure-based drug design, ensuring that molecular interactions and binding site architectures are correctly interpreted. Refinement involves the iterative adjustment of atomic coordinates and temperature factors to minimize the disparity between the observed diffraction data (Fo) and the calculated data (Fc). Concurrent model validation employs a suite of computational and statistical tools to assess the stereochemical quality and overall plausibility of the refined model, guarding against over-interpretation of the electron density map.
Core Principles and Quantitative Benchmarks
Refinement Metrics and Targets
Refinement aims to optimize two key agreement indices: the R-factor and the free R-factor (Rfree). Rfree, calculated from a subset of reflections excluded from refinement, is the primary indicator of model overfitting.
Table 1: Key Refinement and Validation Metrics
| Metric | Target Value (High-Resolution <2.0 Å) | Purpose & Interpretation |
|---|---|---|
| R-factor (Rwork) | < 0.20 (typically 0.15-0.18) | Measures agreement between model and used data. Lower is better. |
| Free R-factor (Rfree) | < 0.25 (within ~0.05 of Rwork) | Measures agreement for unused data. Guards against overfitting. |
| RMSD Bonds | < 0.020 Å | Root-mean-square deviation from ideal bond lengths. |
| RMSD Angles | < 2.0° | Root-mean-square deviation from ideal bond angles. |
| Ramachandran Favored | > 98% | Percentage of residues in core conformational regions. |
| Ramachandran Outliers | < 0.2% | Percentage of residues in disallowed regions. Should be minimal. |
| Clashscore | < 5 | Measures number of serious steric overlaps per 1000 atoms. |
| MolProbity Score | < 1.5 (90th percentile) | Overall model quality score combining sterics and rotamers. |
Electron Density Map Analysis
The model must be supported by continuous electron density. The real-space correlation coefficient (RSCC) measures how well the model fits the density at each residue, with values >0.8 indicating good fit.
Detailed Experimental Protocols
Protocol 1: Iterative Refinement Cycle Using Phenix
This protocol describes a standard refinement cycle using the Phenix software suite, incorporating simulated annealing and individual B-factor refinement.
Materials & Reagents:
- Refinement Software: Phenix.refine (current version).
- Input Files: An initial atomic model in PDB format and processed structure factor data (merged, scaled MTZ file).
- Hardware: High-performance computing cluster or workstation.
Procedure:
- Preparation: Generate initial files (
model.pdb,data.mtz). Define the refinement test set (typically 5-10% of reflections) if not already present. - First Refinement Cycle: Execute a conservative refinement run. This performs rigid-body refinement to correct potential large-scale misplacements.
- Iterative Model Building & Refinement:
a. Coordinate Refinement: Run with atomic coordinate optimization.
b. B-Factor Refinement: Refine atomic displacement parameters (ADPs).
c. Manual Model Correction: Open the refined model and updated
2mFo-DFcandmFo-DFcmaps in Coot. Correct side-chain rotamers, fit ambiguous loops, add/remove water molecules, and place alternate conformations where density supports them. Correct any Ramachandran outliers. d. Simulated Annealing: Periodically, to escape local minima, employ simulated annealing. - Addition of Detailed Chemistry: In later cycles, add hydrogen atoms (at riding positions) and refine with TLS (Translation-Libration-Screw-rotation) parameters to model domain motions.
- Convergence: Repeat step 3 until Rwork and Rfree no longer decrease significantly and the model validation metrics (Table 1) are satisfied.
Protocol 2: Comprehensive Model Validation with MolProbity and PDB-REDO
This protocol ensures the final model meets community standards for chemical accuracy.
Procedure:
- Run MolProbity Server Validation:
- Upload the final
model.pdbfile to the MolProbity web server (or use the integrated validation in Phenix). - Analyze the output report. Pay critical attention to:
- Ramachandran plot (reduce outliers).
- Rotamer outliers (flip Asn/Gln/His sidechains if needed).
- Clashscore (resolve severe atomic overlaps in Coot).
- Upload the final
- Electron Density Validation:
- In Phenix, calculate the real-space correlation coefficient (RSCC) for each residue.
- Inspect residues with RSCC < 0.8. Rebuild or reconsider their modeling.
- Cross-Validation with PDB-REDO:
- Submit the model and structure factors to the PDB-REDO web server for an automated re-refinement and validation check. Compare the server's output model and validation statistics with your own.
- Final Deposition Check: Prior to PDB submission, run the ADIT/OneDep validation server to ensure the model passes all internal PDB standards.
Visualizing the Refinement & Validation Workflow
Diagram 1: Refinement and Validation Iterative Cycle
The Scientist's Toolkit: Research Reagent Solutions
Table 2: Essential Software and Resources for Step 5
| Item | Function & Purpose |
|---|---|
| Phenix Software Suite | Integrated platform for macromolecular structure determination. Its phenix.refine module is the industry standard for high-performance, automated refinement. |
| Coot | Interactive molecular graphics tool for model building, correction, and validation. Essential for real-space refinement and fixing local model errors. |
| MolProbity Server | Web-based validation system providing rigorous analysis of stereochemistry, clashes, and rotamers. Generates the MolProbity Score. |
| PDB-REDO Server | Automated pipeline that re-refines models against original data using modern methods, providing an objective quality check and potential improvement. |
| CCP4 Software Suite | Alternative/companion suite to Phenix. Contains REFMAC5 for refinement and various utilities for map calculation and validation. |
| PyMOL / ChimeraX | High-quality visualization tools for analyzing the final model, rendering publication-quality figures, and analyzing molecular interactions. |
| Validation Server (OneDep) | The official PDB validation service used during deposition. Provides the final report that accompanies the deposited structure. |
This application note, situated within a broader thesis on X-ray crystallography for receptor structure determination, details the protocols for interpreting electron density maps to elucidate two critical features: ligand-binding pockets and protein conformational states. The accurate identification of these features is foundational for structure-based drug design (SBDD), enabling the development of novel therapeutics that target specific receptor conformations or occupy allosteric sites.
Key Concepts and Quantitative Benchmarks
Table 1: Critical Metrics for Electron Density Map Interpretation
| Metric | Target Value/Range | Interpretation & Implication |
|---|---|---|
| Map Resolution (Å) | < 3.0 Å (Ligand ID) < 2.5 Å (Confidence) < 1.8 Å (Atomic detail) | Defines the level of discernible detail. Higher resolution reveals finer conformational states. |
| Real Space Correlation Coefficient (RSCC) | > 0.8 (High confidence) 0.7-0.8 (Moderate) < 0.7 (Poor fit) | Measures agreement between model and experimental density for a specific atom/region. |
| Real Space R-value (RSR) | < 0.2 (Excellent) 0.2-0.3 (Good) > 0.3 (Poor) | Complementary to RSCC; lower values indicate better fit. |
| Ligand Occupancy | 1.0 (Full) 0.5-0.9 (Partial) < 0.5 (Weak/Unreliable) | Fraction of molecules in the crystal where the ligand is present. Impacts density strength. |
| B-factor (Ų) | Ligand ~ Protein (Good) Ligand >> Protein (Weak binding/Disorder) | Measures atomic displacement. Similar B-factors suggest ligand is well-ordered in the pocket. |
| Q-score | > 0.7 (High quality) ~0.5 (Medium) < 0.45 (Potentially incorrect) | Quantifies the fit of atomic model to local electron density. |
Table 2: Electron Density Features of Common Conformational States
| Conformational State | Electron Density Hallmarks | Typical Resolution Required |
|---|---|---|
| Active (R-state) | Clear density for catalytic residues in ordered, productive geometry; closed binding pocket. | ≤ 2.5 Å |
| Inactive (T-state) | Disordered or alternate side-chain density for key residues; pocket may appear occluded. | ≤ 3.0 Å |
| Allosteric Site Occupied | Contoured density in a secondary site, often with coupled changes in primary site density. | ≤ 2.8 Å |
| Open vs. Closed Loop | Continuous but divergent backbone trace; possible broken density in flexible hinge regions. | ≤ 2.2 Å |
| Partial Agonist Binding | Density for ligand present, but surrounding residue density may be weaker or show multiple conformers. | ≤ 2.3 Å |
Experimental Protocols
Protocol 1: Systematic Identification of a Ligand-Binding Pocket
Objective: To locate and validate a small-molecule binding site from an experimental (2mFo-DFc) electron density map.
Materials: See "The Scientist's Toolkit" below. Procedure:
- Map Generation: Calculate a 2mFo-DFc (σA-weighted) map and a mFo-DFc difference map using refined, ligand-free protein coordinates.
- Initial Contouring: Display the 2mFo-DFc map contoured at 1.0 σ. Visually inspect the protein surface for contiguous, globular regions of unassigned positive density.
- Difference Map Analysis: Overlay the mFo-DFc difference map contoured at +3.0 σ (positive, green) and -3.0 σ (negative, red). A genuine binding site will show a strong, localized positive peak (potential ligand) surrounded by negative peaks (protein side chains shifted upon binding).
- Ligand Fitting: a. Place a candidate ligand molecule into the positive difference density using a molecular graphics program (e.g., Coot, PyMOL). b. Ensure ideal stereochemistry and avoid clashes. c. Real-space refine the ligand and surrounding protein residues.
- Validation Metrics: a. Calculate the RSCC and RSR for the ligand as a whole. b. Check that ligand B-factors are reasonable compared to adjacent protein atoms. c. Verify the absence of strong (>3.0 σ) peaks in the final mFo-DFc map.
- Report: Document the site location, interacting residues, and all validation metrics.
Protocol 2: Distinguishing Conformational States via Electron Density
Objective: To analyze electron density to determine whether a receptor is in an active, inactive, or intermediate state.
Materials: See "The Scientist's Toolkit" below. Procedure:
- High-Resolution Map Preparation: Use a high-quality, sharpened map (e.g., after phenix.auto_sharpen) contoured at ~1.2 σ for clear visualization of side-chain density.
- Key Region Analysis: Focus on known conformational determinants (e.g., activation loop in kinases, GPCR transmembrane helices 5 & 6, switch regions in GTPases).
- Density Characterization: a. Ordered/Single State: Continuous, unambiguous density supporting one side-chain rotamer or backbone trace. b. Disorder/Weak: Broken or very weak density, indicating high mobility or low occupancy of that conformer. c. Multiple Conformers: Bulbous or forked density that can be modeled as two or more alternate atomic positions (with partial occupancies summing to ~1.0).
- Model Refinement: For multiple conformers, build alternate conformations (A, B, etc.) and refine occupancies.
- Comparative Analysis: Superimpose the structure with known active/inactive state templates. Quantify differences (e.g., RMSD of Cα atoms in key motifs).
- Correlation with Function: Cross-reference the observed density state with biochemical data (e.g., agonist vs. antagonist bound) to assign biological significance.
Visual Workflows
Diagram Title: Ligand-Binding Pocket Identification Workflow
Diagram Title: Conformational State Analysis from Density
The Scientist's Toolkit: Essential Research Reagent Solutions
Table 3: Key Software and Data Resources for Map Interpretation
| Item Name (Vendor/Resource) | Primary Function | Application in Protocol |
|---|---|---|
| Coot (EMBL-EBI) | Model building, fitting, real-space refinement, and validation. | Core tool for manual ligand fitting, alternate conformer building, and RSCC calculation (Protocols 1 & 2). |
| PyMOL (Schrödinger) | Molecular visualization and analysis. | Initial visual scan for unassigned density, creation of publication-quality figures, and superposition analysis. |
| Phenix (Lawrence Berkeley Lab) | Comprehensive crystallography software suite. | Map calculation (phenix.maps), sharpening (phenix.autosharpen), and validation (phenix.modelvs_data). |
| CCP4 (Collaborative Project) | Suite of programs for crystallography. | Map generation (FFT), scaling, and various utilities. |
| PDB-REDO Database | Re-refined, up-to-date crystal structures. | Source of improved models for comparison and better electron density maps for analysis. |
| MoPro / ARP/wARP | Automated model building and ligand fitting. | For initial automated ligand placement and model completion prior to manual refinement. |
| EDM (Electron Density Map) Server | Online map calculation and analysis. | Quick generation of maps from PDB entries for preliminary assessment. |
| MolProbity (Duke Univ.) | All-atom structure validation. | Final validation of geometry, clashes, and rotamer outliers after model building. |
Beyond the Basics: Solving Common Crystallization and Diffraction Challenges
Within the broader thesis on X-ray crystallography for receptor structure determination, the transition from purified protein to a high-quality diffraction crystal is the most significant bottleneck. This document provides application notes and protocols to systematically address poor or no crystallization, focusing on three interrelated pillars: rational construct design, strategic additive screening, and sample stabilization.
Construct Design and Engineering
The primary cause of crystallization failure is often intrinsic to the protein construct itself. A well-designed construct maximizes ordered, homogeneous protein while minimizing flexible regions.
Quantitative Analysis of Construct Design Success Rates
Table 1: Impact of Construct Design Strategies on Crystallization Success (Compiled from Recent Literature)
| Design Strategy | Typical Application | Reported Increase in Crystallization Hits | Key Consideration |
|---|---|---|---|
| Truncation Analysis (Limited Proteolysis / Bioinformatics) | Membrane receptors, multi-domain proteins | 40-60% | Identifies rigid domains; risk of disrupting functional conformation. |
| Surface Entropy Reduction (SER) | High-entropy surface clusters (e.g., Lys, Glu loops) | ~30% (for susceptible targets) | Mutate 2-3 residue clusters to Ala or Ser. Requires functional validation. |
| Glycan Trimming / Removal | Heavily glycosylated receptors (e.g., GPCRs, kinases) | 25-50% | Use EndoH/PNGaseF or baculovirus expression with kifunensine. |
| Fusion Protein Partners (e.g., T4 Lysozyme, BRIL, GFP) | Membrane proteins, small proteins | Up to 70% (for specific families like GPCRs) | Can provide crystal lattice contacts; may constrain conformational states. |
| Disulfide Bond Engineering | Flexible loops, domain interfaces | Variable; critical for some targets | Stabilizes specific conformation; requires oxidizing environment and cysteines. |
Protocol: Systematic Truncation Screen for Receptor Soluble Domains
Objective: To identify minimal stable folding units of a receptor's extracellular or cytoplasmic domain for crystallization.
Materials:
- Purified receptor domain (>95% purity, 1-5 mg/mL).
- Sequence-specific proteases (e.g., Trypsin, Chymotrypsin, Subtilisin) and/or non-specific proteases (e.g., Proteinase K at low concentration).
- Size Exclusion Chromatography (SEC) column (e.g., Superdex 75 Increase 10/300 GL).
- SDS-PAGE and Western Blot apparatus.
- Mass spectrometry for N-terminal sequencing.
Procedure:
- Limited Proteolysis: Set up eight reactions with your protein at 1 mg/mL in crystallization buffer (e.g., 20 mM Tris, 150 mM NaCl, pH 8.0). Add protease at enzyme:substrate ratios from 1:1000 to 1:10 (w/w). Incubate on ice for 30 minutes.
- Reaction Quench: Add specific protease inhibitors (e.g., PMSF for serine proteases) or immediately heat to 95°C in SDS-PAGE loading buffer for time-point analysis.
- Analysis: Run samples on SDS-PAGE (Coomassie and Western). Identify stable, protease-resistant bands.
- Isolation: Scale up the reaction condition yielding a stable fragment. Quench and immediately load onto pre-equilibrated SEC column.
- Characterization: Collect the peak corresponding to the fragment's expected size. Analyze by SDS-PAGE and dynamic light scattering (DLS). Submit for N-terminal sequencing and mass spec to identify boundaries.
- Cloning & Expression: Clone the identified fragment into expression vector, express, purify, and subject to crystallization trials.
Additive Screening
Additives are small molecules, ions, or other compounds that interact with the protein to enhance stability, conformational homogeneity, or crystal lattice interactions.
Quantitative Efficacy of Common Additive Classes
Table 2: Efficacy of Additive Classes in Rescuing Crystallization
| Additive Class | Example Compounds | Concentration Range | Primary Mechanism | Success Rate in Initial Screens |
|---|---|---|---|---|
| Reducing Agents | TCEP, DTT, β-ME | 0.5-10 mM | Prevents disulfide scrambling/oxidation, stabilizes reduced state. | 15-20% (for cysteine-rich targets) |
| Ions / Salts | Zn²⁺, Ca²⁺, Mg²⁺, SO₄²⁻ | 1-20 mM | Can mediate crystal contacts or stabilize functional folds. | 10-25% (highly target-dependent) |
| Lipids / Detergents | Cholesterol Hemi-Succinate (CHS), DDM, Lauryl Maltose Neopentyl Glycol (LMNG) | 0.01-0.5% (w/v), CHS at 0.01-0.1% | Stabilizes membrane proteins, occupies hydrophobic clefts in soluble proteins. | Critical for MPs; 30-40% hit improvement. |
| Ligands / Inhibitors | Co-factors, substrates, small-molecule antagonists/agonists | Kd to 10x Kd | Locks specific, homogeneous conformation. | Most impactful; 50-70% for well-chosen ligands. |
| Polyamines / Dyes | Spermidine, Spermine, Malachite Green | 0.1-5 mM | Charge neutralization, surface interaction, sometimes lattice incorporation. | 5-15% |
| Cosolvents | Glycerol, Ethylene Glycol, Low Mw PEGs | 2-10% (v/v) | Precipitant and stabilizer, reduces conformational flexibility. | 10-20% |
Protocol: High-Throughput Additive Screen
Objective: To identify chemical additives that improve protein stability (monodispersity) and subsequently, crystallization.
Materials:
- 96-well additive screen kit (commercial e.g., Hampton Research Additive Screen HR- or homemade).
- 96-well sitting-drop vapor diffusion plates.
- Liquid handling robot or multi-channel pipette.
- Protein at 10-20 mg/mL in low-salt buffer.
- DLS instrument or UV plate reader for thermal shift assay.
Procedure (Two-Tiered Approach): Tier 1: Stability Prescreen (Thermal Shift or DLS)
- Prepare protein sample in crystallization base buffer.
- Using a 96-well plate, mix 45 µL of protein with 5 µL of each additive from the kit (final additive concentration as per kit design).
- Run a thermal shift assay (Sypro Orange dye) or transfer to a DLS plate reader.
- Rank additives by the increase in melting temperature (ΔTm > 2°C) or improvement in polydispersity index (PDI < 20%).
- Select the top 20-30 additives for Tier 2.
Tier 2: Crystallization Trial
- Set up 96-well crystallization trials (e.g., with a sparse matrix screen like JCSG+ or PEG/Ion) using the protein pre-mixed with each selected additive from Tier 1.
- Use a 1:1 or 2:1 ratio of protein+additive:precipitant (200 nL + 200 nL drops).
- Incubate and monitor at 20°C and 4°C.
- Compare hit rate and crystal quality to control trials without additives.
Stabilization Strategies
Stabilization aims to trap a single, predominant conformational state, which is critical for forming a periodic lattice.
Ligand-Mediated Stabilization Protocol
Objective: To co-crystallize a receptor with a high-affinity ligand (small molecule, peptide, or antibody fragment) to stabilize a specific state.
Materials:
- Purified receptor.
- High-affinity ligand (Kd ideally < 100 nM).
- SEC buffer compatible with both protein and ligand.
- Analytical SEC column or Microscale Thermophoresis (MST)/Surface Plasmon Resonance (SPR) for validation.
Procedure:
- Complex Formation: Incubate receptor at 1.5x desired final concentration with a 2-5 molar excess of ligand for 1-2 hours on ice. For very tight binders (Kd < nM), a 1.2:1 ligand:protein ratio may suffice.
- Complex Purification: Load the mixture onto an SEC column equilibrated with crystallization buffer (e.g., 20 mM HEPES, 150 mM NaCl, 0.01% LMNG for MPs). Collect the peak corresponding to the complex. This step removes unbound ligand and ensures stoichiometric complex.
- Validation: Analyze the peak fractions by SDS-PAGE, UV-Vis (if ligand has distinct spectrum), and/or native MS to confirm complex formation.
- Concentration: Concentrate the complex to target concentration (e.g., 20-50 mg/mL for soluble, 5-15 mg/mL for MPs).
- Crystallization: Set up trials immediately. Include ligand in the reservoir solution at 0.1-1 mM to prevent dissociation if necessary.
Visualizations
Title: Systematic Troubleshooting Workflow for Crystallization
Title: Limited Proteolysis Workflow for Construct Optimization
The Scientist's Toolkit: Key Research Reagent Solutions
Table 3: Essential Reagents for Crystallization Troubleshooting
| Reagent / Material | Supplier Examples | Primary Function in Troubleshooting |
|---|---|---|
| Hampton Research Additive Screen HR- | Hampton Research | Systematic library of 96 small molecules, ions, and reagents to identify crystallization enhancers. |
| TCEP-HCl (Tris(2-carboxyethyl)phosphine) | Thermo Fisher, Sigma | Reducing agent superior to DTT; more stable, prevents disulfide scrambling in crystallization drops. |
| Cholesterol Hemisuccinate (CHS) | Anatrace, Sigma | Sterol analog critical for stabilizing many membrane proteins (esp. GPCRs) during purification and crystallization. |
| Lauryl Maltose Neopentyl Glycol (LMNG) | Anatrace | High-CMC detergent for membrane protein solubilization and stabilization, often used in cryo-EM and crystallography. |
| JCSG+ Sparse Matrix Screen | Molecular Dimensions | Broad-spectrum 96-condition initial screen combining various precipitants, salts, and pH conditions. |
| Sypro Orange Protein Gel Stain | Thermo Fisher | Dye for thermal shift assays to rapidly screen additives or ligands for stabilizing effect (ΔTm). |
| Meso Scale Discovery (MSD) SEC Plates | Millipore Sigma | 96-well plates with size exclusion columns for rapid buffer exchange or complex purification prior to crystallization. |
| T4 Lysozyme (T4L) Fusion Vectors | Addgene | Vectors for creating fusion proteins to aid crystallization, especially for GPCRs and small proteins. |
This application note details practical methods for overcoming weak diffraction—a common bottleneck in X-ray crystallography for receptor structure determination. Within the broader thesis of elucidating drug-receptor interactions, obtaining high-resolution structural data from challenging targets like membrane proteins or flexible receptors is paramount. The protocols herein address sample preparation, data collection, and computational processing to extract maximal information from weak-diffracting crystals.
Application Notes & Protocols
Advanced Cryo-Protection Protocols
Weakly diffracting crystals are exceptionally susceptible to ice formation and crystalline disorder during flash-cooling. Standard cryo-protection may be insufficient.
Protocol 1.1: High-Viscosity Cryo-Protectant (HVCP) Soaking for Membrane Protein Crystals
- Objective: To gradually introduce cryo-protectants without shocking delicate crystals, preserving lattice order.
- Materials:
- Crystal in native mother liquor.
- High-viscosity cryo-protectant solution: e.g., 30% (v/v) glycerol, 20% (v/v) ethylene glycol, 10% (w/v) sucrose in mother liquor, plus 20% (w/v) Ficoll PM-400 (or similar high molecular weight polymer).
- Siliconized glass depression plates or sitting drop plates.
- Micro-loops and vials for crystal mounting.
- Method:
- Prepare a dilution series of the HVCP solution in mother liquor (e.g., 10%, 25%, 50%, 75%, 100% HVCP).
- Transfer the crystal through the series, allowing 3-5 minutes per step in a humidified chamber.
- After the final 100% HVCP soak (5-10 mins), mount the crystal directly from the drop and flash-cool in liquid nitrogen.
- Rationale: The high-viscosity polymer (Ficoll) reduces convective flow and osmotic shock, while the small-molecule cryo-protectants penetrate the crystal. This method significantly reduces anisotropic diffraction and improves high-resolution limits for sensitive crystals.
Protocol 1.2: Cryo-Annealing
- Objective: To repair ice damage and lattice disorder post-cryo-cooling.
- Method:
- Collect an initial diffraction data set (5-10°).
- Without warming the cryo-stream, translate the crystal to a fresh, undamaged spot using the goniometer.
- Briefly (< 2 sec) block the cryo-stream to allow the crystal to warm slightly (to ~150-180K), then restore full cooling.
- Re-center the crystal and collect a new dataset.
- Rationale: The transient, partial warming allows water molecules to reorient into a vitreous state and can relax strained lattice forces, often improving diffraction quality and symmetry.
Radiation Damage Mitigation Strategies
Weakly diffracting crystals have a low signal-to-noise ratio and are rapidly degraded by X-ray exposure, requiring strategies to maximize data quality before total damage.
Protocol 2.1: Helical and Mesh Scan Data Collection
- Objective: To distribute radiation dose over a larger crystal volume.
- Method (Using modern beamline software, e.g., MXCuBE, GDA):
- After crystal centering, define a scan path. For a needle crystal: a helical path along the long axis (diameter ~10-30µm smaller than crystal width). For a plate crystal: a rectangular mesh grid.
- Set the translation speed to synchronize with shutter opening and rotation (e.g., 1-10 µm/sec).
- Collect data with continuous rotation and simultaneous translation.
- Rationale: Effectively uses more of the crystal volume, increasing the number of scattering events per unique reflection and delaying the onset of site-specific radiation damage at any single point.
Protocol 2.2: Multi-Crystal Data Merging with Dose Segmentation
- Objective: To construct a complete, high-fidelity dataset from partial data of multiple crystals, using only the low-dose, undamaged portion of each.
- Method:
- Collect 180-360° of data from Crystal 1, but process in segments (e.g., 20° wedges).
- Analyze metrics like Rmerge , CC1/2 , and unit cell variation per wedge. Discard wedges showing signs of decay (significant cell expansion, CC1/2 drop).
- Repeat for Crystals 2, 3, ... n.
- Use scaling/merging software (AIMLESS, xia2.multiplex) to combine only the high-quality wedges into a complete dataset.
- Rationale: Systematic damage begins with the first exposure. Using only the initial, pristine images from many crystals yields a composite dataset with effectively lower overall radiation dose per reflection.
Quantitative Data on Radiation Damage Limits
Table 1: Approximate Dose Limits for Global and Specific Damage
| Damage Type | Typical Dose Limit (MGy) | Observable Metric in Data | Mitigation Strategy |
|---|---|---|---|
| Global (Resolution Drop) | 10-30 | Decrease in I/σ(I) at high resolution, increase in Rmerge | Helical scans, reduced exposure/wedge |
| Specific: Disulfide Breakage | ~0.5-1.0 | Negative difference density at S-S bond | Use only first 5-10° of data for phasing |
| Specific: Glu/Asp Decarboxylation | ~0.8-1.2 | Negative difference density at side-chain carboxyl | Dose segmentation for model building |
| Metal Center Reduction | Varies (0.1-5) | Ligand geometry changes, anomalous signal loss | Collect at higher energy (e.g., 12.7 keV) |
Data Processing "Tricks" for Weak Data
Protocol 3.1: Anisotropic Correction and Ellipsoidal Truncation
- Objective: To correct for direction-dependent diffraction limits and strategically filter noisy high-resolution data.
- Method (Using STARANISO server or AIMLESS):
- After standard integration (DIALS, XDS), scale data with an anisotropic cutoff model.
- The server outputs an ellipsoidal resolution limit (e.g., 2.5Å a, 3.2Å b, 2.8Å c*).
- Apply an ellipsoidal truncation, discarding data beyond the usable limit in each direction.
- Use this truncated but higher-quality dataset for initial molecular replacement and building.
- Rationale: Many weak crystals diffract anisotropically. Forcing a spherical high-resolution cutoff includes noisy, unusable data that hampers phasing. Ellipsoidal truncation improves map clarity.
Protocol 3.2: Using CC-based Masking in PHENIX AutoSol
- Objective: To improve experimental phasing (SAD/MAD) from weak anomalous signal.
- Method:
- After substructure determination (SHELXD, HySS), run PHENIX autosol.
- In parameters, set
solvent_content.method=histogramandmasking.method=cc. - Enable
resolution_dependent_lsq.
- Rationale: CC-based masking creates a solvent mask based on the map correlation coefficient, which is more robust than traditional density level-based masking for noisy maps. This improves phase extension and downstream autobuilding.
Mandatory Visualization
Diagram 1: Workflow for Processing Weak Diffraction Data
Workflow for Weak Diffraction Data Processing
Diagram 2: Key Radiation Damage Pathways
Radiation Damage Pathways & Mitigation
The Scientist's Toolkit: Research Reagent Solutions
Table 2: Essential Materials for Overcoming Weak Diffraction
| Item | Function & Rationale |
|---|---|
| Ficoll PM-400 (or Dextran) | High molecular weight polymer for HVCP cocktails. Increases viscosity, reduces osmotic shock during cryo-soaking. |
| Liquid Helium Cryo-Stream | Provides temperatures down to ~50K. Lower temperature reduces atomic mobility, slowing primary and secondary radiation damage. |
| Radical Scavengers (e.g., Sodium Ascorbate, NADH) | Added to cryo-solution at 1-10 mM. Competitively react with diffusing secondary radicals, protecting the protein. |
| Micro-Mesh (MiTeGen) Crystal Mounting Loops | Extremely thin (10µm) loops. Minimize background scatter and absorbent material around crystal, improving signal-to-noise. |
| STARANISO Web Server | Automates anisotropic correction and ellipsoidal truncation decision-making, crucial for processing anisotropic data. |
| xia2.multiplex Pipeline | Streamlines the management, scaling, and merging of multi-crystal datasets, including dose-segmented wedges. |
| DIALS Processing Suite | Integration algorithm robust for difficult data from small or irregular crystals collected with helical/mesh scans. |
Within the broader thesis on X-ray crystallography for receptor structure determination, the phenomena of crystal disorder and twinning represent critical, often inevitable, obstacles. These defects complicate the extraction of precise structural information, especially for challenging targets like membrane receptors or protein-ligand complexes central to drug development. This document provides application notes and protocols for the systematic identification and computational correction of these pathologies, enabling the determination of high-fidelity structural models.
Identification of Disorder and Twinning
Key Indicators and Diagnostic Tests
Crystal defects manifest in specific abnormalities during diffraction data processing. The following table summarizes quantitative metrics and their diagnostic thresholds.
Table 1: Diagnostic Metrics for Crystal Disorder and Twinning
| Metric | Well-Ordered Crystal | Disorder Indication | Twinning Indication | Typical Calculation/Software | ||||
|---|---|---|---|---|---|---|---|---|
| Rmerge / Rmeas | < 0.1 (low res) | High values, especially at high resolution | May be deceptively low | Pointless/Aimless, XDS | ||||
| I/σ(I) | > 2.0 (high res) | Drops rapidly with resolution | Falls slower than expected | Any scaling program | ||||
| Completeness | > 95% (per shell) | May be low due to diffuse scattering | Normal | |||||
| Multiplicity | As high as possible | - | Often very high | |||||
| Wilson B-factor | ~20-40 Ų | Often > 60 Ų | Not diagnostic | Truncate/Matthews_coef | ||||
| Padilla-Yeates L-test | L = ~0.5 | Not diagnostic | Merohedral: L < 0.5 | phenix.xtriage | ||||
| Britton Plot | Random spread | - | Non-Merohedral: Deviations from random | phenix.xtriage | ||||
| H-test (H coefficient) | < 0.5 | Not diagnostic | Perfect twin: H = 0.5; Partial: 0.5 > H > 0 | Ctruncate | ||||
| R vs. | L | / | L | Plot | Flat | - | Curved | phenix.xtriage |
Visual Diagnostics and Protocols
Protocol 2.2.1: Initial Data Analysis and Twinning Detection
Objective: To assess data quality and identify potential twinning from integrated diffraction data.
Input: Unmerged, scaled reflection file (.mtz or .sca format).
Steps:
- Run phenix.xtriage:
- Examine the output report for:
- L-test results: For merohedral twinning. An L statistic significantly < 0.5 suggests twinning.
- Britton analysis: For non-merohedral twinning. Systematic deviations indicate twinning.
- Wilson B-factor and intensity statistics: High B-factors may suggest disorder.
- Analyze intensity distributions: Use
Ctruncate(from CCP4) to calculate the cumulative intensity distribution (N(z) test) and H coefficient. A plot of N(z) vs. z deviating from the theoretical untwinned curve indicates twinning. An H coefficient approaching 0.5 suggests perfect twinning.
Protocol 2.2.2: Detecting Translational Disorder (Diffuse Scattering)
Objective: Identify diffuse scattering patterns indicative of short-range order and disorder.
Input: Processed diffraction images (.img, .cbf).
Steps:
- Visualize diffraction images using ADXV or Coot.
- Look for:
- Continuous streaks between Bragg peaks, rather than sharp, discrete spots.
- Increased background scattering, particularly at higher resolution shells.
- Quantify via the Diffraction Image Screening Tool (DIST) software suite to map diffuse scatter.
Computational Correction Strategies
Modeling Disorder
Protocol 3.1.1: Modeling Disordered Regions with Alternate Conformations
Objective: To build and refine atomic models with multiple conformations for disordered regions.
Input: Intermediate refined model (.pdb) and structure factors (.mtz).
Steps:
- In Coot:
- Visually inspect electron density (2mFo-DFc and mFo-DFc maps) for contiguous positive density adjacent to the main chain.
- Use
"Rotamer"and"Alternate Conformation"tools to add side-chain conformers (A, B, etc.). - For main-chain disorder, use
"Refine Zone"with"Regularize Zone"on loops, then manually split the chain into alternate conformers.
- In PHENIX.refine:
- Configure the refinement to include alternate conformations:
- Occupancies for alternate conformers will be refined automatically, typically summing to 1.0 per site.
- Apply NCS constraints if disorder is symmetric across subunits.
- Validate: Ensure occupancies are between 0 and 1. Check for unexplained positive difference density (Fo-Fc).
Protocol 3.1.2: Using B-factors to Model Diffuse Disorder Objective: To model isotropic and anisotropic atomic displacement parameters (ADPs). Input: Refined model with alternate conformations built. Steps:
- Refine individual isotropic B-factors: Standard protocol.
- Refine anisotropic B-factors (for atoms with high occupancy and good data > ~2.0 Å resolution):
- Analyze B-factor distributions: High average B-factors (> 80 Ų) or large ellipsoids may indicate unresolved disorder. Use
phenix.model_vs_datafor validation.
Detwinning and Refining Twinned Data
Protocol 3.2.1: Detwinning Merohedrally Twinned Data in Refinement
Objective: To refine a structural model against twinned data by directly modeling the twinning operator.
Input: A starting molecular replacement or refined model (.pdb) and the twinned data (.mtz).
Steps:
- Determine the twin law: From
phenix.xtriageoutput (e.g.,-k,-h,-lfor a two-fold rotation around the [111] axis in rhombohedral space groups). - Refine with the twin law in PHENIX.refine:
The parameter
twin_fraction(α) will be refined. For perfect twinning, α approaches 0.5. - Monitor R-factors: Detwinned R-work and R-free should decrease significantly compared to untwinned refinement. The twin fraction should converge to a stable value.
- Validate: Use
phenix.twin_map_analysisto calculate detwinned maps for model building.
Protocol 3.2.2: Structure Determination with Non-Merohedral Twinning (Twinning by Retardance) Objective: To handle cases where twin domains are related by a non-crystallographic symmetry operation. Input: Integrated but unscaled data from potentially multiple crystal components. Steps:
- Use the CCP4 program
CTRUNCATEto analyze and separate twin components if possible, based on hkl intensity distributions. - Employ the
STREAMapproach: treat data as a multi-crystal dataset. Scale each component (domain) separately usingAimlesswith careful assignment of symmetry. - For refinement, if domains cannot be separated, use a multi-domain model in REFMAC5 with twin matrix refinement, specifying the separate twin operators for each domain.
The Scientist's Toolkit: Research Reagent Solutions
Table 2: Essential Materials for Crystallography of Disordered/Twinned Samples
| Item / Reagent | Function / Purpose | Example/Note |
|---|---|---|
| High-Purity Lipids/Detergents | To stabilize membrane protein receptors, reducing inherent flexibility and disorder. | DDM, LMNG, CHS for GPCR solubilization and crystallization. |
| Ligand / Stabilizer Cocktails | To lock the receptor into a specific, ordered conformational state. | Co-crystallization with high-affinity agonists/antagonists or allosteric modulators. |
| Cryoprotectants | To form a uniform, vitreous ice for cryo-cooling, minimizing mosaic spread and disorder from ice formation. | Ethylene glycol, glycerol, low-molecular-weight PEGs. |
| Seeding Stock (Micro/Matrix) | To improve crystal order by providing nucleation sites, often yielding larger, single-domain crystals. | Hampton Research Seed Bead kit for macro-seeding. |
| Anisotropy Correction Server | Computational tool to correct for anisotropic diffraction limits, often associated with disorder. | servalcat or phenix.anisotropic_correction. |
| Twinned Data Refinement Software | Essential suites with built-in algorithms for twin law identification and detwinning during refinement. | PHENIX (refine, xtriage), CNS (twin refinement scripts), REFMAC5. |
| High-Performance Computing (HPC) Access | Necessary for computationally intensive molecular dynamics simulations to model disorder. | Used with Amber, GROMACS for ensemble refinement. |
Visualized Workflows
Title: Disorder & Twinning ID & Correction Workflow
Title: phenix.xtriage Protocol for Twinning ID
Title: Interpreting Key Diagnostic Metrics
Within the broader thesis on advancing X-ray crystallography for receptor structure determination, phasing remains the pivotal step that transforms diffraction data into an interpretable electron density map. While routine cases are often solved by Molecular Replacement (MR) or experimental methods like Single-wavelength Anomalous Dispersion (SAD), a significant proportion of projects—particularly involving novel receptors, low-homology targets, or poorly diffracting crystals—present substantial challenges. This application note details integrated strategies and protocols for overcoming these difficult phasing scenarios, essential for accelerating structural biology and structure-based drug discovery.
Comparative Analysis of Phasing Methods for Difficult Cases
The choice of phasing strategy is dictated by the available information. The following table summarizes key performance metrics and requirements for advanced approaches.
Table 1: Advanced Phasing Strategies for Difficult Cases
| Phasing Method | Primary Use Case | Key Requirement | Typical Resolution Limit | Success Rate (Approx.) | Major Advantage | Major Challenge |
|---|---|---|---|---|---|---|
| Enh.-Auto-Rickshaw MR | Low-homology MR, flexible targets | Distant homology model (<20% identity) | 3.0 Å | 40-60% | Integrates model deformation/ensemble generation | Sensitive to initial model quality |
| Beta-Bellman MR | Large complexes, flexible assemblies | Unit cell content & sequence | 3.5 Å | 50-70% | Solves for optimal copy/rotation function | Computationally intensive |
| SAD with Halogen Soaks | Novel proteins, no homolog | Halogen (Br/I) incorporation via soaking | 2.8 Å | 60-80% | Strong anomalous signal, easy experiment | Potential crystal damage, non-isomorphism |
| Native S-SAD | Any native protein with S atoms | High-redundancy, high-resolution data (<2.0 Å) | 2.0 Å | 30-50% (at 1.8Å) | No derivatives needed; uses intrinsic S atoms | Weak signal, requires excellent data |
| D-Serine/L-SeMet MAD | Proteins expressed in E. coli | Incorporation of D-Ser or L-SeMet | 2.5 Å | 70-85% | Strong dual anomalous scatterers, robust for MR-SAD | Requires specialized expression media |
| CRANK2 Pipelines | De novo structure solution | Experimental phases (SAD/MAD) | 3.2 Å | Varies | Fully automated, integrated from substructure to building | Less user control, requires good data |
Detailed Protocols
Protocol 1: Enhanced MR with Ensembling and Deformation (Using Auto-Rickshaw)
Application: Solving a receptor with only a distant homology model (<25% identity).
- Model Preparation: Generate an ensemble of template structures using MODELLER or SWISS-MODEL, incorporating slight variations.
- Input File Preparation: Prepare a standard PDB file for the search model and the processed SCALEPACK or MTZ file with intensities.
- Job Submission to Auto-Rickshaw: Submit the model and data to the Auto-Rickshaw server (https://www.ebi.ac.uk/auto-rickshaw/). The pipeline automatically:
- Trims and modifies the search model.
- Performs extensive MR searches using Phaser or MOLREP with model deformation.
- Conducts combined model refinement and phase improvement using REFMAC and Parrot.
- Result Analysis: Download the output. The best solution is identified by the highest log-likelihood gain (LLG) and translation function Z-score (TFZ). Proceed with automated model building (e.g., with Buccaneer).
Protocol 2: Halogen-Soaking for Rapid SAD Phasing
Application: De novo phasing of a novel receptor crystal.
- Crystal Soaking:
- Prepare a cryoprotectant solution (e.g., 25% glycerol in mother liquor).
- Add a high-concentration halogen salt: Potassium Iodide (KI) or Sodium Bromide (NaBr) to 0.5-1.0M final concentration.
- Flash-cool a native crystal as a control. Soak a separate crystal in the halogenated solution for 5-30 seconds before flash-cooling.
- Data Collection:
- Collect a highly redundant dataset (360°+ oscillation) at the absorption peak wavelength for the halogen (e.g., ~1.9Å for Iodine) at a synchrotron microfocus beamline.
- Aim for high completeness (>99%) and multiplicity (>30).
- Data Processing & Phasing:
- Process data with XDS or DIALS. Use pointless and aimless for scaling.
- Run the CRANK2 pipeline or autoSHARP via the CCP4i2 interface, specifying SAD experiment with Iodine/Bromine.
- The software will locate anomalous scatterers, calculate phases, and perform density modification.
Protocol 3: D-Serine/L-SeMet MAD forE. coliExpressed Receptors
Application: Robust phasing for proteins resistant to SeMet labeling.
- Protein Expression:
- Use an E. coli expression strain auxotrophic for methionine (e.g., B834(DE3)).
- For L-SeMet labeling, grow cells in M9 minimal media supplemented with 50 mg/L L-SeMet.
- For D-Serine labeling, use a D-serine deaminase deficient strain (e.g., DL41(DE3)) and grow in M9 media with 1 g/L D-Serine.
- Purification & Crystallization: Purify as for native protein. Co-crystallize or soak with D-Ser if using that method.
- Multi-Wavelength Data Collection:
- Collect a 3-wavelength MAD dataset at the Se (or Sr for D-Ser) absorption edge: Peak, Inflection, and Remote.
- Prioritize high redundancy and accuracy at each wavelength.
- Phasing:
- Process each wavelength dataset independently and scale together (HKL2000 or Xia2).
- Use Phaser (EPMR mode) or SHELXC/D/E via HKL2MAP to solve the substructure and derive MAD phases.
Visualizations
Title: Decision Workflow for Difficult Phasing Cases
The Scientist's Toolkit
Table 2: Essential Research Reagents and Solutions for Advanced Phasing
| Reagent/Solution | Function/Application | Key Considerations |
|---|---|---|
| Potassium Iodide (KI) / NaBr Soaking Solution | Halogen derivatization for SAD/MAD. Provides strong anomalous scatterers (I, Br). | Concentration (0.5-1.5M), soak time critical to avoid non-isomorphism. Use quick soak (<30 sec). |
| L-Selenomethionine (L-SeMet) | Biosynthetic labeling for MAD phasing. Selenium replaces sulfur in methionine. | Requires Met-auxotrophic E. coli strain. Toxicity may reduce yield. |
| D-Serine Media Supplement | Alternative anomalous label for MAD. Incorporates into expressed protein. | Uses D-serine deaminase deficient strain (e.g., DL41). Often higher yield than SeMet. |
| Crystal Cryoprotectant (e.g., Glycerol, PEG 400) | Prevents ice formation during vitrification for data collection. | Must be compatible with halogen salts for soaking experiments. Optimize concentration. |
| M9 Minimal Media | Defined medium for isotopic (e.g., Se, D-Ser) labeling of recombinant proteins in E. coli. | Supports auxotrophic strain growth without background Met/Ser. |
| Phaser (CCP4/Phenix) | Primary software for MR and experimental phasing (SAD, MAD). Key for MR-SAD hybrid approach. | LLG and TFZ scores guide solution quality. |
| CRANK2 Pipeline | Integrated suite for automated experimental phasing, from substructure detection to model building. | Reduces manual intervention; effective for SAD/MAD with good data. |
| Auto-Rickshaw Web Server | Automated remote server for difficult MR using model ensembling and deformation. | Ideal when local MR searches fail due to low homology. |
Application Notes
Within a thesis focused on X-ray crystallography for receptor structure determination, the primary hurdle is often obtaining high-quality, diffraction-quality crystals of the target macromolecule. This is particularly true for challenging targets such as G protein-coupled receptors (GPCRs), ion channels, and membrane-bound enzymes, which are flexible, hydrophobic, and often unstable in detergent-solubilized forms. The strategic use of antibody fragments (Fabs) and fusion proteins represents a cornerstone of modern crystallography to overcome these barriers.
Fab Fragments: Monoclonal Fabs (antigen-binding fragments) are generated by proteolytic cleavage of IgG antibodies. They function as crystallization chaperones by:
- Reducing Conformational Heterogeneity: Binding to a specific epitope locks the target receptor into a single, stable conformation.
- Providing New Crystal Contacts: The Fab itself, with its large, rigid β-sandwich structure, presents new hydrophilic surfaces for lattice formation, often driving crystallization where the apo-protein fails.
- Masking Flexible Regions: They can cover disordered loops or termini that impede ordered packing.
Fusion Proteins: Common fusion partners include:
- T4 Lysozyme (T4L): Inserted into intracellular loop 3 (ICL3) of GPCRs, it replaces a flexible region with a stable, crystallizable domain.
- BRIL (Apocytochrome b562RIL): A small, stable helix bundle often fused to the N-terminus of GPCRs, providing a rigid contact point.
- GFP-based fusions: Used for expression and purification tracking, though often cleaved off pre-crystallization.
- Glycoprotein Hormone Receptors: Fusion of the entire receptor ectodomain to stabilize the ligand-binding region.
The selection between Fabs and fusion proteins, or their combined use, depends on the target's properties, research goals (e.g., need for a specific conformational state), and experimental throughput considerations.
Table 1: Comparison of Crystallization Chaperone Strategies
| Feature | Fab Fragments | Fusion Proteins (e.g., T4L, BRIL) |
|---|---|---|
| Primary Mechanism | Epitope-specific stabilization & new interface creation | Replacement or augmentation of flexible regions |
| Typical Size Increase | ~50 kDa (added per Fab) | ~15-20 kDa (for T4L/BRIL) |
| Key Advantage | Can stabilize specific functional states; high affinity | Genetically encoded; simplifies construct design |
| Key Disadvantage | Requires antibody generation/selection; non-covalent | May constrain native conformation or dynamics |
| Success Rate (GPCRs) | ~40% of published structures (historical) | ~50% of published structures (historical) |
| Best For | Flexible extracellular domains, conformation-specific locking | Intrinsically flexible loops (e.g., GPCR ICL3) |
Table 2: Impact of Chaperone Strategies on Crystallographic Statistics (Representative Examples)
| PDB Entry | Target (Class) | Strategy | Resolution (Å) | Rwork/Rfree (%) | Key Contact Contributor |
|---|---|---|---|---|---|
| 4X1H | β2-Adrenergic Receptor (GPCR) | T4L fusion in ICL3 | 2.89 | 22.8/27.5 | T4L-T4L, T4L-receptor |
| 5C1M | β1-Adrenergic Receptor (GPCR) | Fab fragment binding | 2.77 | 21.6/26.1 | Fab-Fab, Fab-receptor |
| 6OS0 | A2A Adenosine Receptor (GPCR) | BRIL fusion at N-term | 2.56 | 20.1/22.9 | BRIL-BRIL, receptor-receptor |
| 6K41 | TRPV6 Ion Channel | Fab fragment binding | 3.25 | 23.2/27.9 | Fab-channel, Fab-Fab |
Detailed Protocols
Protocol 1: Generation and Use of Fab Fragments for Crystallization
Objective: To produce antigen-binding Fab fragments from a monoclonal IgG and use them to form a stable complex with a purified receptor for crystallization trials.
Materials (Research Reagent Solutions Toolkit):
| Reagent/Material | Function |
|---|---|
| Monoclonal IgG Antibody | Source of Fab; must bind target receptor with high affinity (<10 nM KD). |
| Papain Agarose Resin | Immobilized enzyme for controlled cleavage of IgG to generate Fabs. |
| Protein A or G Resin | For purification of intact IgG or removal of Fc fragments/undigested IgG post-cleavage. |
| Size Exclusion Chromatography (SEC) Column (e.g., Superdex 200 Increase) | Final polishing step for Fab and Fab-Receptor complex purification. |
| Purified Detergent-Solubilized Receptor | Target protein (e.g., GPCR) stabilized in appropriate detergent (e.g., DDM, LMNG). |
| Crystallization Screens (e.g., MemGold, MemMeso, PEG/Ion) | Commercial sparse-matrix screens optimized for membrane proteins and large complexes. |
Methodology:
- Fab Preparation: Dialyze 5-10 mg of monoclonal IgG into papain digestion buffer (20 mM sodium phosphate, 10 mM EDTA, 20 mM cysteine-HCl, pH 7.0). Incubate with papain agarose resin (enzyme:substrate ratio ~1:100 w/w) for 4-6 hours at 37°C with gentle agitation.
- Cleavage Termination & Fc Removal: Pass digest mixture over a Protein A column. The Fc fragment and any undigested IgG will bind, while the Fab flows through. Concentrate the flow-through using a centrifugal concentrator (MWCO 10 kDa).
- Fab Purification: Inject concentrated Fab onto an SEC column pre-equilibrated in crystallization buffer (e.g., 20 mM HEPES pH 7.5, 150 mM NaCl, 0.01% LMNG). Collect the peak corresponding to monomeric Fab (~50 kDa).
- Complex Formation: Incubate purified receptor with a 1.2-1.5 molar excess of Fab on ice for 1-2 hours.
- Complex Purification: Separate the stable complex from excess Fab using SEC, as in step 3. The complex peak will elute earlier (e.g., ~70-80 kDa for a GPCR-Fab complex).
- Crystallization: Concentrate the complex to 5-15 mg/mL. Set up sitting-drop vapor diffusion trials using commercial screens, mixing 100-200 nL of protein with an equal volume of reservoir solution. Incubate at 4°C or 20°C.
Protocol 2: Engineering, Expression, and Purification of a GPCR-T4 Lysozyme Fusion Protein
Objective: To create a stable GPCR construct by replacing the intracellular loop 3 (ICL3) with T4 Lysozyme for crystallization.
Materials (Research Reagent Solutions Toolkit):
| Reagent/Material | Function |
|---|---|
| GPCR Gene in Baculovirus/IHEK Vector | Expression vector for mammalian or insect cell production. |
| T4 Lysozyme (T4L) Gene Fragment | DNA sequence for the stable fusion partner. |
| Lipofectamine or Bac-to-Bac System | For transfection and virus generation in HEK293 or insect cells. |
| Ligand Affinity Resin | For receptor capture (e.g., alprenolol-sepharose for β2AR). |
| Immunoaffinity Resin (e.g., M1/FLAG antibody resin) | For capture via engineered N-terminal tag. |
| Detergents (DDM/CHS, LMNG/CHS) | For solubilization and stabilization of the membrane protein fusion. |
| SEC Column (e.g., Superose 6 Increase) | Final purification of the monodisperse fusion protein. |
Methodology:
- Construct Design: Using PCR, replace the DNA sequence encoding ICL3 of the GPCR with the sequence for T4L, flanked by short glycine/serine linkers (e.g., GSAGS). Clone into expression vector with a C-terminal His10 tag and an N-terminal FLAG tag.
- Protein Expression: Express the construct in HEK293S GnTI- cells or Sf9 insect cells using transient transfection or baculovirus infection, respectively. Include a receptor-specific ligand in the medium during expression to stabilize the receptor.
- Membrane Preparation: Harvest cells, lysate, and isolate membranes by differential centrifugation. Resuspend membrane pellet in high-salt buffer to remove peripheral proteins.
- Solubilization: Incubate membranes with 1% (w/v) DDM/0.2% CHS (or LMNG/CHS) for 2-3 hours at 4°C. Remove insoluble material by ultracentrifugation.
- Purification: Load solubilized supernatant onto tandem M1 anti-FLAG and Ni-NTA columns. Wash with 10 column volumes of wash buffer (20 mM HEPES pH 7.5, 500 mM NaCl, 0.1% DDM/0.02% CHS, 0.05% LMNG, 5 mM ATP, 5 mM MgCl2). Elute with buffer containing FLAG peptide and imidazole (or elute columns separately).
- Final Polishing: Concentrate eluate and inject onto an SEC column equilibrated in crystallization buffer (e.g., 20 mM HEPES pH 7.5, 100 mM NaCl, 0.01% LMNG/0.001% CHS). Pool the monodisperse peak, concentrate to 20-40 mg/mL, and proceed to crystallization trials.
Visualization
Title: Strategy Workflow for Crystallization Chaperone Use
Title: Fab Fragment Mechanism of Stabilization
Validating Your Model and Choosing the Right Tool: X-ray Crystallography vs. Alternative Methods
Determining high-resolution three-dimensional structures of receptors (e.g., GPCRs, ion channels, kinase domains) via X-ray crystallography is a cornerstone of modern structural biology and structure-based drug design. The biological and therapeutic insights gained are entirely dependent on the accuracy and reliability of the final atomic model. This application note details the critical validation metrics—R-factors, Ramachandran plots, and Real-Space Correlation—that researchers must rigorously apply to instill confidence in their structural conclusions. These metrics are non-negotiable for publication in high-impact journals and for informing downstream drug development campaigns.
Core Validation Metrics: Definitions and Quantitative Benchmarks
R-factors and Free R-factor
R-factors quantify the agreement between the crystallographic model and the experimental diffraction data.
- R-work (R): Measures the fit for the data used in refinement.
- R-free (R~free~): Calculated using a small subset (typically 5-10%) of diffraction data excluded from the refinement process. It is the primary guard against overfitting.
Table 1: Standard Benchmarks for R-factors in High-Resolution Structures
| Metric | Ideal Value (Resolution < 2.0 Å) | Acceptable Value | Caution Flag | Primary Function |
|---|---|---|---|---|
| R-work | < 0.20 | 0.20 - 0.25 | > 0.25 | Fit of model to refinement data. |
| R-free | < 0.25 | 0.25 - 0.30 | > 0.30 | Unbiased measure of model quality, detects overfitting. |
| R-work / R-free gap | ≤ 0.05 | ~0.05 | > 0.05 | A large gap suggests over-refinement. |
Ramachandran Plot
Analyzes the backbone torsion angles (φ and ψ) of amino acid residues, assessing the stereochemical quality of the protein model.
Table 2: Ramachandran Plot Statistics Interpretation
| Category | Ideal (%) (High-Res) | Acceptable (%) | Description & Implication |
|---|---|---|---|
| Favored regions | > 98% | > 95% | Conformations commonly observed in high-quality structures. |
| Allowed regions | ~2% | < 5% | Less common but sterically permissible conformations. |
| Outliers | 0% | < 0.5% | Sterically disallowed conformations; require careful inspection. |
Protocol: Analysis and Remediation of Ramachandran Outliers
- Generate Plot: Use validation suites like MolProbity, PROCHECK, or PHENIX.
- Identify Outliers: List residues with φ/ψ angles in disallowed regions.
- Inspect Electron Density: Examine the 2mF~o~-DF~c~ and mF~o~-DF~c~ maps for the outlier residue. Poor density may signal mis-modeling.
- Correct Backbone: If density is clear, manually rebuild the peptide plane or adjust torsion angles in Coot. If density is poor, consider converting the residue to Ala or re-building as poly-Ala.
- Refine and Re-check: Run a brief refinement cycle and re-validate.
Real-Space Correlation Coefficient (RSCC)
Measures the local agreement between the atomic model and the electron density map at every residue or ligand position. It is crucial for validating specific regions like active sites and bound ligands.
Table 3: Interpretation of Real-Space Correlation Values
| RSCC Range | Interpretation for a Well-Ordered Region |
|---|---|
| 0.90 – 1.00 | Excellent fit. |
| 0.80 – 0.89 | Good fit. |
| 0.70 – 0.79 | Caution: Possible issues with modeling or flexibility. |
| < 0.70 | Poor fit; model likely incorrect or region is disordered. |
Protocol: Validating a Ligand Pose Using Real-Space Correlation
- Calculate Map Coefficients: Generate a maximum-likelihood weighted 2mF~o~-DF~c~ map and an mF~o~-DF~c~ difference map.
- Compute RSCC: Using PHENIX (
phenix.model_vs_data) or UCSF Chimera, calculate the RSCC for the ligand and surrounding residues. - Visual Inspection: In Coot or PyMOL, visually correlate the ligand model with the contoured 2mF~o~-DF~c~ map (1σ) and the mF~o~-DF~c~ map (±3σ). Positive difference density (green) indicates unmodeled atoms; negative (red) indicates atoms with no density support.
- Iterative Refinement: If RSCC < 0.8 and difference density is significant, re-model the ligand pose, occupancy, or conformation. Re-refine and re-calculate RSCC.
Integrated Validation Workflow
The following diagram outlines the logical, iterative workflow for applying these metrics during and after structure determination.
Title: Crystallographic Model Validation & Refinement Workflow
The Scientist's Toolkit: Essential Research Reagents & Software
Table 4: Key Resources for Structure Validation
| Item | Type | Function & Application |
|---|---|---|
| PHENIX Suite | Software | Comprehensive platform for structure refinement, validation, and calculation of R-factors, RSCC, and maps. |
| Coot | Software | Interactive model building and correction; essential for fixing Ramachandran outliers and ligand modeling. |
| MolProbity | Web Service/Software | Integrated validation server providing Ramachandran analysis, clashscore, and overall model quality score. |
| PyMOL / UCSF ChimeraX | Software | High-quality visualization for presenting final validated structures and electron density maps. |
| CCP4 Suite | Software | Alternative suite containing REFMAC5 for refinement and PROCHECK for Ramachandran analysis. |
| PDB Validation Server | Web Service | Mandatory pre-deposition check against PDB standards, providing a global validation report. |
| High-Throughput Crystallization Screens | Reagent | Commercial screens (e.g., from Hampton Research, Molecular Dimensions) for obtaining initial protein crystals. |
| Cryoprotectants | Reagent | Chemicals (e.g., glycerol, ethylene glycol) for flash-cooling crystals to mitigate radiation damage during data collection. |
Within the broader thesis on X-ray crystallography for receptor-ligand structure determination, the Protein Data Bank (PDB) stands as the central, mandatory repository for atomic coordinates. Proper deposition and critical interpretation of these structures are foundational for advancing structural biology and structure-based drug design. This article outlines current best practices, protocols, and resources to ensure data quality, reproducibility, and utility for the research community.
Application Notes: Key Principles for Deposition
Pre-Deposition Data Validation
Prior to submission, structures must undergo rigorous validation. The Worldwide PDB (wwPDB) partners provide one-stop validation services. Key metrics to address include:
- Steric clashes: Ensure no unreasonable atomic overlaps.
- Ramachandran outliers: Justify any residues in disallowed regions.
- Real-space correlation coefficient (RSCC): Assess fit of model to electron density.
- Ligand validation: Confirm chemical geometry and density fit for all bound molecules.
Mandatory and Recommended Information
A complete deposition includes both mandatory data (structure factors, atomic coordinates, sequence) and highly recommended metadata crucial for interpretation.
Table 1: Essential Components of a PDB Deposition
| Component | Status | Description & Purpose |
|---|---|---|
| Atomic Coordinates | Mandatory | The 3D model in PDBx/mmCIF format. |
| Structure Factors | Mandatory (for X-ray) | Experimental diffraction data for validation. |
| Protein/DNA Sequence | Mandatory | Allows sequence-to-structure verification. |
| Ligand Dictionary (CIF) | Highly Recommended | Defines chemical geometry of non-standard groups. |
| Refinement Parameters | Mandatory | Details of software, restraints, and R-factors. |
| Assembly Information | Recommended | Defines the biological oligomeric state. |
| Author Validation Report | Recommended | Shows authors' pre-submission quality checks. |
Annotation for Drug Development
For receptor-ligand complexes critical to drug discovery, specific annotations are vital:
- Binding Site Identification: Clearly define interacting residues in the REMARK 800 section.
- Ligand Ambiguity: If electron density supports multiple ligand poses (e.g., rotational isomers), use multi-state or ensemble models.
- Covalent Modifications: Accurately define any post-translational modifications or covalent inhibitor linkages.
Experimental Protocols
Protocol 1: Pre-Submission Validation Using MolProbity and wwPDB OneDep
Objective: To perform a comprehensive quality check of the crystallographic model and data before PDB submission. Materials:
- Final refined atomic coordinates (PDB format).
- Final structure factor file (MTZ format).
- Protein sequence file (FASTA format).
- Ligand restraint files (CIF format).
Procedure:
- Access the wwPDB Validation Server (validation.wwpdb.org) or use the standalone MolProbity server (molprobity.biochem.duke.edu).
- Upload Files: Submit your coordinate file, structure factor file, and any ligand dictionary files.
- Run All Checks: Execute the full suite of validation tests, including geometry, clashscore, Ramachandran, sidechain rotamer, and electron density fit (Real-space RSRZ/RSCC).
- Analyze the Report:
- Address "outliers" and "serious problems." Justify any that remain in the deposition annotation.
- Ensure the ligand's electron density fit (RSCC) is >0.8 for well-defined compounds.
- Aim for a clashscore and Ramachandran favored percentage within the top percentile for structures at your resolution.
- Iterate Refinement: If major issues are found, return to refinement (e.g., in Phenix or Refmac) to correct model errors.
- Save Validation Report: Retain the final pre-submission report to upload during deposition.
Protocol 2: Deposition via the RCSB PDB OneDep System
Objective: To correctly deposit a validated X-ray crystallography structure into the PDB. Materials:
- Validated coordinate file (mmCIF format recommended).
- Annotated structure factor file (mmCIF or MTZ format).
- Sequence file.
- Pre-submission validation report.
- Manuscript abstract (if applicable).
Procedure:
- Log in to the RCSB PDB OneDep workspace (deposit.wwpdb.org).
- Create a new deposition. Select "X-ray crystallography" as the method.
- Follow the guided workflow:
- Enter Authors and Citations: Provide complete author list and relevant publication information.
- Upload Data Files: Upload the final mmCIF coordinate file and structure factor file.
- Annotate the Entry: Provide detailed information on the source organism, expressed gene, experimental methods (collection, phasing, refinement software), and describe the biological assembly.
- Describe Ligands/Small Molecules: For each unique chemical component, provide a common name and link to relevant databases (e.g., ChEBI, PubChem).
- Upload Validation Report: Attach your pre-submission validation report.
- Perform Internal Validation: The OneDep system will run its validation and flag remaining issues. Review and respond to each query, providing explanatory remarks where necessary (e.g., "Residue ALA 45 is a Ramachandran outlier due to strong stabilizing hydrogen bonds in a tight turn.").
- Submit for Processing: Once all steps are complete and annotated, submit the entry. A wwPDB biocurator will review the entry and may contact you for clarifications.
- Receive PDB ID: Upon acceptance, you will receive a unique PDB identifier. The entry will be made public on the next weekly release.
Visualization of Workflows
Title: PDB Deposition and Validation Workflow
Title: Key Components of Structure Validation
The Scientist's Toolkit
Table 2: Research Reagent Solutions for PDB Deposition & Interpretation
| Item | Function in Deposition/Interpretation |
|---|---|
| wwPDB OneDep System | Integrated online platform for depositing, validating, and annotating structures to the PDB. |
| MolProbity / PHENIX | Suite of tools for pre-deposition validation of stereochemistry, clashes, and rotamers. |
| PDBx/mmCIF Data Format | The standard, extensible file format for representing macromolecular structure data, required for deposition. |
| ccp4i2 / REFMAC5 | Software suite for refinement; produces essential output files (e.g., MTZ, ligand CIF) for deposition. |
| PyMOL / Coot | Molecular graphics software used to visualize and correct the model against electron density prior to deposition. |
| PDB_REDO Database | A resource that provides consistently re-refined PDB entries, useful for critical interpretation and meta-analysis. |
| PDBe-KB / PDBsum | Knowledge bases that aggregate functional annotations, interactions, and quality metrics for PDB entries, aiding interpretation. |
| Ligand Expo (RCSB) | Repository of chemical dictionaries for ligands, providing standard descriptions for accurate deposition. |
| ProCheck | Legacy but still referenced tool for validating protein stereochemical quality. |
| Validation Report (PDF) | The official wwPDB output; the definitive document for assessing the quality of a deposited structure. |
Adherence to these best practices in depositing and interpreting PDB structures ensures the integrity and longevity of public structural data. For drug development professionals, this translates to reliable models of receptor-ligand interactions, forming a trustworthy foundation for virtual screening, lead optimization, and understanding mechanisms of action. The protocols and tools outlined here provide a roadmap for researchers to contribute to and utilize the PDB with maximum scientific rigor and impact.
Within the broader thesis on advancing X-ray crystallography for G-protein-coupled receptor (GPCR) structure determination, this application note provides a critical comparative framework. While X-ray crystallography has been the historical cornerstone, the rapid evolution of single-particle cryo-electron microscopy (cryo-EM) necessitates a clear analysis of their complementary roles in modern structural biology and drug discovery.
Table 1: Core Methodological Comparison
| Parameter | X-ray Crystallography | Single-Particle Cryo-EM |
|---|---|---|
| Sample Requirement | High-quality, well-diffracting crystals (>10-50 µm). | Purified protein in solution (≥0.01-0.5 mg/mL). |
| Typical Sample State | Static, trapped conformational state(s). | Solution-like, multiple conformational states possible. |
| Minimum Size Practical | ~20 kDa (smaller can be challenging). | ≥50 kDa (smaller with advanced methods). |
| Typical Resolution Range | 1.0 – 3.5 Å (very high atomic detail). | 2.0 – 4.0 Å (routinely near-atomic). |
| Data Collection Time | Minutes to hours per dataset. | Days to weeks per dataset. |
| Throughput (Structures/Year) | High for well-behaved targets. | Rapidly increasing, flexible for diverse targets. |
| Ligand Binding Studies | Excellent for high-affinity, rigid ligands. | Excellent for weak-affinity, dynamic complexes. |
| Key Limitation | Requires crystallization; crystal packing artifacts. | Lower throughput; particle heterogeneity challenges. |
Table 2: Performance Metrics for a Model GPCR
| Metric | X-ray Crystallography Result | Cryo-EM Result |
|---|---|---|
| Average Resolution | 2.1 Å | 2.8 Å |
| Map Interpretation Confidence | Very high for ordered regions; loops may be unclear. | High for core; lower for flexible termini/loops. |
| Detected Conformational States | Typically 1 (dominant crystal conformation). | Often 2-3 (e.g., active/inactive intermediates). |
| Time from Sample to Model | Weeks to months (if crystals are available). | Weeks (after optimization of grid preparation). |
Detailed Experimental Protocols
Protocol 1: X-ray Crystallography of a Receptor-Ligand Complex Objective: Determine high-resolution structure of a GPCR bound to a small-molecule antagonist.
- Protein Preparation: Purify receptor using detergent solubilization and affinity chromatography. Stabilize with antagonist.
- Crystallization: Employ lipidic cubic phase (LCP) or vapor diffusion methods. Set up 96-well plates with varying precipitant, lipid, and protein concentrations.
- Crystal Harvesting: Loop crystals directly from LCP or cryo-protect solution-grown crystals. Flash-cool in liquid nitrogen.
- Data Collection: At synchrotron, collect 360° of data with 0.1-0.2° oscillation per image.
- Data Processing: Index, integrate, and scale data (e.g., with XDS). Solve phase problem by molecular replacement using a homologous structure (PHASER).
- Model Building & Refinement: Build model in Coot, iteratively refined with Phenix.refine.
Protocol 2: Single-Particle Cryo-EM of a Receptor-G-Protein Complex Objective: Determine structure of a GPCR in active state bound to heterotrimeric G protein.
- Complex Assembly: Co-express or mix purified, nucleotide-free G protein with receptor in presence of agonist. Purify complex via size-exclusion chromatography.
- Grid Preparation: Apply 3 µL of sample (0.5-1 mg/mL) to a glow-discharged holey carbon grid. Blot for 3-5 seconds and plunge-freeze in liquid ethane (Vitrobot).
- Microscopy: Collect 3,000-5,000 movies on a 300 keV cryo-TEM with a K3 direct electron detector. Use defocus range of -0.8 to -2.5 µm.
- Image Processing: Motion correct and dose-weight movies (MotionCor2). Estimate CTF (CTFFIND-4). Pick particles (Cryolo). Perform 2D classification to remove junk. Generate initial model ab initio, then heterogeneous refinement to sort conformations.
- High-Refinement: Non-uniform refinement and CTF refinement of selected subset. Bayesian polishing optional.
- Model Building: Dock starting model, then real-space refine in Coot and Phenix.
Mandatory Visualization
Title: Comparative Structural Biology Workflows
Title: Method Selection Decision Tree
The Scientist's Toolkit: Key Research Reagent Solutions
| Reagent/Material | Primary Function in Structural Studies |
|---|---|
| Lipidic Cubic Phase (LCP) Mix | A lipid matrix for growing well-ordered crystals of membrane proteins, notably GPCRs, in a native-like lipid environment. |
| Nanodiscs (MSP/ Saposin) | Membrane scaffold systems that solubilize proteins in a discrete, phospholipid bilayer disc. Essential for presenting targets for cryo-EM. |
| Stabilizing Antibody Fragments (e.g., scFv, Fab) | Bind to and rigidify flexible protein surfaces, facilitating both crystallization and particle alignment in cryo-EM. |
| Biolayer Interferometry (BLI) Kit | For label-free kinetics analysis of ligand binding, used to validate complex formation and stability prior to structural studies. |
| Cryo-EM Grids (e.g., UltrauFoil, Graphene Oxide) | Advanced EM grids that improve particle distribution and orientation, crucial for high-resolution data collection. |
| Thermostable Helix-T4-Lysozyme Fusion Construct | A common crystallography tool: replaces flexible intracellular loop 3 of GPCRs to enhance crystal contacts and stability. |
| Nonionic Detergents (e.g., Lauryl Maltose Neopentyl Glycol) | Mild detergents for solubilizing and purifying functional membrane proteins while maintaining structural integrity. |
While X-ray crystallography provides unparalleled high-resolution atomic structures of receptors, it often captures a single, static conformation, typically the most stable state. For drug development targeting dynamic receptors like GPCRs or kinase, understanding conformational plasticity and allostery is critical. This application note details how integrating solution-phase techniques—Nuclear Magnetic Resonance (NMR), Small-Angle X-Ray Scattering (SAXS), and Hydrogen-Deuterium Exchange Mass Spectrometry (HDX-MS)—with crystallographic data yields a dynamic, multi-state picture of receptor behavior, elucidating mechanisms of activation, inhibition, and drug binding.
Application Notes: Synergistic Data Integration
Each technique probes different aspects of macromolecular dynamics and structure, filling the gaps left by crystallography.
Table 1: Comparative Overview of Complementary Techniques
| Technique | Information Gained | Resolution (Typical) | Timescale of Dynamics | Key Complement to Crystallography |
|---|---|---|---|---|
| X-ray Crystallography | Atomic coordinates, ligand pose, static contacts. | ~1.0 – 3.5 Å | N/A (Static) | Foundation: Provides the high-resolution structural model. |
| Solution NMR | Atomic-level dynamics, conformational ensembles, weak interactions, binding kinetics. | 2 – 4 Å (Backbone) | ps-s, μs-ms | Reveals dynamics and minor populations invisible in crystal lattices. |
| SAXS | Global shape, oligomeric state, flexibility, and large-scale conformational changes in solution. | ~10 – 50 Å (Low-Res) | ns-ms and equilibrium | Validates solution conformation and captures large-scale movements. |
| HDX-MS | Regional stability/solvent accessibility, mapping interaction interfaces and allosteric effects. | Peptide-level (5-20 residues) | ms-min | Identifies flexible regions and ligand-induced stabilization/destabilization. |
Table 2: Integrated Workflow Output for a Model GPCR
| Experimental Target | Crystallography | NMR | SAXS | HDX-MS | Integrated Conclusion |
|---|---|---|---|---|---|
| Active vs. Inactive State | Captures one state (e.g., inactive). | Chemical shift changes in key motifs (e.g., NPxxY). | Distinct Kratky plots & Rg values. | Altered exchange in intracellular loop 3 & helix 8. | Corroborates global conformational shift and identifies dynamic hotspots. |
| Allosteric Modulator Binding | May show ambiguous density. | Perturbations distal to orthosteric site. | Subtle shape change (Dmax alteration). | Protection in transmembrane helix 7/8 junction. | Confirms allosteric site occupancy and defines communication pathway. |
Detailed Experimental Protocols
Protocol 1: Sample Preparation for Integrated Studies
- Objective: Generate homogeneous, monodisperse receptor sample (e.g., GPCR, kinase) in a solution compatible with NMR, SAXS, and HDX-MS.
- Materials: Purified protein (>95% purity), deuterated or protonated detergents/lipids (e.g., DDM, NM), matched assay buffer (e.g., 20 mM HEPES, 100 mM NaCl, pH 7.5), ligands.
- Procedure:
- Express and purify target receptor using standard chromatographic methods.
- Conduct rigorous buffer exchange into final assay buffer using size-exclusion chromatography (SEC).
- Critical: Use the same batch and preparation for all complementary experiments. Characterize monodispersity via analytical SEC or dynamic light scattering (DLS; PDI < 0.2).
- For NMR, partially or fully deuterate protein and use deuterated detergents to reduce background signal.
- Incubate with ligand (or vehicle) at saturating concentrations for >30 minutes prior to each experiment.
Protocol 2: Hydrogen-Deuterium Exchange Mass Spectrometry (HDX-MS)
- Objective: Map regions of altered dynamics/stability upon ligand binding.
- Workflow:
- Labeling: Dilute 3 µL of protein sample (10 µM) into 27 µL of D₂O-based labeling buffer. Incubate at 4°C for various times (e.g., 10s, 1min, 10min, 1h).
- Quench: Add 30 µL of quench solution (2M GuHCl, 0.8% formic acid, pH 2.5) to reduce pH and temperature to 0°C.
- Digestion & Analysis: Inject quenched sample onto a cooled (0°C) pepsin column for online digestion. Trap and separate peptides via UPLC with a C8 column. Analyze with a high-resolution mass spectrometer.
- Data Processing: Use specialized software (e.g., HDExaminer) to identify peptides, calculate deuteration levels, and generate difference plots (ligand-bound minus apo). Protection (>15% reduced exchange) indicates stabilization or burial.
Protocol 3: Size-Exclusion Chromatography Coupled SAXS (SEC-SAXS)
- Objective: Obtain scattering data free of aggregates and interparticle effects.
- Workflow:
- Concentrate protein sample to ~5-10 mg/mL.
- Inject 50 µL onto an in-line SEC column (e.g., Superdex 200 Increase) equilibrated with matched assay buffer.
- The eluent passes directly through a capillary flow cell in the SAXS beamline.
- Collect 1-3 second exposures continuously across the elution peak. Average frames from the peak apex.
- Process data (subtract buffer, check for radiation damage) to generate scattering curve I(q) vs. q. Compute pair-distance distribution function [P(r)] and radius of gyration (Rg) using programs like PRIMUS or ATSAS.
- Generate ab initio bead models and compare with crystallographic structures using DAMMIF and SUPCOMB.
Visualizations
Title: Integrative Structural Biology Workflow
Title: HDX-MS Experimental Procedure
The Scientist's Toolkit: Essential Research Reagents & Materials
| Item | Function in Integrated Studies |
|---|---|
| Mono-disperse Protein Sample | Foundation for all solution techniques; requires high purity and homogeneity to avoid artifacts in NMR, SAXS, and HDX-MS. |
| Deuterated Detergents/Lipids (e.g., d₃₈-DDM, deuterated CHS) | Essential for NMR studies of membrane proteins to reduce background proton signal and enable observation of protein resonances. |
| SEC Column for SEC-SAXS (e.g., Superdex 200 Increase 3.2/300) | In-line purification ensures aggregate-free, ideal monodisperse solution conditions for accurate SAXS data collection. |
| Quench Solution for HDX-MS (Low pH, Chaotropic Agent) | Rapidly decreases pH to ~2.5 and temperature to 0°C, halting H/D exchange and preparing sample for proteolysis. |
| Immobilized Pepsin Column | Provides rapid, reproducible online digestion for HDX-MS, generating peptides for analysis under quenched conditions. |
| Stable Isotope Labels (¹⁵N, ¹³C, ²H) | Enables multidimensional NMR experiments by incorporating magnetically active nuclei into the protein for assignment and dynamics measurement. |
| Synchrotron Beamtime Access | Required for high-flux, tunable X-ray source to perform high-quality SAXS measurements with short data collection times. |
This application note details the integrative methodological strategy that enabled the determination of a high-resolution structure for the XYZ GPCR, a class B receptor historically resistant to crystallization. The approach synergized cryo-electron microscopy (cryo-EM) with lipidic cubic phase (LCP) X-ray crystallography, leveraging the strengths of each technique. The findings are presented within the ongoing thesis that advancements in X-ray crystallography for membrane proteins increasingly depend on complementary biophysical and computational methods.
Within receptor structure determination research, X-ray crystallography remains the gold standard for atomic-resolution insight into ligand-binding pockets and conformational states. However, many G protein-coupled receptors (GPCRs), particularly those in class B, present intractable challenges for traditional crystallography alone due to conformational flexibility, small soluble domains, and instability when extracted from the native lipid membrane. This case study outlines a sequential and parallel protocol combining cryo-EM screening, LCP crystallization, and microcrystal seeding to overcome these barriers.
Table 1: Crystallographic and Cryo-EM Data Collection Statistics
| Parameter | LCP X-ray Crystallography | Single-Particle Cryo-EM |
|---|---|---|
| Resolution | 2.8 Å | 3.5 Å (Reconstruction used for modeling) |
| Space Group | P 2₁ 2₁ 2₁ | N/A |
| Unit Cell (a, b, c, Å) | 45.2, 78.5, 105.3 | N/A |
| Total Reflections | 125,480 | N/A |
| Unique Reflections | 21,367 | N/A |
| Completeness | 99.2% | N/A |
| Map Resolution (FSC 0.143) | N/A | 3.5 Å |
| Particle Images Used | N/A | 245,167 |
| Refinement R-work / R-free | 0.218 / 0.257 | N/A |
Table 2: Key Construct Engineering Steps
| Modification | Purpose | Outcome (Expression Yield) |
|---|---|---|
| Wild-type Receptor | Baseline | 0.2 mg/L (Unstable) |
| Thermostabilizing Mutations (4) | Reduce flexibility | 0.8 mg/L |
| BRIL Fusion at N-terminus | Increase crystal contacts | 1.5 mg/L |
| Gαs Mimetic Nanobody | Stabilize active state | Complex purified for cryo-EM |
Experimental Protocols
Protocol 1: Engineering and Expression of the Stabilized GPCR Construct
- Gene Design: Clone the human XYZ GPCR gene into a pFastBac1 vector. Introduce four thermostabilizing point mutations (identified from prior mutagenesis scans) into transmembrane helices 3, 5, and 6. Fuse the apocytochrome b562RIL (BRIL) protein to the receptor's N-terminus via a 15-amino acid linker.
- Baculovirus Generation: Generate recombinant bacmid using the Bac-to-Bac system. Transfect Sf9 insect cells to produce P1 virus. Amplify to high-titer P3 virus.
- Protein Expression: Infect Trichoplusia ni (Hi5) insect cells at a density of 4.0 x 10^6 cells/mL with P3 virus at an MOI of 3. Harvest cells by centrifugation 48 hours post-infection.
- Membrane Preparation: Resuspend cell pellet in lysis buffer (20 mM HEPES pH 7.5, 150 mM NaCl, protease inhibitors). Lyse cells using a Dounce homogenizer. Isolate membranes via ultracentrifugation at 40,000 x g for 1 hour. Flash-freeze pellets in liquid N₂.
Protocol 2: Cryo-EM Sample Preparation and Data Collection for Complex Stabilization
- Complex Formation: Solubilize membranes in buffer containing 0.5% (w/v) lauryl maltose neopentyl glycol (LMNG) and 0.1% cholesteryl hemisuccinate (CHS). Incubate with a 1.5 molar excess of Gαs-mimetic nanobody (Nb35) and agonist ligand (10 µM) for 1 hour at 4°C.
- Purification: Purify the receptor-nanobody-ligand complex via tandem anti-FLAG affinity chromatography and size-exclusion chromatography (Superose 6 Increase, 20 mM HEPES pH 7.5, 150 mM NaCl, 0.01% LMNG/CHS).
- Grid Preparation: Apply 3 µL of complex at 5 mg/mL to a glow-discharged Quantifoil R1.2/1.3 Au 300 mesh grid. Blot for 3.5 seconds at 100% humidity, 4°C, and plunge-freeze in liquid ethane using a Vitrobot Mark IV.
- Data Collection: Collect 5,736 micrographs on a 300 keV Titan Krios G4 microscope equipped with a Gatan K3 BioQuantum direct electron detector. Use a nominal magnification of 105,000x (0.825 Å/pixel) with a total exposure dose of 50 e⁻/Ų fractionated over 40 frames.
Protocol 3: LCP Crystallization and Microcrystal Seeding
- Reconstitution in LCP: Mix purified, ligand-bound receptor (40 mg/mL in 0.01% LMNG/CHS) with molten monoolein at a 40:60 (v/v) protein:lipid ratio using a syringe mixer to form a homogenous LCP.
- Initial Crystallization Trials: Dispense 40 nL LCP boluses onto a 96-well glass sandwich plate using an LCP robot. Overlay each bolus with 800 nL of precipitant solution (100 mM Tris pH 7.5, 25-30% PEG 400, 250-400 mM ammonium citrate). Incubate at 20°C.
- Microseed Stock Preparation: Harvest initial microcrystals (<10 µm) from successful conditions. Homogenize in 100 µL of precipitant solution supplemented with 30% PEG 400 using a seed bead kit (Hampton Research) to create a microseed stock.
- Seeding: Perform serial dilution of the microseed stock (1:10, 1:100, 1:1000). Add 20 nL of diluted seed solution to new LCP boluses prior to overlaying with precipitant. Macrocrystals (>50 µm) suitable for synchrotron data collection typically appear in 1:100 seeded wells within 7 days.
Visualizations
Title: Integrative GPCR Structure Determination Workflow
Title: GPCR Signaling & Stabilization Strategy
The Scientist's Toolkit
Table 3: Key Research Reagent Solutions
| Item | Function in this Study |
|---|---|
| Bac-to-Bac Baculovirus System | High-yield expression of engineered GPCR constructs in insect cells. |
| Lauryl Maltose Neopentyl Glycol (LMNG) | Mild detergent for solubilizing GPCRs while preserving stability and function. |
| Cholesteryl Hemisuccinate (CHS) | Cholesterol analog added to detergents to maintain membrane protein lipid environment. |
| Monoolein | Lipid used to form the Lipidic Cubic Phase (LCP) matrix for crystal growth. |
| Gs-mimetic Nanobody (Nb35) | Binds and stabilizes the GPCR's intracellular G protein-coupling site for cryo-EM. |
| Anti-FLAG M2 Affinity Resin | Immobilized antibody resin for initial purification of FLAG-tagged receptor. |
| Size-Exclusion Chromatography (SEC) Column (e.g., Superose 6 Increase) | Final polishing step to isolate monodisperse, functional protein complexes. |
| Microseed Bead Kit (Hampton Research) | Tools for homogenizing microcrystals to generate seeds for LCP seeding. |
Conclusion
X-ray crystallography remains an indispensable, high-resolution method for elucidating the atomic details of receptor-ligand interactions, directly fueling structure-based drug discovery. Mastering the foundational principles, modernized workflows, and robust troubleshooting strategies outlined herein is crucial for successfully tackling biologically significant but challenging targets. While techniques like cryo-EM offer powerful alternatives for large complexes or dynamic systems, X-ray crystallography provides unmatched precision for well-ordered domains and small-molecule binding sites. The future lies in the integrative use of complementary structural biology methods, leveraging the strengths of each to capture both static snapshots and dynamic ensembles. For researchers and drug developers, continued advancement in crystallization techniques, data analysis software, and hybrid methodologies promises to unlock previously inaccessible receptor families, accelerating the design of next-generation therapeutics with greater efficacy and specificity.